

Euro edges up against US Dollar in countdown to US Midterm elections

Source Fxstreet
  • Euro ticks higher against the US Dollar amid caution ahead of US Midterm elections.
  • ING says Democrats have a 70-72% chance of taking both the House and the Senate.
  • Investors also await the US JOLTS Job Openings and the flash Eurozone HICP data.

The Euro (EUR) trades marginally higher at around 1.1195 against the US Dollar (USD) during the European trading session on Tuesday. The EUR/USD pair ticks up as the US Dollar is under pressure amid caution ahead of United States (US) Midterm elections later in the day.

At press time, the US Dollar Index (DXY), which gauges the Greenback’s value against six major currencies, trades slightly lower to near 101.73.

Dollar outlook clouded as US midterm odds point to Democrat sweep

ING’s Chris Turner flags the US midterm elections as the key event risk for FX this week, noting that betting markets now give the Democrats a “70-72% chance of taking both the House and the Senate.” He argues that “one could make the case that the Dollar should come lower on such an outcome,” as a Democrat clean sweep would likely “lead to gridlock on the debt ceiling, a prolonged government shutdown next year and could encourage President Trump to pursue an even more activist foreign policy agenda.” Against that backdrop, Turner suggests investors will be weighing these political risks against the still-supportive mix of strong US growth, above-target inflation and ongoing Fed tightening for the Dollar and DXY around the 102.00 area.

On the economic front, investors await the JOLTS Job Openings data for September, which will be published at 15:00 GMT. According to estimates, US employers posted 7.13 million fresh jobs, slightly higher than 7.097 million in August.

In the Eurozone, investors await the preliminary Harmonized Index of Consumer Prices (HICP) data for October, which will be released on Wednesday. The data is expected to have a significant impact on European Central Bank’s (ECB) monetary policy expectations.

The HICP growth is expected to have remained at 3.9% Year-on-Year (YoY), faster than 3.8% in September. The core HICP – which strips off volatile components like food, energy, alcohol, and tobacco – is seen remaining steady at 2.5% YoY.

EUR/USD Technical Analysis
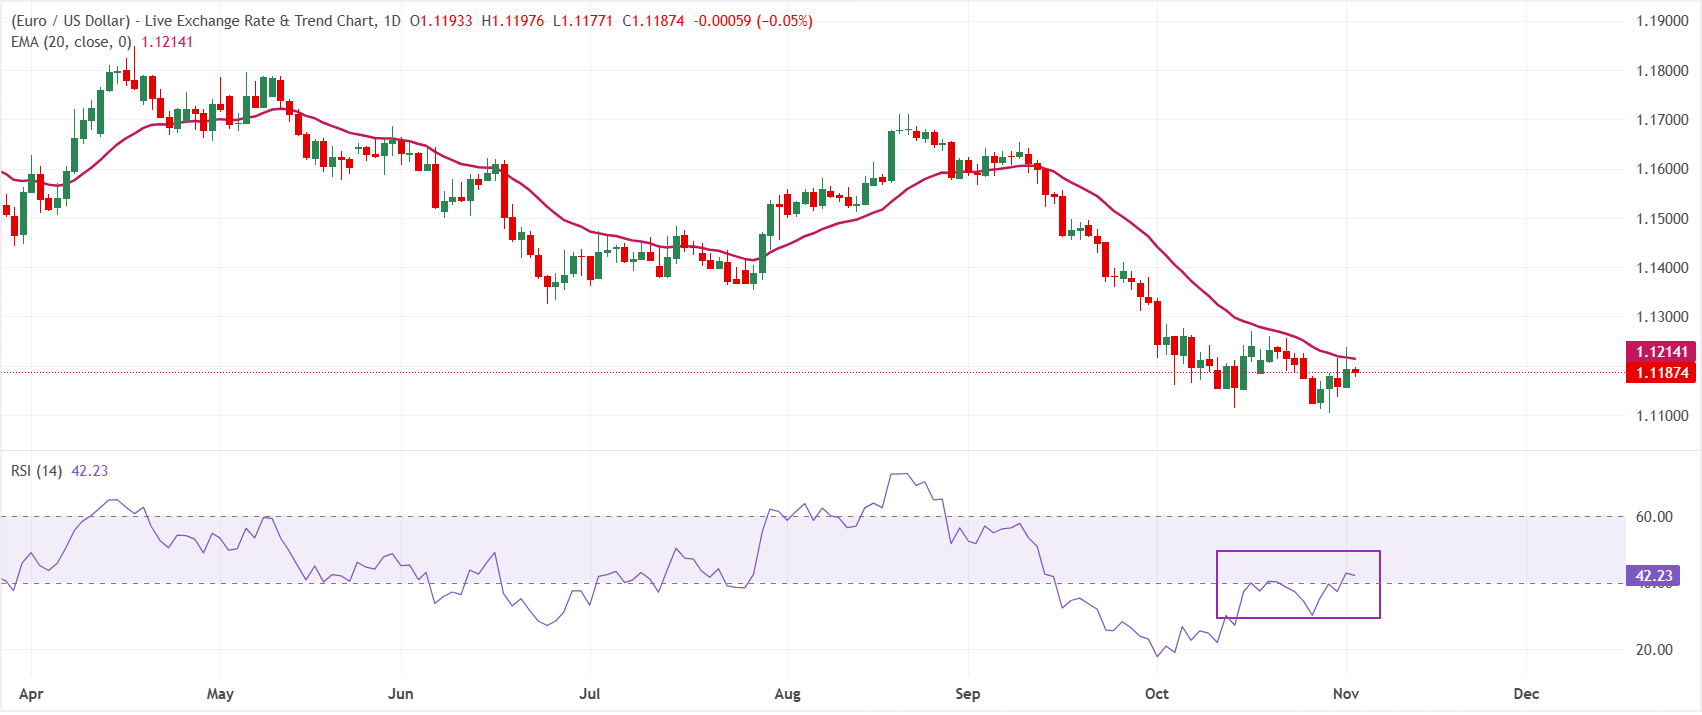
In the daily chart, EUR/USD trades at 1.1187, maintaining a bearish near-term bias as spot holds beneath the 20-day exponential moving average (EMA) at 1.1214. The pair continues to trade below this short-term trend gauge, suggesting rallies remain capped, while the Relative Strength Index (14) around 42 hints at moderating downside pressure but stops short of signaling oversold conditions.

On the topside, immediate resistance is located at the 20-day EMA at 1.1214, and a sustained break above this level would be needed to ease the current bearish tone and allow for a more constructive recovery phase. In the absence of clearly defined nearby support levels from the present dataset, traders may instead look to price action around recent lows to gauge whether selling momentum resumes or consolidative flows dominate.

(The technical analysis of this story was written with the help of an AI tool. Know more.)

Economic Indicator

JOLTS Job Openings

JOLTS Job Openings is a survey done by the US Bureau of Labor Statistics to help measure job vacancies. It collects data from employers including retailers, manufacturers and different offices each month.

Read more.

Next release: Tue Nov 03, 2026 15:00

Frequency: Monthly

Consensus: 7.13M

Previous: 7.079M

Source: US Bureau of Labor Statistics

Disclaimer: For information purposes only. Past performance is not indicative of future results.
placeholder
Gold Price Analysis Today | Forex Gold Analysis | XAU/USD Analysis - November 11, 2026Get the latest gold price analysis, forex gold insights, and XAU/USD analysis for November 11, 2026. Read on for the details.
Author  Mitrade
Nov 11, Wed
Get the latest gold price analysis, forex gold insights, and XAU/USD analysis for November 11, 2026. Read on for the details.
placeholder
Bitcoin lost its 200-day average — but the exit started three sessions before the CPIBitcoin fell 2.5% to about $73,400 on 11 November, an 11-week low, breaking its 200-day moving average near $73,100. The 24-hour liquidation tally reached $632 to $705 million, roughly 82% of it longs. But spot ETF outflows began three sessions earlier and USDT's market cap has shrunk $6.6 billion in 60 days — the leveraged length left before the inflation print did. A double top at 81,890 and 81,080 leaves a measured target of 69,366.
Author  Suzie
Nov 11, Wed
Bitcoin fell 2.5% to about $73,400 on 11 November, an 11-week low, breaking its 200-day moving average near $73,100. The 24-hour liquidation tally reached $632 to $705 million, roughly 82% of it longs. But spot ETF outflows began three sessions earlier and USDT's market cap has shrunk $6.6 billion in 60 days — the leveraged length left before the inflation print did. A double top at 81,890 and 81,080 leaves a measured target of 69,366.
placeholder
Nvidia slid 7.7% after hours while AMD and Broadcom rose — the AI trade changed hands, it didn't breakNvidia closed Wednesday at 173.73, up 2.87%, then fell as much as 8.1% to 159.44 after reports that its board was preparing for a possible leadership change. The same session, the Philadelphia Semiconductor Index rose 5.7% with all 30 components higher, CoreWeave jumped 24.7% on 168% revenue growth, and Micron added 11.9%. If AI demand were being repriced, AMD and Broadcom would not be bid. This is a governance discount on one name, and 204.54 — the 200-day average — is the level that settles it.
Author  Irene Q.
Nov 12, Thu
Nvidia closed Wednesday at 173.73, up 2.87%, then fell as much as 8.1% to 159.44 after reports that its board was preparing for a possible leadership change. The same session, the Philadelphia Semiconductor Index rose 5.7% with all 30 components higher, CoreWeave jumped 24.7% on 168% revenue growth, and Micron added 11.9%. If AI demand were being repriced, AMD and Broadcom would not be bid. This is a governance discount on one name, and 204.54 — the 200-day average — is the level that settles it.
placeholder
Gold hit a one-year low while central banks bought 321 tonnes — the sellers were never the ones you thinkSpot gold closed at 3,876 on Thursday, down 2.8% and its lowest close in more than a year, with an intraday low near 3,852. The dollar is at a 19-month high of 103.21 and the 10-year yield is at 5.10%, so the price move is easy to explain. What is harder to explain is who sold: central banks bought 321 tonnes in Q3, the PBoC added for a 24th straight month, ETF holdings are near a record 4,256 tonnes, and roughly 95% of the futures selling came from non-reportable and sovereign-type accounts rather than hedge funds. This piece separates the two books that have to balance.
Author  Irene Q.
Nov 13, Fri
Spot gold closed at 3,876 on Thursday, down 2.8% and its lowest close in more than a year, with an intraday low near 3,852. The dollar is at a 19-month high of 103.21 and the 10-year yield is at 5.10%, so the price move is easy to explain. What is harder to explain is who sold: central banks bought 321 tonnes in Q3, the PBoC added for a 24th straight month, ETF holdings are near a record 4,256 tonnes, and roughly 95% of the futures selling came from non-reportable and sovereign-type accounts rather than hedge funds. This piece separates the two books that have to balance.
placeholder
Brent rose 3.3% and US crude stocks built 4.66 million barrels in the same weekBrent January settled at 95.82, up 3.3%, and WTI at 88.74, up 2.55%, after the US signalled it would not pursue a deal with Iran and attacks on Gulf shipping continued. In the same week, EIA data showed US crude inventories rising 4.657 million barrels against expectations of a 1.1 million draw, with gasoline up another 1.799 million. OPEC output also rebounded 1.96 million barrels a day to 27.16 million in October, led by Saudi Arabia at 10.56 million. This piece separates the geopolitical premium from the physical balance and lays out where each side of the trade is anchored.
Author  Irene Q.
Nov 13, Fri
Brent January settled at 95.82, up 3.3%, and WTI at 88.74, up 2.55%, after the US signalled it would not pursue a deal with Iran and attacks on Gulf shipping continued. In the same week, EIA data showed US crude inventories rising 4.657 million barrels against expectations of a 1.1 million draw, with gasoline up another 1.799 million. OPEC output also rebounded 1.96 million barrels a day to 27.16 million in October, led by Saudi Arabia at 10.56 million. This piece separates the geopolitical premium from the physical balance and lays out where each side of the trade is anchored.
Related Instrument
goTop
quote