

USD/CAD Price Forecast: Likely revisit five-month high at around 1.4250

Source Fxstreet
  • USD/CAD rises to near 1.4190 as the US Dollar trades higher.
  • The Fed is expected to deliver two more interest rate hikes this year.
  • Investors await Canadian GDP data for July and the US JOLTS Job Openings data for August.

The US Dollar (USD) is up 0.12% at around 1.4190 against the US Dollar (USD) during the European trading session on Tuesday. The Loonie pair trades higher as the US Dollar outperforms, with financial markets becoming increasingly confident that the Federal Reserve (Fed) will deliver two more interest rate hikes this year.

US Dollar Price Today

The table below shows the percentage change of US Dollar (USD) against listed major currencies today. US Dollar was the strongest against the Australian Dollar.

USD EUR GBP JPY CAD AUD NZD CHF
USD 0.18% 0.14% -0.02% 0.09% 0.40% 0.25% 0.16%
EUR -0.18% -0.05% -0.20% -0.11% 0.22% 0.06% -0.03%
GBP -0.14% 0.05% -0.17% -0.03% 0.25% 0.11% 0.01%
JPY 0.02% 0.20% 0.17% 0.11% 0.40% 0.24% 0.15%
CAD -0.09% 0.11% 0.03% -0.11% 0.29% 0.14% 0.06%
AUD -0.40% -0.22% -0.25% -0.40% -0.29% -0.15% -0.24%
NZD -0.25% -0.06% -0.11% -0.24% -0.14% 0.15% -0.08%
CHF -0.16% 0.03% -0.01% -0.15% -0.06% 0.24% 0.08%

The heat map shows percentage changes of major currencies against each other. The base currency is picked from the left column, while the quote currency is picked from the top row. For example, if you pick the US Dollar from the left column and move along the horizontal line to the Japanese Yen, the percentage change displayed in the box will represent USD (base)/JPY (quote).

As of writing, the US Dollar Index (DXY), which gauges the Greenback’s value against six major currencies, trades 0.16% higher to near 101.35.

The CME FedWatch tool also shows a 60% probability of the Fed delivering a quarter-to-a-percent interest rate hike in both policy meetings remaining this year.

Later in the day, investors will focus on the Canadian monthly Grioss Domestic Product (GDP) data for July and the United States (US) JOLTS Job Openings data for August.

Economists expect the Canadian economy to have remained flat after expanding 0.3% in June.

The US Job Openings report will likely show that US employers posted 7.23 million fresh jobs, marginally lower than 7.271 million in July.

USD/CAD Technical Analysis
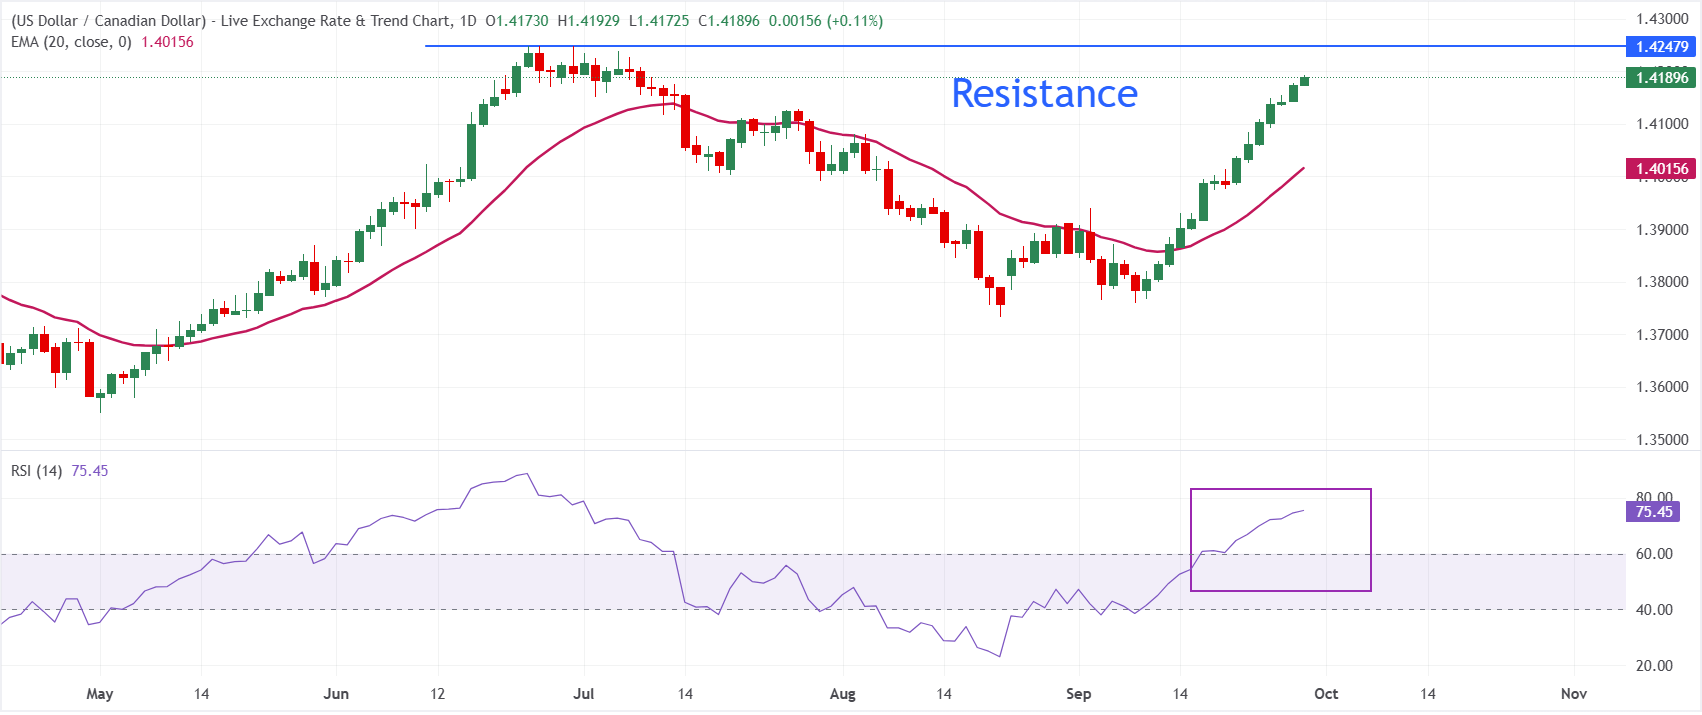
In the daily chart, USD/CAD trades at 1.4190, extending its advance well above the 20-period exponential moving average (EMA) at 1.4016 and reinforcing a bullish near-term bias. The pair has pushed into overbought territory, with the 14-period Relative Strength Index (RSI) at 75.45, which suggests that while buyers remain in control, the risk of a corrective pullback is rising as the latest leg higher stretches away from its dynamic support.

On the downside, immediate support is located at the 20-period EMA around 1.4020, where a deeper retracement could find underlying demand and preserve the broader positive structure as long as price holds above this level. With no clearly defined resistance levels in the current dataset, any further topside extension would be driven by momentum, though the elevated RSI hints that fresh gains from here could be more gradual and vulnerable to short-term consolidation phases.

(The technical analysis of this story was written with the help of an AI tool. Know more.)

Economic Indicator

Gross Domestic Product (MoM)

The Gross Domestic Product (GDP), released by Statistics Canada on a monthly and quarterly basis, is a measure of the total value of all goods and services produced in Canada during a given period. The GDP is considered as the main measure of Canadian economic activity. The MoM reading compares economic activity in the reference month to the previous month. Generally, a high reading is seen as bullish for the Canadian Dollar (CAD), while a low reading is seen as bearish.

Read more.

Next release: Tue Sep 29, 2026 12:30

Frequency: Monthly

Consensus: 0%

Previous: 0.3%

Source:

Disclaimer: For information purposes only. Past performance is not indicative of future results.
placeholder
【Daily Brief】10-year Treasury yield briefly tops 5%, S&P 500 slips to 7,602 and the dollar firms at 99.3 as the Fed's decision eve beginsThe 10-year Treasury yield touched 5.014% on Monday — its first print above 5% since October 2023 — while the S&P 500 closed 0.48% lower at 7,619.98 and the dollar index firmed to 99.3. Here is the full market wrap ahead of Wednesday's FOMC decision, the dot plot and the August retail sales report, plus today's CLARITY Act Senate vote.
Author  Irene Q.
Sep 15, Tue
The 10-year Treasury yield touched 5.014% on Monday — its first print above 5% since October 2023 — while the S&P 500 closed 0.48% lower at 7,619.98 and the dollar index firmed to 99.3. Here is the full market wrap ahead of Wednesday's FOMC decision, the dot plot and the August retail sales report, plus today's CLARITY Act Senate vote.
placeholder
October hike odds climb toward 60% as Goldman and BofA both flip — what Warsh's "dose of accommodation" really changedRate futures now price roughly 55% to 62% for a 25bp hike at the October 27-28 FOMC, up from about 30% before Chair Warsh's post-meeting framing that the Fed is merely "removing some accommodation." Goldman Sachs has added an October hike to its forecast and Bank of America now sees moves in both October and December. Here is the repricing, the language behind it, and the two data points that decide it.
Author  Irene Q.
Sep 23, Wed
Rate futures now price roughly 55% to 62% for a 25bp hike at the October 27-28 FOMC, up from about 30% before Chair Warsh's post-meeting framing that the Fed is merely "removing some accommodation." Goldman Sachs has added an October hike to its forecast and Bank of America now sees moves in both October and December. Here is the repricing, the language behind it, and the two data points that decide it.
placeholder
Four jobs reports in five days: what JOLTS, ADP, claims and the September payrolls mean for the October Fed decisionThe US labour market faces its densest data week of the month. JOLTS job openings land Tuesday (7.2 million expected), ADP on Wednesday (70,000 expected), initial claims on Thursday and the September non-farm payrolls on Friday (100,000 expected, down from 162,000). Markets price a 64%-70% chance of another quarter-point Fed hike on October 28. The dollar index sits at 100.77 and the S&P 500 at 7,729.8.
Author  Mitrade
Sep 28, Mon
The US labour market faces its densest data week of the month. JOLTS job openings land Tuesday (7.2 million expected), ADP on Wednesday (70,000 expected), initial claims on Thursday and the September non-farm payrolls on Friday (100,000 expected, down from 162,000). Markets price a 64%-70% chance of another quarter-point Fed hike on October 28. The dollar index sits at 100.77 and the S&P 500 at 7,729.8.
placeholder
Nvidia's $150 billion buyback landed — and the AI sector fell anyway. That's the signal worth tradingNvidia closed up 1.68% at $228.86 on 28 September after announcing a $150 billion share repurchase authorisation, the largest single corporate buyback on record, while the rest of the AI complex sold off: AMD -3.6%, Micron -2.6%, Meta -4.8% and the Philadelphia Semiconductor Index -1.61%. The divergence is not noise. Capital is rotating toward cash-flow certainty, not abandoning the AI theme. With Micron reporting after the close on 30 September, here is what the split means.
Author  Irene Q.
17 hours ago
Nvidia closed up 1.68% at $228.86 on 28 September after announcing a $150 billion share repurchase authorisation, the largest single corporate buyback on record, while the rest of the AI complex sold off: AMD -3.6%, Micron -2.6%, Meta -4.8% and the Philadelphia Semiconductor Index -1.61%. The divergence is not noise. Capital is rotating toward cash-flow certainty, not abandoning the AI theme. With Micron reporting after the close on 30 September, here is what the split means.
placeholder
The 30-year Treasury just hit a 22-year high — and the bond market is not pricing the Fed, it is pricing the deficitThe 30-year Treasury yield closed at 5.56% on 28 September, the highest since June 2004, while the 10-year reached 5.24% and the 20-year 5.60%. The curve has steepened roughly 30bp in eight sessions even as October hike odds sit at 70.3%. That gap is the story: the long end is repricing fiscal and inflation risk, not policy. With PCE on Wednesday and payrolls on Friday, here is what the long end is really saying.
Author  Irene Q.
17 hours ago
The 30-year Treasury yield closed at 5.56% on 28 September, the highest since June 2004, while the 10-year reached 5.24% and the 20-year 5.60%. The curve has steepened roughly 30bp in eight sessions even as October hike odds sit at 70.3%. That gap is the story: the long end is repricing fiscal and inflation risk, not policy. With PCE on Wednesday and payrolls on Friday, here is what the long end is really saying.
Related Instrument
goTop
quote