


Silver Price Forecast: XAG/USD falls like house of cards on Fed’s hawkish narrative


Silver price dives over 4% to near $61 due to elevated US Treasury Yields.
The Fed is highly anticipated to hike interest rates again this year.
This week, the US NFP data will be the key trigger for global markets.
Silver price (XAG/USD) is down 4.3% to near $61.50 during the European trading session on Monday. The white metal nosedives as elevated United States (US) Treasury Yields have diminished its appeal.
At press time, 10-year US Treasury Yields are close to its 19-year high of 5.23% posted on Friday.
Higher oil prices due to persistent disruption in the global energy supply amid Middle East conflicts and the increased possibility of more interest rate hikes by the Federal Reserve (Fed) in the near term have prompted US Treasury Yields.
US data resilience lifts Yields as Fed tightening narrative builds
Analysts at Deutsche Bank highlight that, alongside recent energy moves, “another factor lifting bond yields yesterday was the ongoing resilience in the economic data.” They point to US weekly initial jobless claims, which came in at “just 197k in the week ending September 19 (vs. 200k expected),” underscoring the strength of the labour market. Deutsche Bank notes that this release is “one of the timeliest indicators we get on the state of the labour market,” and that it has pushed “the 4-week moving average (which Fed Chair Warsh has previously cited) down to 202.25k.” In their view, these developments “played into the current narrative that the US economy is growing strongly, which in turn would give the Fed the space to keep hiking rates.”
Currently, the CME FedWatch tool shows an almost 68% chance that the Fed will hike interest rates again in the October policy meeting.
Next trigger is US NFP
This week, the strength of hawkish Fed expectations will be tested by the US Nonfarm Payrolls (NFP) data for September, which will be released on Friday. The US NFP report will likely show that the economy created 100K fresh jobs, lower than 162K in August.
Silver Technical Analysis
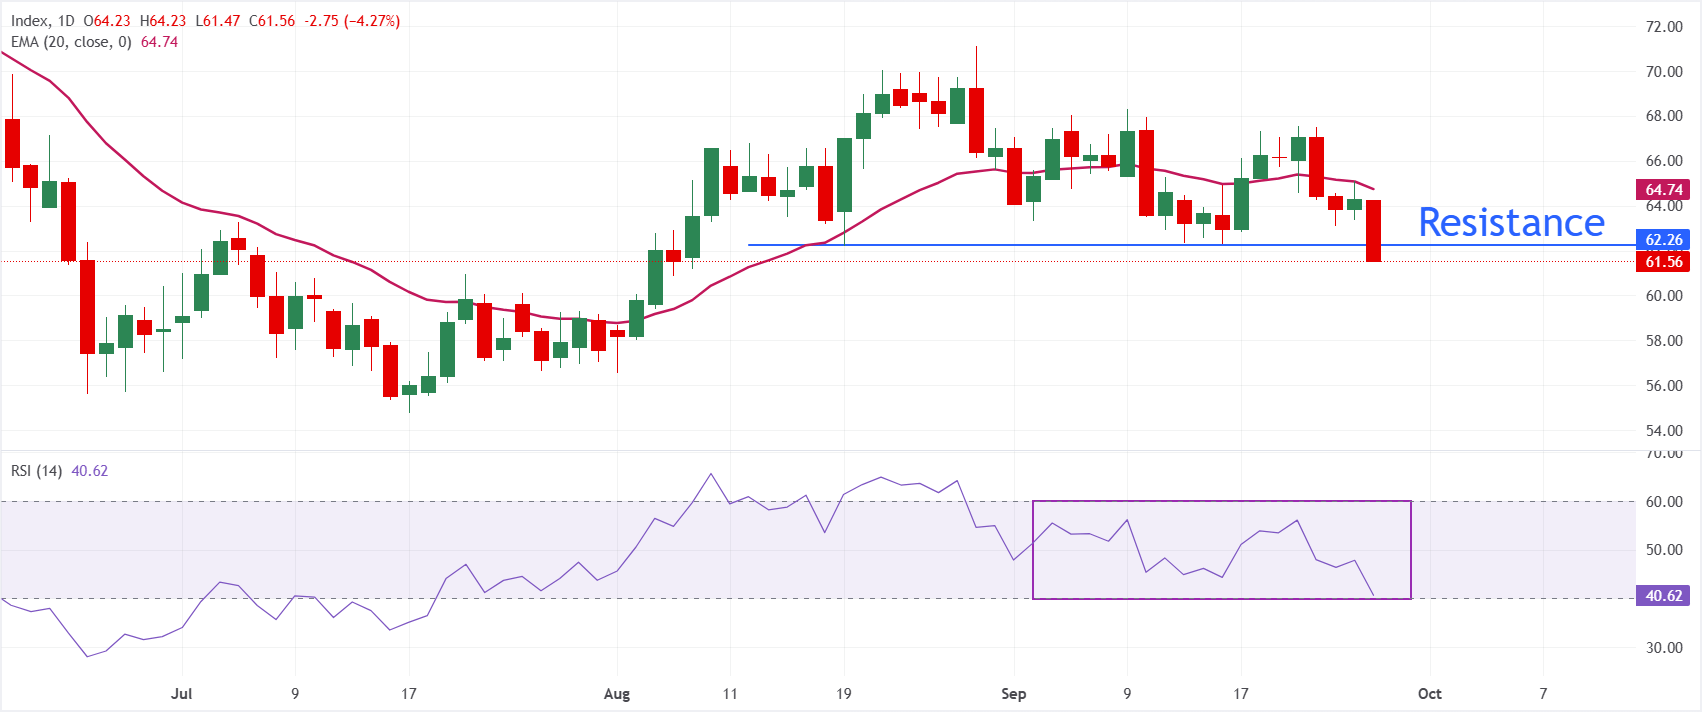
In the daily chart, XAG/USD trades at $61.50, keeping a bearish near-term bias as it holds below the 20-day exponential moving average (EMA) at $64.74. The pair has retreated from recent highs and remains capped by this short-term trend indicator, while the Relative Strength Index (RSI) at 40.61 stays below the neutral 50 line, hinting at lingering downside pressure rather than an oversold extreme.
On the topside, immediate resistance is located at $62.26, followed by the 20-day EMA at $64.74, and a daily close above this barrier would be needed to ease the current bearish tone. On the downside, the white metal could extend its decline towards $60.00
(The technical analysis of this story was written with the help of an AI tool. Know more.)
Read more
* The content presented above, whether from a third party or not, is considered as general advice only. This article should not be construed as containing investment advice, investment recommendations, an offer of or solicitation for any transactions in financial instruments.


