

Dogecoin Price Forecast: DOGE tests key 200-day EMA support as bulls seek recovery

Source Fxstreet
  • Dogecoin trades near the 200-day EMA at $0.092 on Tuesday; holding support could fuel a recovery.
  • US-listed spot ETF recorded an inflow of $2.89 million last week, marking the second consecutive week of positive flows.
  • Mixed derivatives and mild whale accumulations offer limited support for DOGE.

Dogecoin (DOGE) tests a key support level near $0.092 on Tuesday, with bulls looking to prevent a deeper correction. Meanwhile, continued inflows into meme-coin spot Exchange-Traded Funds (ETFs) and whale accumulation on price dips provide some support, but mixed derivatives positioning suggests bullish momentum remains cautious.

Institutional demand holds strong

SoSoValue data showed spot ETFs recorded a $2.89 million inflow last week, marking the second straight week of inflows and indicating robust institutional demand. However, Monday’s flow remained muted; if this inflow trend continues, stays positive and intensifies through the week, DOGE could extend gains.
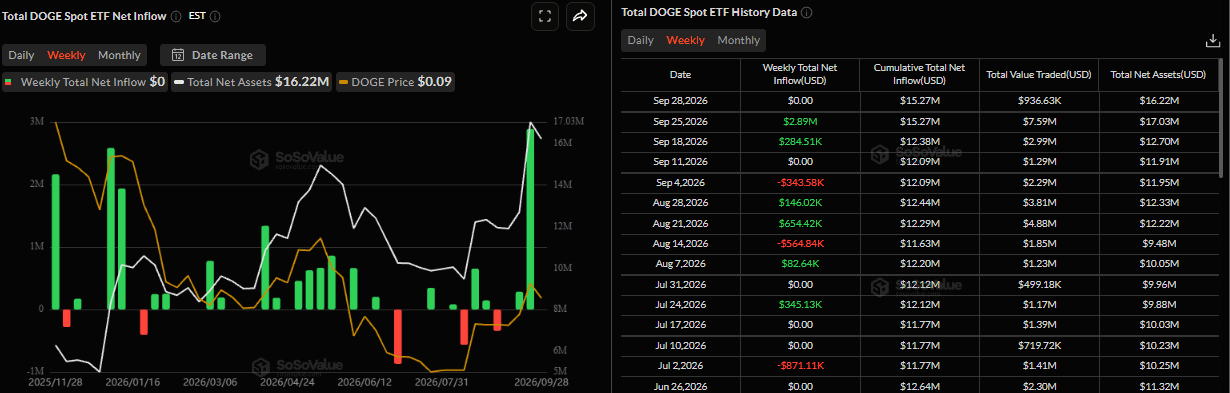
Total DOGE spot ETF net inflow weekly chart. Source: SoSovalue

Derivatives traders show mixed outlook

Derivatives data shows a mixed and cautious outlook among dog-themed meme coin traders. CoinGlass’ long-to-short ratio for DOGE reads 0.81 on Tuesday, nearing the lowest level over a month. A ratio below one indicates bearish sentiment, as traders bet that asset prices will fall.
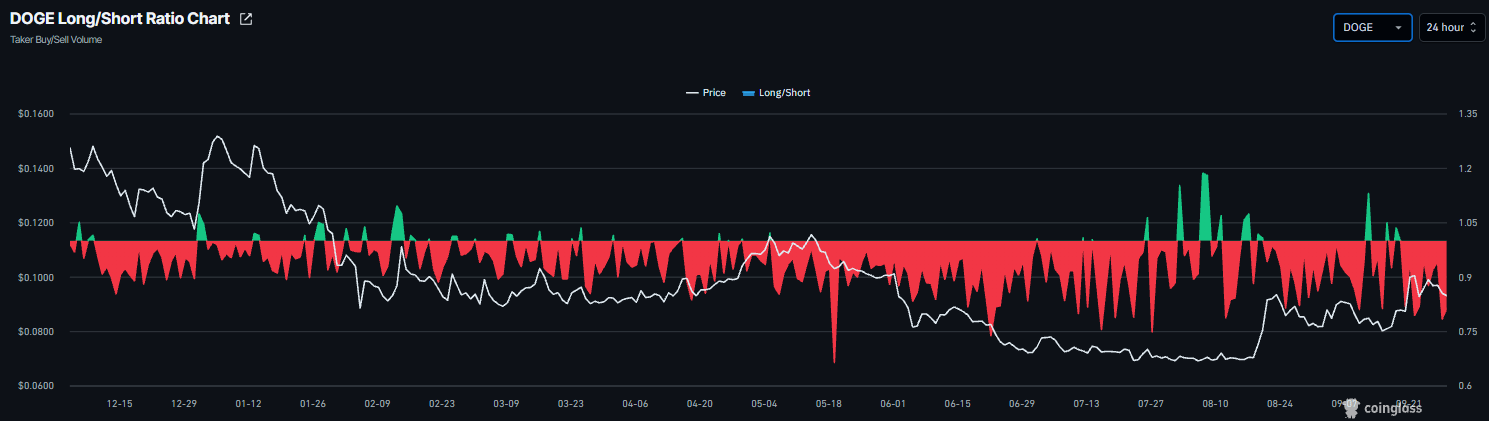
Dogecoin long-to-short ratio chart. Source: Coinglass

Meanwhile, Dogecoin’s funding rate flipped positive on September 10 and rose to 0.0054% on Tuesday. This indicates longs are paying shorts, reflecting a bullish outlook for Dogecoin.

This divergence suggests mixed sentiment among derivatives traders, with no clear directional conviction.
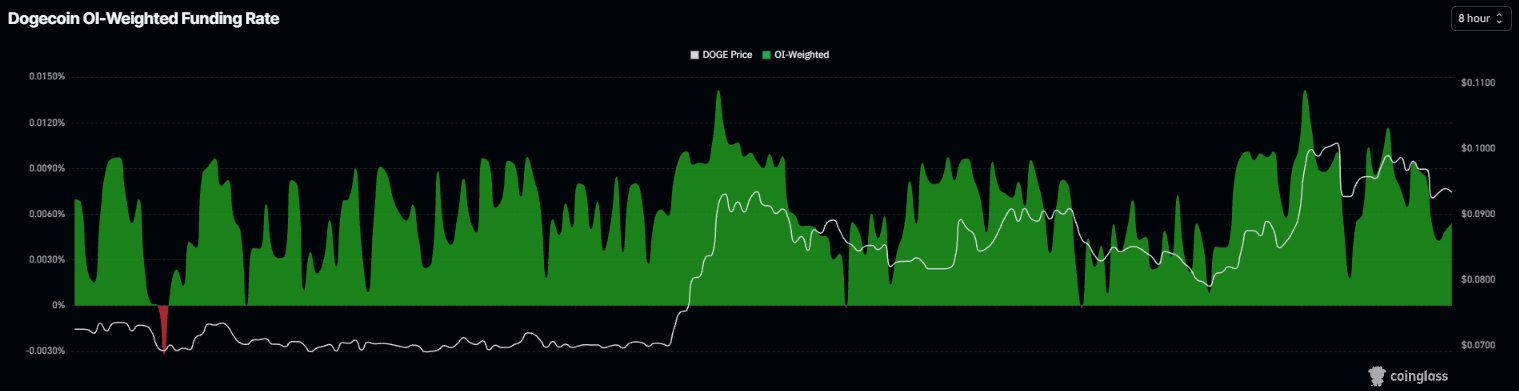
Dogecoin funding rates chart. Source: Coinglass

Whales buying dips

Santiment’s Supply Distribution data shows that large-wallet holders (whales) are steadily buying Dogecoin amid its recent price dips.

The metric indicates that whales holding between 100,000 and 1 million (red line), 1 million and 10 million DOGE tokens (yellow line), and 10 million and 100 million DOGE tokens (blue line) have accumulated a total of 50 million DOGE tokens since Sunday. This buy-the-dip scenario signals continued long-term interest among wallet holders and supports the ongoing price rally.

DOGE supply distribution chart. Source: Santiment

Dogecoin technical outlook: Nears key 200-day EMA

Dogecoin price trades at $0.093 on Tuesday, holding above a dense layer of moving average support and former trend resistance, which sets a mildly bullish near‑term bias. The 200-day exponential moving average (EMA) at $0.092 sits just below spot as immediate dynamic support, while the 50-day and 100-day EMAs around $0.086 and $0.085 reinforce the broader constructive tone. 

DOGE  also trades above the prior downward resistance trendline, whose latest interaction near $0.091 now acts as additional underlying support. Momentum stays positive but not stretched, with the Relative Strength Index (RSI) hovering around 55 and the Moving Average Convergence Divergence (MACD) indicator holding slightly in positive territory, hinting that buyers retain control without clear signs of overextension.

On the downside, initial support is seen at the 200‑day EMA near $0.092, followed by the reclaimed trendline zone around $0.091 and the horizontal shelf at $0.088. Below these, the 50‑day and 100‑day EMAs at $0.086 and $0.085, along with the deeper horizontal level at $0.070, mark subsequent demand layers should a broader pullback unfold.

On the topside, the first notable resistance is the horizontal barrier around $0.102; a daily close above would likely pave the way for a continuation of the advance and expose higher levels on the medium‑term horizon.
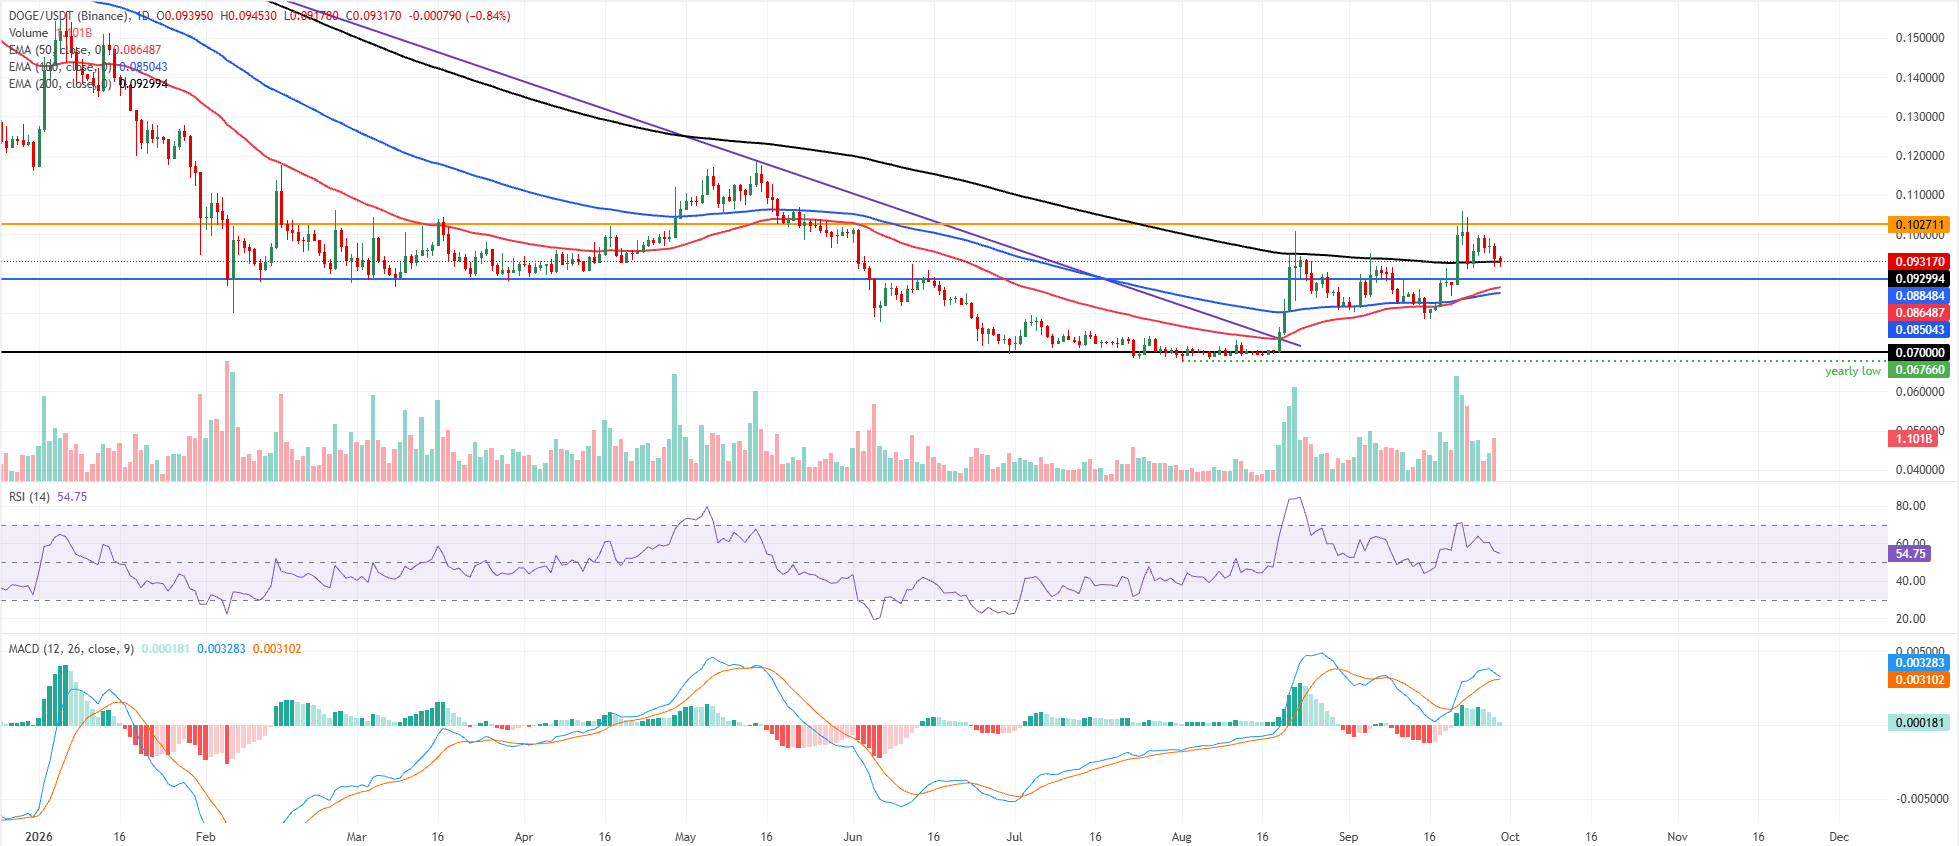
DOGE/USDT daily chart

(The technical analysis of this story was written with the help of an AI tool. Know more.)

Disclaimer: For information purposes only. Past performance is not indicative of future results.
placeholder
【Daily Brief】10-year Treasury yield briefly tops 5%, S&P 500 slips to 7,602 and the dollar firms at 99.3 as the Fed's decision eve beginsThe 10-year Treasury yield touched 5.014% on Monday — its first print above 5% since October 2023 — while the S&P 500 closed 0.48% lower at 7,619.98 and the dollar index firmed to 99.3. Here is the full market wrap ahead of Wednesday's FOMC decision, the dot plot and the August retail sales report, plus today's CLARITY Act Senate vote.
Author  Irene Q.
Sep 15, Tue
The 10-year Treasury yield touched 5.014% on Monday — its first print above 5% since October 2023 — while the S&P 500 closed 0.48% lower at 7,619.98 and the dollar index firmed to 99.3. Here is the full market wrap ahead of Wednesday's FOMC decision, the dot plot and the August retail sales report, plus today's CLARITY Act Senate vote.
placeholder
October hike odds climb toward 60% as Goldman and BofA both flip — what Warsh's "dose of accommodation" really changedRate futures now price roughly 55% to 62% for a 25bp hike at the October 27-28 FOMC, up from about 30% before Chair Warsh's post-meeting framing that the Fed is merely "removing some accommodation." Goldman Sachs has added an October hike to its forecast and Bank of America now sees moves in both October and December. Here is the repricing, the language behind it, and the two data points that decide it.
Author  Irene Q.
Sep 23, Wed
Rate futures now price roughly 55% to 62% for a 25bp hike at the October 27-28 FOMC, up from about 30% before Chair Warsh's post-meeting framing that the Fed is merely "removing some accommodation." Goldman Sachs has added an October hike to its forecast and Bank of America now sees moves in both October and December. Here is the repricing, the language behind it, and the two data points that decide it.
placeholder
Four jobs reports in five days: what JOLTS, ADP, claims and the September payrolls mean for the October Fed decisionThe US labour market faces its densest data week of the month. JOLTS job openings land Tuesday (7.2 million expected), ADP on Wednesday (70,000 expected), initial claims on Thursday and the September non-farm payrolls on Friday (100,000 expected, down from 162,000). Markets price a 64%-70% chance of another quarter-point Fed hike on October 28. The dollar index sits at 100.77 and the S&P 500 at 7,729.8.
Author  Mitrade
Sep 28, Mon
The US labour market faces its densest data week of the month. JOLTS job openings land Tuesday (7.2 million expected), ADP on Wednesday (70,000 expected), initial claims on Thursday and the September non-farm payrolls on Friday (100,000 expected, down from 162,000). Markets price a 64%-70% chance of another quarter-point Fed hike on October 28. The dollar index sits at 100.77 and the S&P 500 at 7,729.8.
placeholder
Nvidia's $150 billion buyback landed — and the AI sector fell anyway. That's the signal worth tradingNvidia closed up 1.68% at $228.86 on 28 September after announcing a $150 billion share repurchase authorisation, the largest single corporate buyback on record, while the rest of the AI complex sold off: AMD -3.6%, Micron -2.6%, Meta -4.8% and the Philadelphia Semiconductor Index -1.61%. The divergence is not noise. Capital is rotating toward cash-flow certainty, not abandoning the AI theme. With Micron reporting after the close on 30 September, here is what the split means.
Author  Irene Q.
19 hours ago
Nvidia closed up 1.68% at $228.86 on 28 September after announcing a $150 billion share repurchase authorisation, the largest single corporate buyback on record, while the rest of the AI complex sold off: AMD -3.6%, Micron -2.6%, Meta -4.8% and the Philadelphia Semiconductor Index -1.61%. The divergence is not noise. Capital is rotating toward cash-flow certainty, not abandoning the AI theme. With Micron reporting after the close on 30 September, here is what the split means.
placeholder
The 30-year Treasury just hit a 22-year high — and the bond market is not pricing the Fed, it is pricing the deficitThe 30-year Treasury yield closed at 5.56% on 28 September, the highest since June 2004, while the 10-year reached 5.24% and the 20-year 5.60%. The curve has steepened roughly 30bp in eight sessions even as October hike odds sit at 70.3%. That gap is the story: the long end is repricing fiscal and inflation risk, not policy. With PCE on Wednesday and payrolls on Friday, here is what the long end is really saying.
Author  Irene Q.
19 hours ago
The 30-year Treasury yield closed at 5.56% on 28 September, the highest since June 2004, while the 10-year reached 5.24% and the 20-year 5.60%. The curve has steepened roughly 30bp in eight sessions even as October hike odds sit at 70.3%. That gap is the story: the long end is repricing fiscal and inflation risk, not policy. With PCE on Wednesday and payrolls on Friday, here is what the long end is really saying.
Related Instrument
goTop
quote