


The 30-year Treasury just hit a 22-year high — and the bond market is not pricing the Fed, it is pricing the deficit


Gold fell about 4% in a single session on 28 September. The S&P 500 logged its worst day since 20 August. Neither happened because of a data release. Both happened because the long end of the Treasury curve broke to levels it has not seen in more than two decades — and that repricing is the single fact that connects everything else on the tape.
1. The move
The US Treasury's official par yield curve for 28 September closed at 5.24% for the 10-year, 5.60% for the 20-year and 5.56% for the 30-year. The 10-year touched 5.274% intraday, the highest since 12 June 2007. The 30-year touched 5.582%, the highest since 14 June 2004 — a 22-year high.
Over the eight sessions from 17 to 28 September, the 10-year added roughly 30 basis points, moving from 4.94% to 5.24%. That is a fast move for a rate that people normally treat as background noise.
One clarification worth making, because it is widely reported incorrectly: this is not an all-time high. The 30-year peaked at 15.21% in October 1981. Several outlets describe the current level as the highest "since 2002" — that is wrong. The yield reached 5.84% on 14 May 2002, above today's level. The correct comparison is 2004.
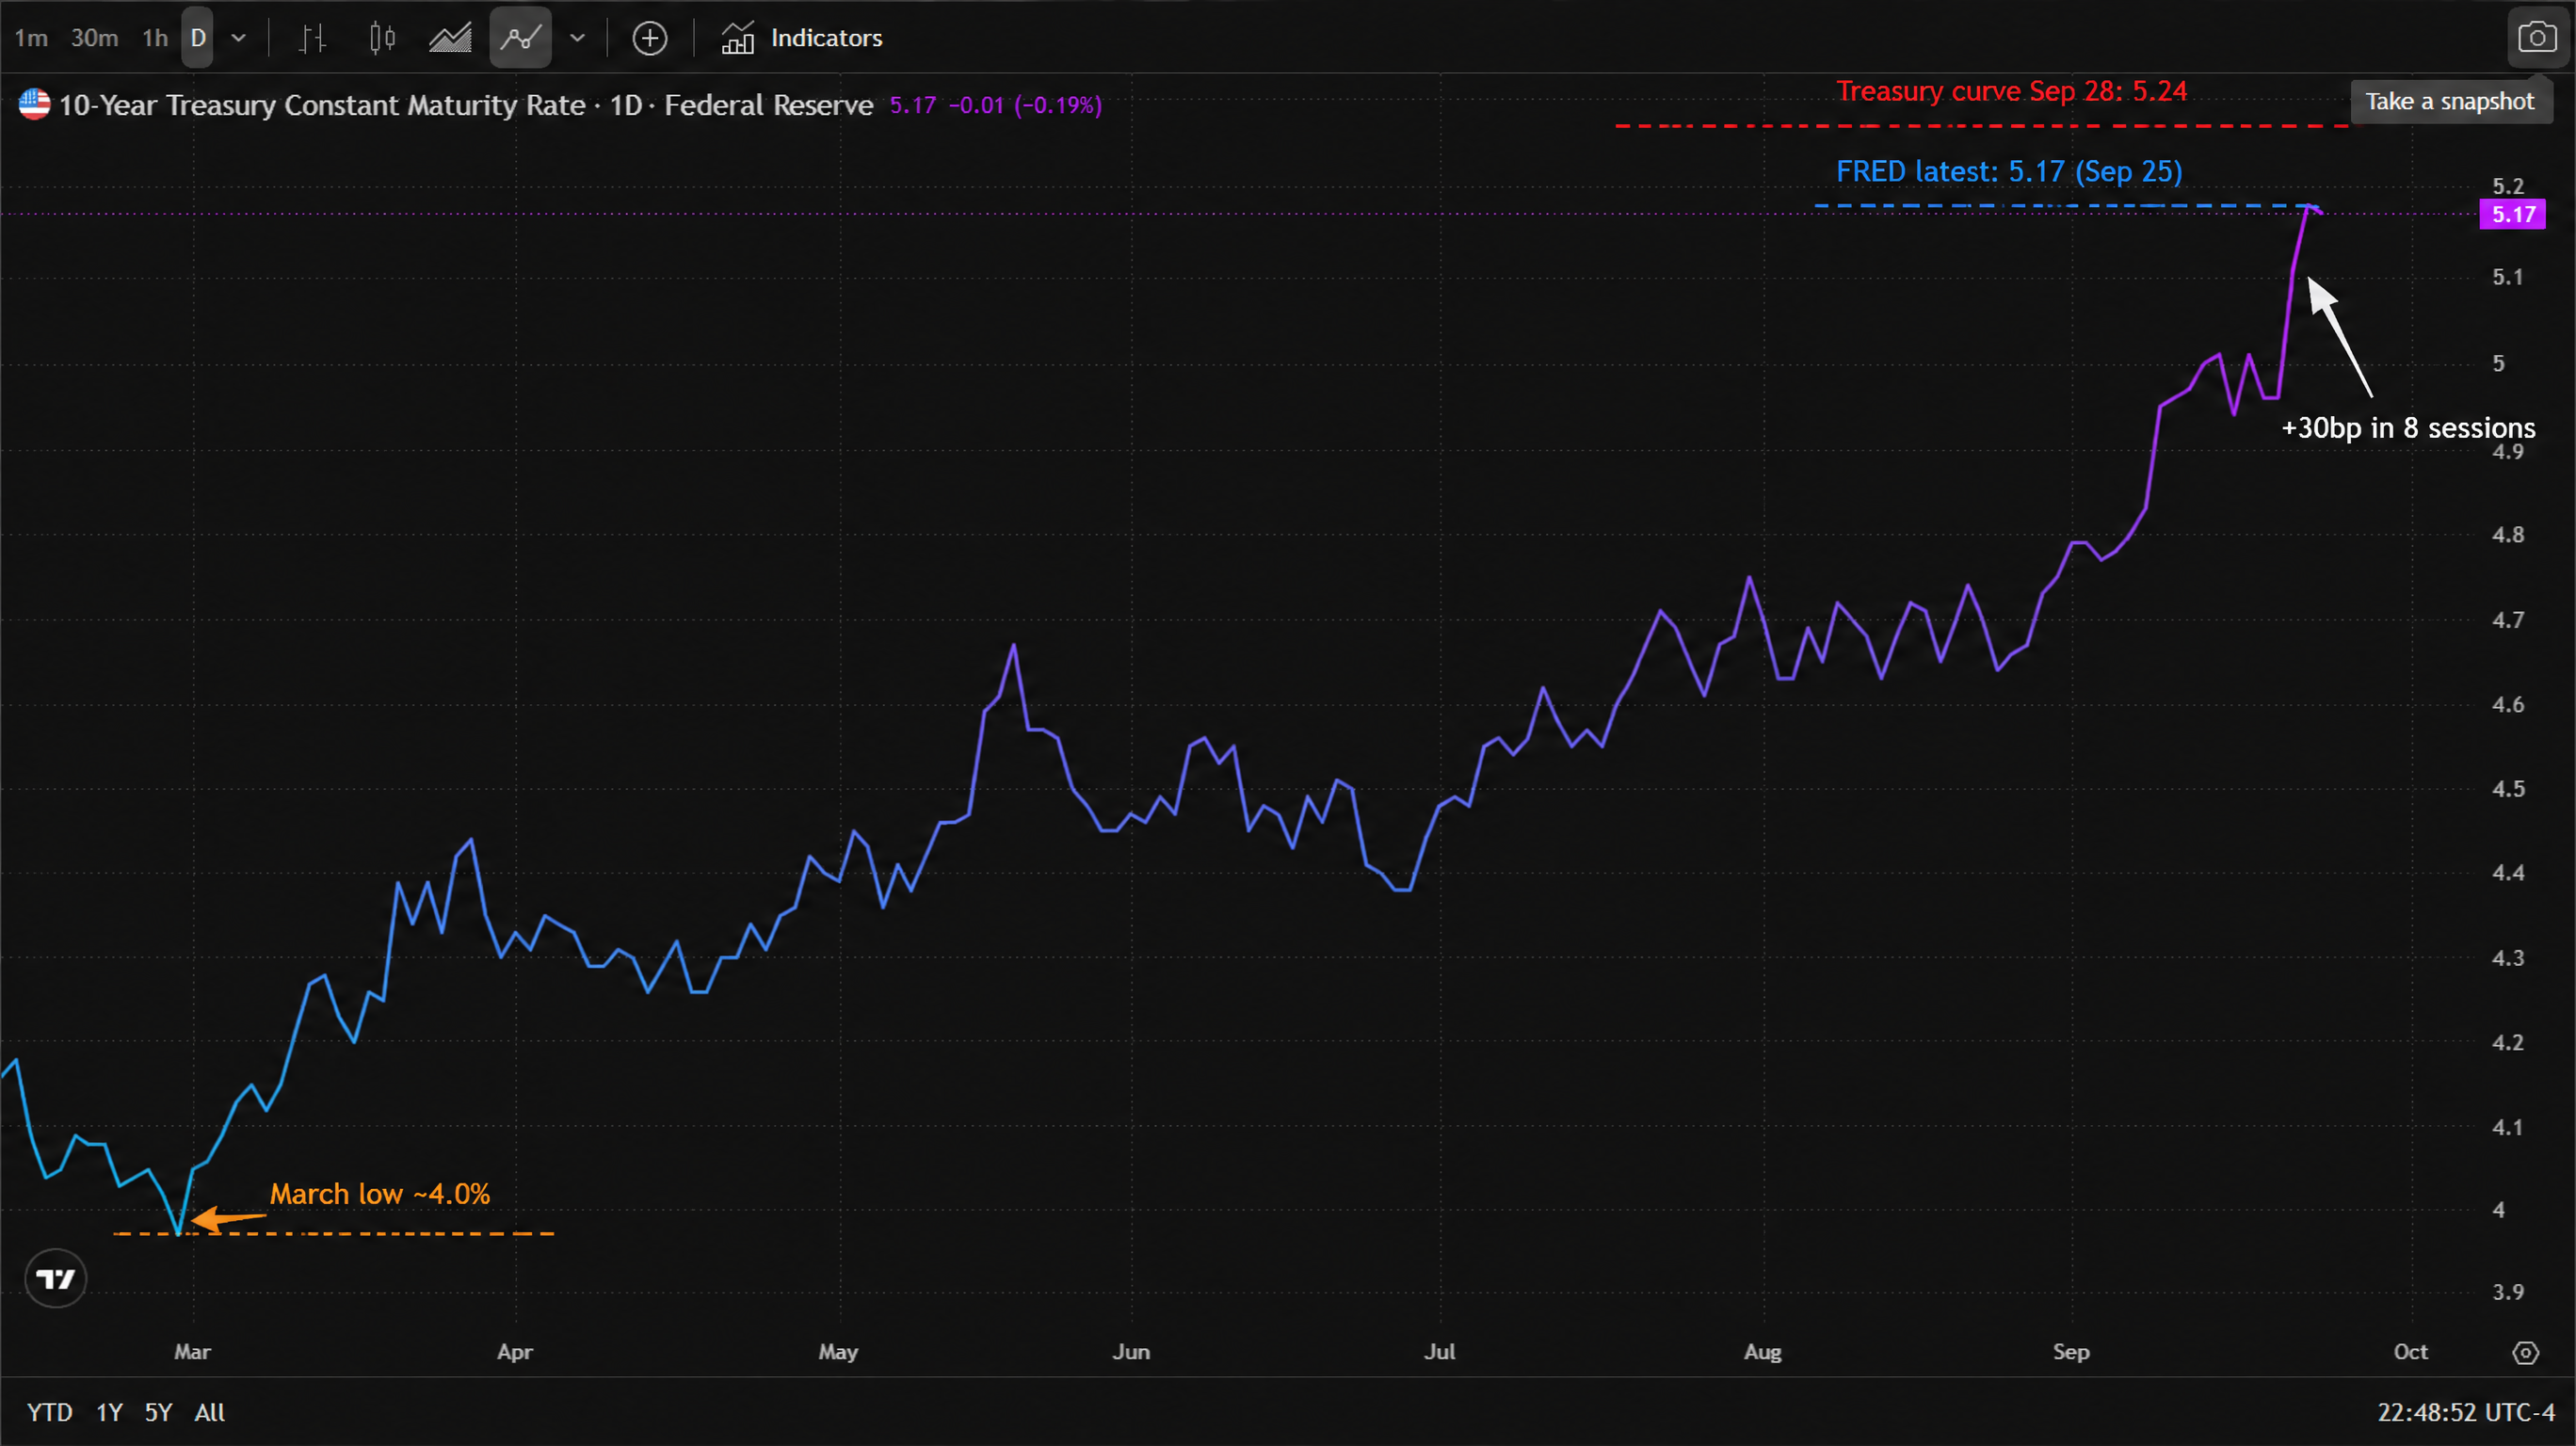
* Chart source: TradingView official chart screenshot, data source FRED (Federal Reserve Economic Data, series DGS10).
A note on data timing. The FRED series above still reads 5.17 because the Federal Reserve had not yet published the 28 September observation when this chart was taken. The 5.24% and 5.56% figures come from the Treasury's own daily par yield curve for 28 September. If you see a source quoting 5.17% as the "current" 10-year yield, it is quoting a two-day-old print.
2. Why the long end is moving — and why it is not the Fed
Here is the part that matters for positioning. The market has repriced October hike odds to 70.3% on CME FedWatch, up from 57.6% a week earlier and 17.7% a month earlier. The Fed hiked 25 basis points on 16 September, taking the federal funds target range to 4.00% — its first hike in three years.
If the long end were simply tracking policy expectations, a 70.3% October odds would have pulled the 2-year up and left the long end roughly where it was. Instead the 2-year rose about 8 basis points to 4.92% while the 30-year rose to 5.56%. The curve bear-steepened.
That divergence is the signal. The bond market is not primarily repricing what the Fed does in October — it is repricing the term premium: the compensation investors demand for holding long-dated sovereign debt, which is a function of deficit trajectory, debt supply, energy-driven inflation and the capital demands of the AI build-out. Reuters attributed the move to exactly that combination: the Iran conflict feeding energy inflation, US debt and deficit expansion, and the AI capital expenditure cycle.
This matters because a term-premium-driven selloff does not reverse when the Fed does what the market expects. If the Fed hikes in October and the long end is still selling off, the market is telling you the problem is fiscal, not cyclical — and the usual "wait for the policy pivot, then buy duration" playbook stops working.
3. What the flows are saying
Two data points frame the positioning.
First, the equity tape moved as one. The S&P 500 fell 0.77% to 7,683.69, its worst single session since 20 August, with decliners outnumbering advancers 3.55 to 1 on the NYSE. Only 4 S&P names made new 52-week highs against 29 new lows. Volume of 16.71 billion shares came in below the 20-day average of 16.85 billion — this was an orderly reduction, not a liquidation.
Second, duration is becoming the hedge of choice. Treated as the cleanest long-duration expression available, exchange-traded long Treasury exposure has seen options activity reach record highs as investors look for a way to hedge the fiscal story rather than the policy one. That is a meaningful change in behaviour: investors are no longer hedging economic weakness, they are hedging the supply of government debt.
4. Levels and technicals
For the 10-year, the 5.274% intraday print on 28 September is now the first line in the sand. A sustained move above it keeps the repricing intact. Below it, the first reference is the 5.00% handle — the level the market breached upward in mid-September, and one that several desks have flagged as the psychological threshold where momentum buyers step in.
For the 20- and 30-year, there is no clean prior structure from this cycle: 5.60% and 5.56% are the highest prints of the past two decades, so technical resistance has to be built from the move itself rather than from history. The 6% level is the round number the selloff is now heading toward, and it is the level at which fiscal arithmetic starts to dominate the conversation entirely.
5. What to watch, and the two scenarios
The next two sessions carry the catalysts. PCE lands Wednesday 30 September — consensus looks for core at roughly 3.3% year on year, with the headline near 3.7%, both above the 2% target. September payrolls follow on Friday 2 October, with consensus around 100,000 against a prior 162,000 and unemployment at 4.1% to 4.2%. JOLTS and ADP print in between, and the Reserve Bank of Australia decides today at 2:30pm Sydney time, with markets pricing a 25 basis point hike to 4.60%.
Scenario A — the long end keeps selling off. If PCE comes in at or above consensus while payrolls are soft, the market gets stagflationary pricing: inflation sticky, growth cooling, and no relief on the long end. Equities de-rate further, gold stays under pressure because the real-yield channel stays open, and the dollar holds its gains. Duration does not hedge this outcome.
Scenario B — the long end stabilises. If payrolls come in materially weaker and PCE cools, the term premium stops widening. The 10-year retraces below 5.00%, the curve stops steepening, and the relief extends well beyond Treasuries — gold recovers as the real-yield channel closes, and rate-sensitive growth equities stabilise. This is the outcome in which the September selloff reads as an overshoot rather than a regime change.
The asymmetry worth naming: in Scenario A the Fed cannot easily rescue long duration, because the problem is the supply of debt rather than the price of policy. In Scenario B the relief is mechanical. That is why the balance of risk into this week's data is not symmetric, and why the 10-year's behaviour around 5.274% and 5.00% is the cleanest read on what the market actually believes.
Read more
Before making any trading decisions, it is important to equip yourself with sufficient fundamental knowledge, have a comprehensive understanding of market trends, be aware of risks and hidden costs, carefully consider investment targets, level of experience, risk appetite, and seek professional advice if necessary.
Furthermore, the content of this article is solely the author's personal opinion and does not necessarily constitute investment advice. The content of this article is for reference purposes only, and readers should not use this article as a basis for any investment decisions.
Investors should not rely on this information as a substitute for independent judgment or make decisions solely based on this information. It does not constitute any trading activity and does not guarantee any profits in trading.
If you have any inquiries regarding the data, information, or content related to Mitrade in this article, please contact us via email: insights@mitrade.com. The Mitrade team will carefully review the content to continue improving the quality of the article.


