Litecoin Price Forecast: LTC breaks above bullish technical pattern, targets $170 mark

Mitrade
coverImg
Source: DepositPhotos
  • Litecoin price breaks out of an ascending channel pattern, signaling potential upside acceleration.

  • Open Interest reaches a record high of $1.27 billion, while hashrate continues to climb, boosting network security.

  • Technical setup supports a rally continuation toward the $170 target level.

Litecoin (LTC) price is showing renewed bullish strength after breaking out of an ascending channel pattern, trading above $133 at the time of writing on Wednesday. This breakout often signals the start of an accelerated uptrend, which is further supported by the rising Open Interest (OI) and a steadily climbing hashrate, targeting a rally toward $170.

Litecoin’s Open Interest hits a record high of $1.27 billion

CoinGlass’ data shows that the futures OI in Litecoin at exchanges rises to a new all-time high of $1.2 billion on Wednesday from $832 million in early August. Rising OI represents new or additional money entering the market and new buying, which could fuel the current LTC price rally.
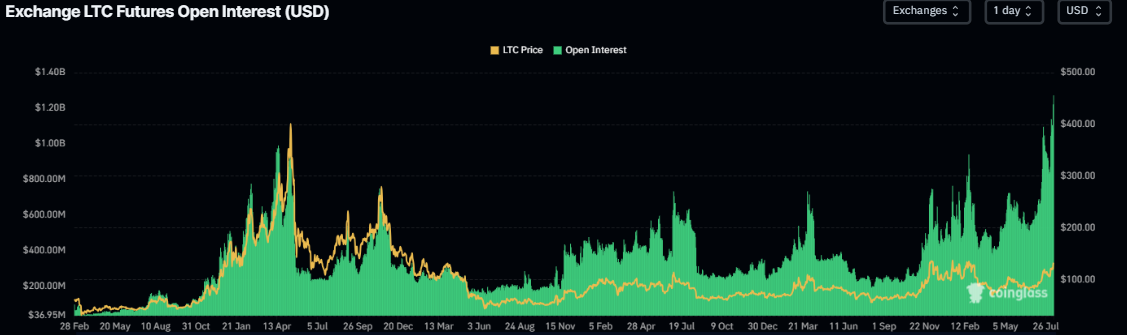
Litecoin Open Interest chart. Source: CoinGlass

Litecoin Open Interest chart. Source: CoinGlass

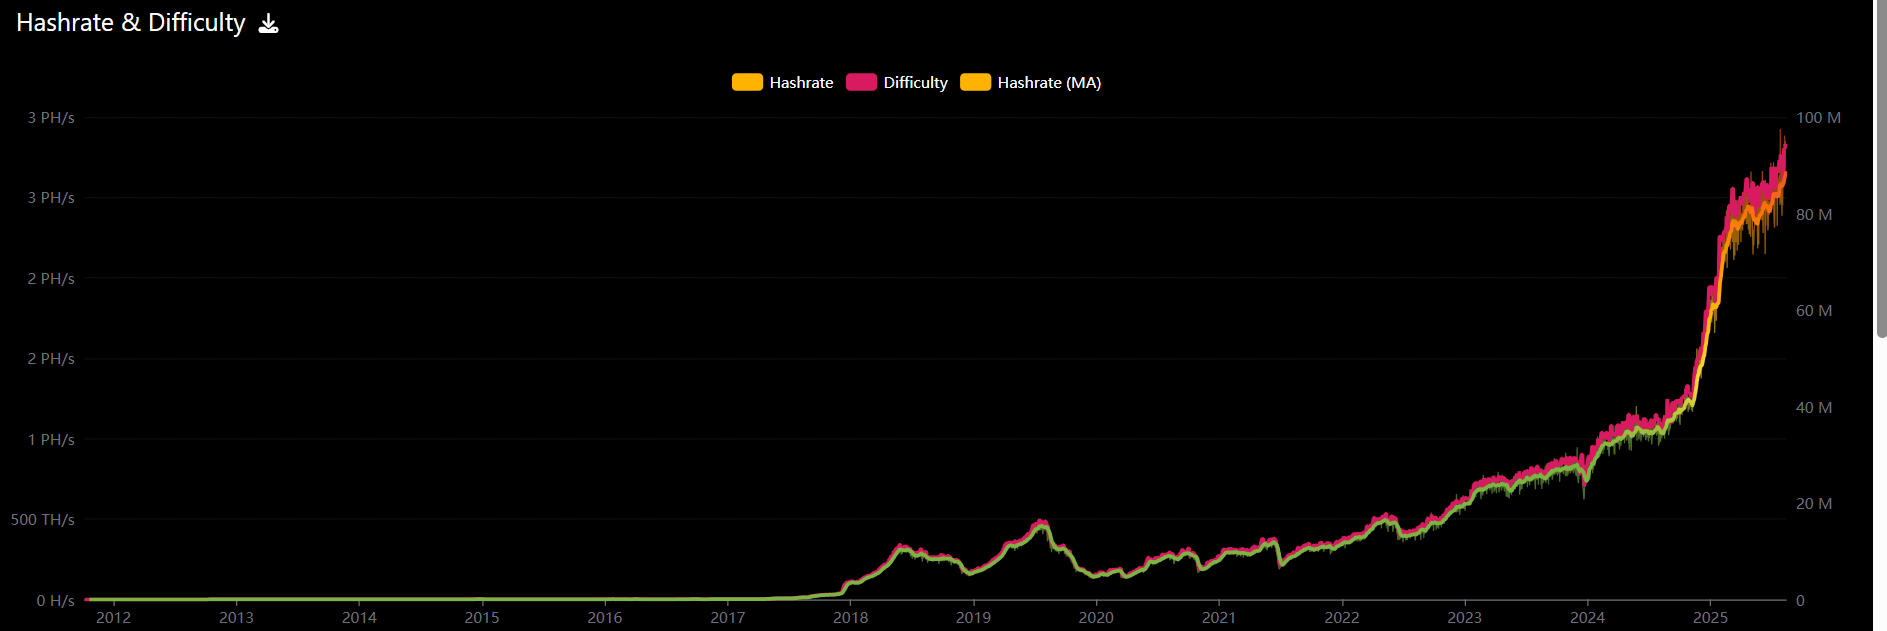
Litecoin’s hashrate has been constantly rising, as shown in the graph below, indicating a significant increase in mining power and network security since its launch, which has boosted investors’ confidence in the LTC network.
Adding to this positive narrative is the rising bullish bets among LTC traders. Coinglass’s long-to-short ratio data for LTC reads 1.08, the highest level over a month.
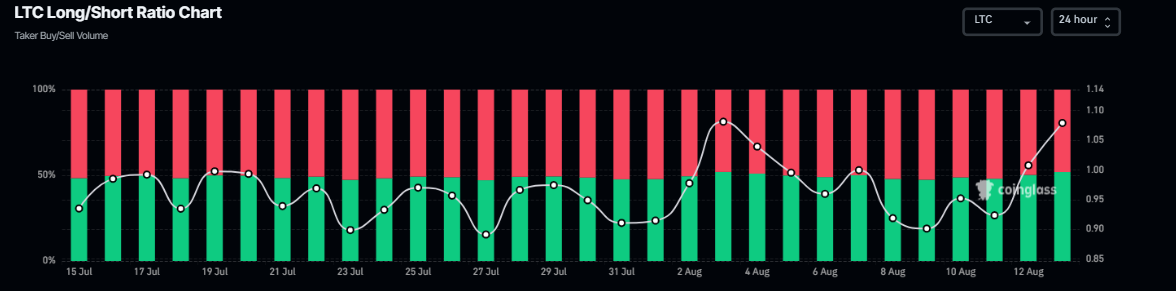
Litecoin long-to-short ratio. Source: CoinGlass

Litecoin long-to-short ratio. Source: CoinGlass

Litecoin Price Forecast: Bulls aiming for $170 mark

Litecoin price closed above the ascending parallel channel pattern (drawn by connecting multiple highs and lows with two trendlines since mid-March) on Tuesday. The breakout of this pattern favors the bulls, with a technical target often projected as the channel’s height from the breakout point. At the time of writing on Wednesday, it continues to trade higher above $133.

If LTC continues its upward trend, it could extend the rally toward its technical target of $170.30. Investors should be cautious of this theoretical move, as any upside move could encounter resistance at the December 5 high at $147.06, where traders could book some profits.

The Relative Strength Index (RSI) on the daily chart read 70, moving upward toward its overbought condition, indicating strong bullish momentum. The MACD showed a bullish crossover on August 5 and also shows rising green histogram bars, further supporting the bullish thesis.
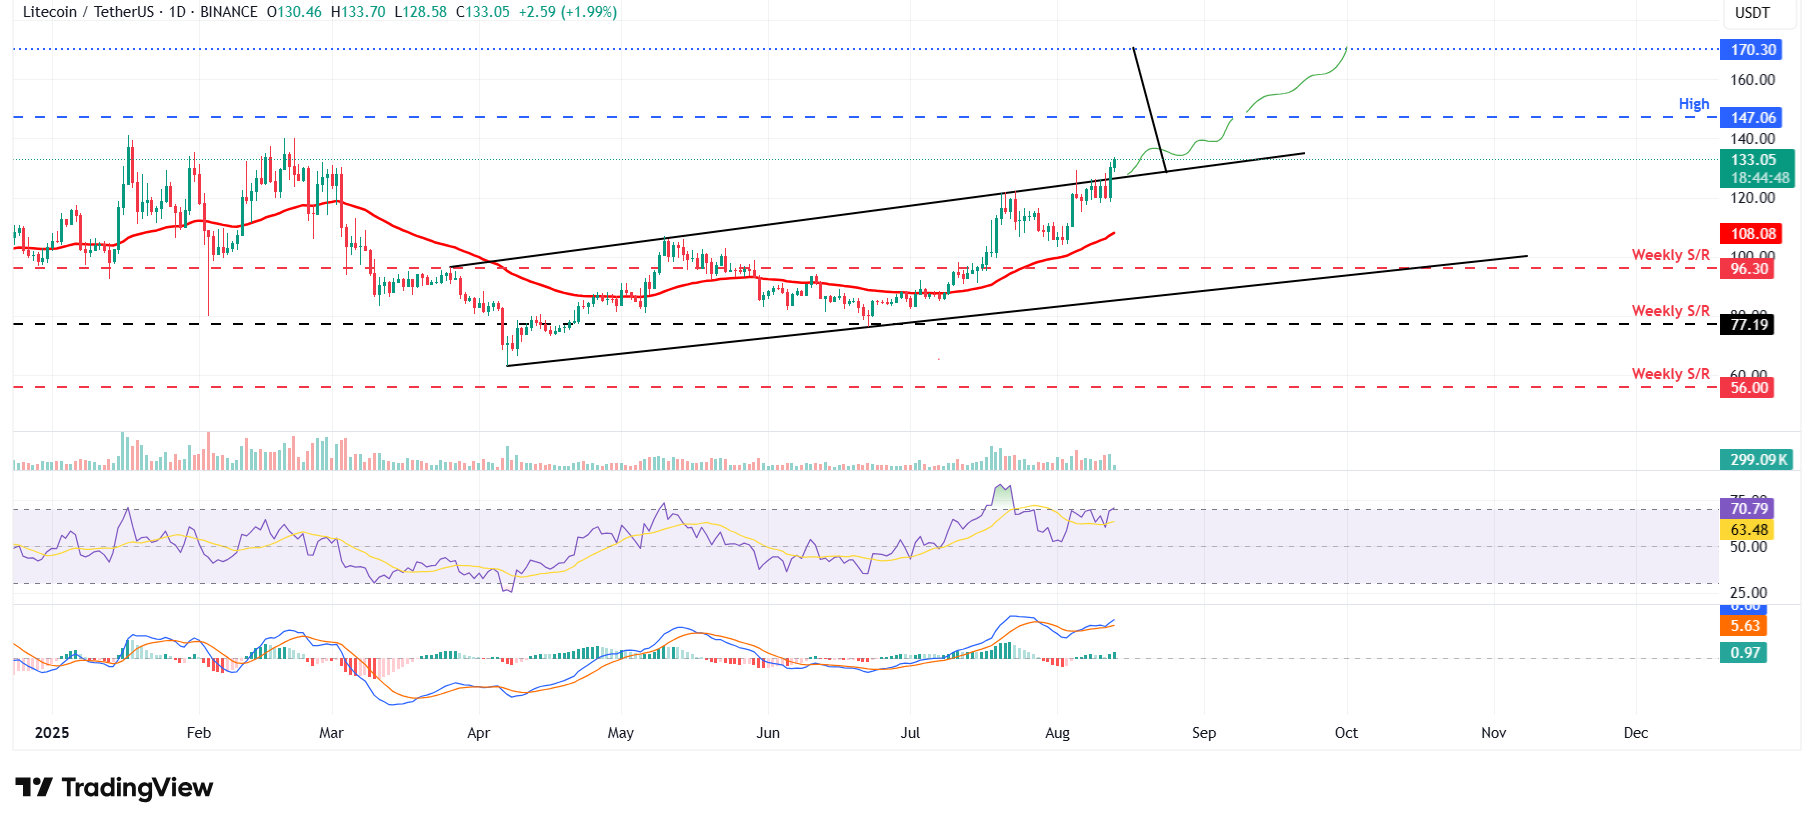
LTC/USDT daily chart 

LTC/USDT daily chart 

However, if LTC faces a correction, it could find support at the upper channel trendline boundary at $125.

Read more

  • Gold Price Forecast: Gold Tumbles Below $3,900 as Trump Says No Need for Iran Deal; Can October PPI Spur a Rebound?
  • Ethereum Drops Below $2,000 After Plunging Over 20% in a Month as Odds of $1,500 Retest Surge
  • Gold hit a one-year low while central banks bought 321 tonnes — the sellers were never the ones you think
  • * The content presented above, whether from a third party or not, is considered as general advice only.  This article should not be construed as containing investment advice, investment recommendations, an offer of or solicitation for any transactions in financial instruments.

    goTop
    quote
    Related Articles
    placeholder
    Ethereum Drops Below $2,000 After Plunging Over 20% in a Month as Odds of $1,500 Retest SurgeEthereum Plunges Over 20% in a Month, Risking a Retest of $1,500 After Losing the $2,000 Defense Line.On November 13, Ethereum (ETH) plunged more than 5%, officially falling below the key
    Author  TradingKey
    Nov 13, Fri
    Ethereum Plunges Over 20% in a Month, Risking a Retest of $1,500 After Losing the $2,000 Defense Line.On November 13, Ethereum (ETH) plunged more than 5%, officially falling below the key
    placeholder
    Bitcoin lost its 200-day average — but the exit started three sessions before the CPIBitcoin fell 2.5% to about $73,400 on 11 November, an 11-week low, breaking its 200-day moving average near $73,100. The 24-hour liquidation tally reached $632 to $705 million, roughly 82% of it longs. But spot ETF outflows began three sessions earlier and USDT's market cap has shrunk $6.6 billion in 60 days — the leveraged length left before the inflation print did. A double top at 81,890 and 81,080 leaves a measured target of 69,366.
    Author  Suzie
    Nov 11, Wed
    Bitcoin fell 2.5% to about $73,400 on 11 November, an 11-week low, breaking its 200-day moving average near $73,100. The 24-hour liquidation tally reached $632 to $705 million, roughly 82% of it longs. But spot ETF outflows began three sessions earlier and USDT's market cap has shrunk $6.6 billion in 60 days — the leveraged length left before the inflation print did. A double top at 81,890 and 81,080 leaves a measured target of 69,366.
    placeholder
    Bitcoin Price Forecast: BTC faces pressure as weekly ETF outflows hit $1.28 billionBitcoin (BTC) remains under pressure on Monday, trading below the 50-week Simple Moving Average (SMA) at $75,222 after extending its losing streak to five consecutive weeks.
    Author  FXStreet
    Nov 09, Mon
    Bitcoin (BTC) remains under pressure on Monday, trading below the 50-week Simple Moving Average (SMA) at $75,222 after extending its losing streak to five consecutive weeks.
    placeholder
    Bitcoin ETFs sold $1.28 billion in a week — and BTC is still above 75,000US spot Bitcoin ETFs logged $1.28 billion of net outflows in the week to Nov 6, the largest since late June, with BlackRock's IBIT accounting for $1.21 billion. Yet BTC only fell from $80,405 to $74,940, a 6.8% move. The gap between the fund flow and the price is the story: leveraged longs were flushed, but spot holders did not follow the ETFs out — and $75,000 is the line that decides whether that reading holds.
    Author  Suzie
    Nov 09, Mon
    US spot Bitcoin ETFs logged $1.28 billion of net outflows in the week to Nov 6, the largest since late June, with BlackRock's IBIT accounting for $1.21 billion. Yet BTC only fell from $80,405 to $74,940, a 6.8% move. The gap between the fund flow and the price is the story: leveraged longs were flushed, but spot holders did not follow the ETFs out — and $75,000 is the line that decides whether that reading holds.
    placeholder
    Binance replaced 95% of a $6.3bn hole — Bitcoin is trading the plumbing, not the coinBinance resumed withdrawals on November 1 after a record $6.3bn theft. In the first 9.5 hours, users withdrew $4.64bn and deposited $1.01bn, a net outflow of $3.64bn, or 2.1% of assets. Bitcoin fell to 76,173 and is now 78,473. The market is pricing the exchange, not the supply.
    Author  Suzie
    Nov 02, Mon
    Binance resumed withdrawals on November 1 after a record $6.3bn theft. In the first 9.5 hours, users withdrew $4.64bn and deposited $1.01bn, a net outflow of $3.64bn, or 2.1% of assets. Bitcoin fell to 76,173 and is now 78,473. The market is pricing the exchange, not the supply.
    Live Quotes
    Name / SymbolChart% Change / Price
    LTCUSD
    LTCUSD
    0.00%0.00

    cryptocurrency Related Articles

    • Top 3 Price Prediction: Bitcoin, Ethereum, Ripple — Bulls take the reins, with $100K BTC, $3,500 ETH and $2.35 XRP in focus
    • Best Strategies When BTC Price Drops: From Hedging to Accumulating
    • How to Day Trade Crypto? Simplest Day Trading Strategy Ever
    • Trading Chart Patterns:Ultimate Guide to Price Action
    • Places that Provide Cheapest Ways to Buy Bitcoin In 2025
    • 10 Best Crypto With Most Potential to Buy and invest in 2025 - Top Picks from Expert Traders

    Click to view more