Litecoin Price Forecast: LTC holders’ profit-taking activity reaches three-month high

Mitrade
coverImg
Source: DepositPhotos
  • Litecoin price stabilizes around $85 on Thursday after recovering 6% so far this week.

  • On-chain data suggests bearish signals as LTC profit-taking activity reaches a three-month high.

  • Santiment data indicate that a specific whale has offloaded 340,000 LTC tokens.

Litecoin (LTC) is stabilizing at around $85 at the time of writing on Thursday, having recovered 6% so far this week. On-chain data indicate early bearish signals for LTC as holders’ profit-taking activity reaches a three-month high and dormant wallets’ activity increases, signaling growing selling pressure. Additionally, a specific whale has offloaded 340,000 LTC tokens, signaling a bearish outlook for its price.

Three reasons why LTC hints at bearish decline

Litecoin’s price started this week on a positive note, recovering nearly 6% on Monday following the announcement of the Iran-Israel ceasefire, which supported the risk-on sentiment. LTC price consolidated around $85 for the next two days, and at the time of writing on Thursday, it hovers around this level.

Examining its on-chain metrics data provides a clear picture of LTC and hints at early bearish signs. 

Santiment's Network Realized Profit/Loss (NPL) metric indicates that LTC holders are booking some profit. 

As shown in the graph below, the NPL experienced a significant spike on Wednesday, reaching its highest level since the end of March. This spike indicates that holders are, on average, selling their bags at a significant profit and increasing the selling pressure.

Litecoin NPL chart. Source: Santiment

Litecoin NPL chart. Source: Santiment

Santiment's Age Consumed index also shows bearish signs. The spikes in this index suggest dormant tokens (tokens stored in wallets for a long time) are in motion, and it can be used to spot short-term local tops or bottoms. As in the case of Litecoin, history shows that a decline followed the spikes in LTC’s price as holders moved their tokens from wallets to exchanges, thereby increasing selling pressure. The most recent uptick on Wednesday forecasted that LTC was ready for a downtrend.

Litecoin Age Consumed chart. Source: Santiment

Litecoin Age Consumed chart. Source: Santiment

Santiment’s Supply Distribution shows that a certain whale wallet holding LTC tokens between 100,000 and 1 million (red line) had offloaded 340,000 LTC tokens from Tuesday to Thursday, reducing its exposure, which could cause a decline in LTC prices.

LTC Supply Distribution chart. Source: Santiment

LTC Supply Distribution chart. Source: Santiment

Litecoin Price Forecast: LTC bears are taking the lead 

Litecoin price declined by 7% last week and retested its weekly support level at $77.19 on Sunday. However, it recovered most of its losses on Monday and hovered around the $85 level for the next two days. At the time of writing on Thursday, it continues to stabilize at around $85.

If LTC fails to close above the 50% price retracement level at $91.61 and faces a correction, it could extend the decline to retest its weekly support at $77.19.

The Relative Strength Index (RSI) hovers below its neutral level of 50, indicating bearish momentum.
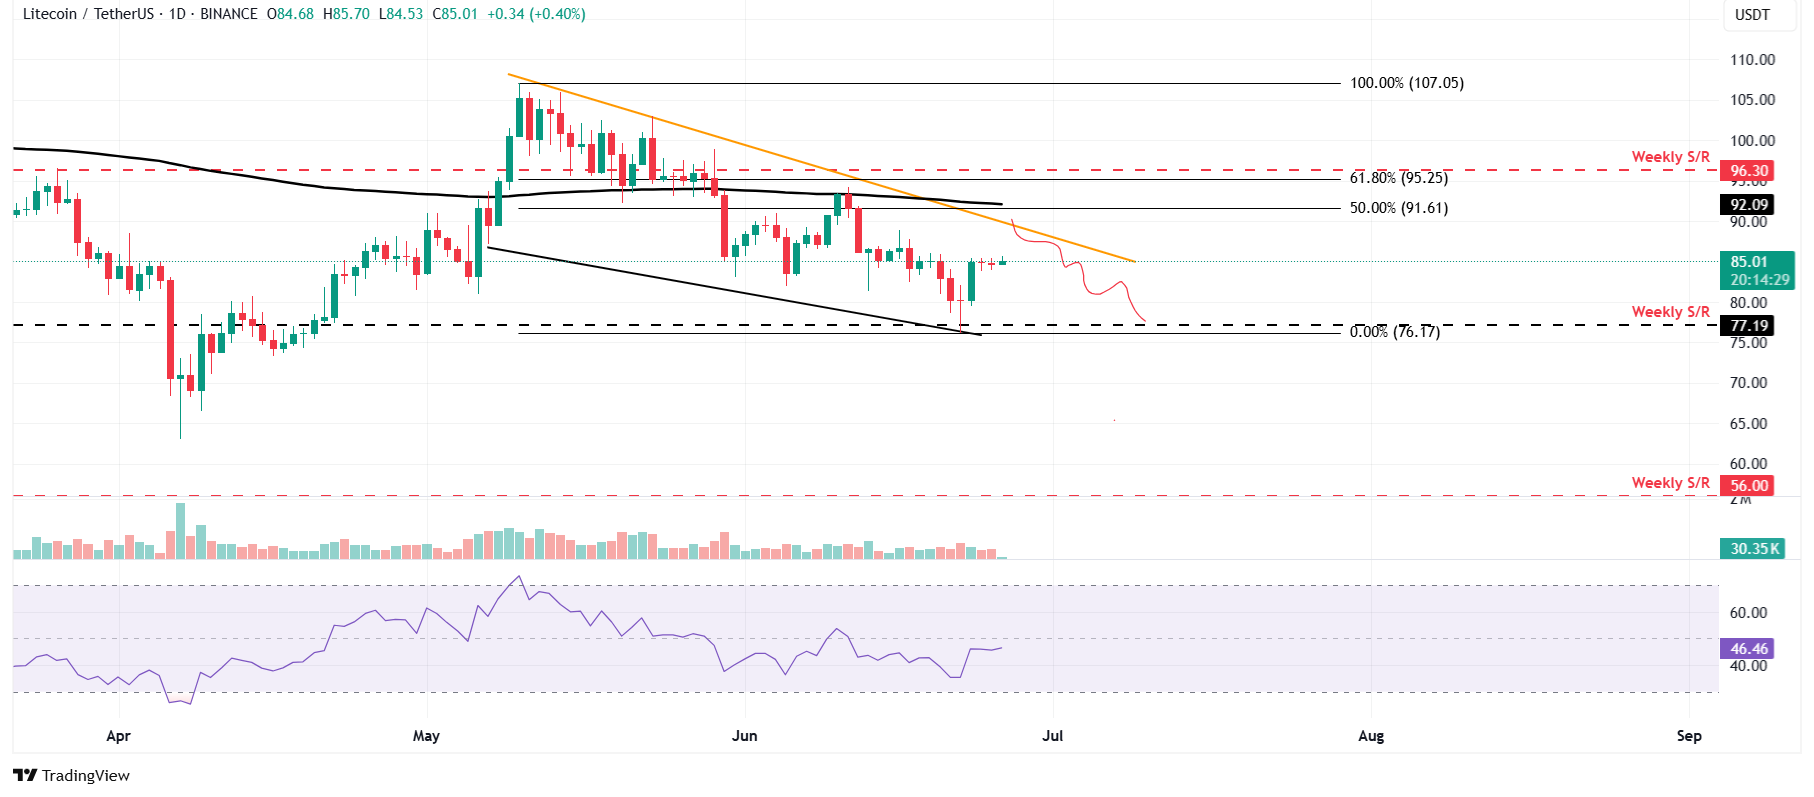
LTC/USDT daily chart

LTC/USDT daily chart

However, if LTC closes above the $91.61 resistance level, it could extend the rally toward its next weekly resistance at $96.30.

Read more

  • Gold Price Forecast: Gold Tumbles Below $3,900 as Trump Says No Need for Iran Deal; Can October PPI Spur a Rebound?
  • Ethereum Drops Below $2,000 After Plunging Over 20% in a Month as Odds of $1,500 Retest Surge
  • Gold hit a one-year low while central banks bought 321 tonnes — the sellers were never the ones you think
  • * The content presented above, whether from a third party or not, is considered as general advice only.  This article should not be construed as containing investment advice, investment recommendations, an offer of or solicitation for any transactions in financial instruments.

    goTop
    quote
    Related Articles
    placeholder
    Ethereum Drops Below $2,000 After Plunging Over 20% in a Month as Odds of $1,500 Retest SurgeEthereum Plunges Over 20% in a Month, Risking a Retest of $1,500 After Losing the $2,000 Defense Line.On November 13, Ethereum (ETH) plunged more than 5%, officially falling below the key
    Author  TradingKey
    Nov 13, Fri
    Ethereum Plunges Over 20% in a Month, Risking a Retest of $1,500 After Losing the $2,000 Defense Line.On November 13, Ethereum (ETH) plunged more than 5%, officially falling below the key
    placeholder
    Bitcoin lost its 200-day average — but the exit started three sessions before the CPIBitcoin fell 2.5% to about $73,400 on 11 November, an 11-week low, breaking its 200-day moving average near $73,100. The 24-hour liquidation tally reached $632 to $705 million, roughly 82% of it longs. But spot ETF outflows began three sessions earlier and USDT's market cap has shrunk $6.6 billion in 60 days — the leveraged length left before the inflation print did. A double top at 81,890 and 81,080 leaves a measured target of 69,366.
    Author  Suzie
    Nov 11, Wed
    Bitcoin fell 2.5% to about $73,400 on 11 November, an 11-week low, breaking its 200-day moving average near $73,100. The 24-hour liquidation tally reached $632 to $705 million, roughly 82% of it longs. But spot ETF outflows began three sessions earlier and USDT's market cap has shrunk $6.6 billion in 60 days — the leveraged length left before the inflation print did. A double top at 81,890 and 81,080 leaves a measured target of 69,366.
    placeholder
    Bitcoin Price Forecast: BTC faces pressure as weekly ETF outflows hit $1.28 billionBitcoin (BTC) remains under pressure on Monday, trading below the 50-week Simple Moving Average (SMA) at $75,222 after extending its losing streak to five consecutive weeks.
    Author  FXStreet
    Nov 09, Mon
    Bitcoin (BTC) remains under pressure on Monday, trading below the 50-week Simple Moving Average (SMA) at $75,222 after extending its losing streak to five consecutive weeks.
    placeholder
    Bitcoin ETFs sold $1.28 billion in a week — and BTC is still above 75,000US spot Bitcoin ETFs logged $1.28 billion of net outflows in the week to Nov 6, the largest since late June, with BlackRock's IBIT accounting for $1.21 billion. Yet BTC only fell from $80,405 to $74,940, a 6.8% move. The gap between the fund flow and the price is the story: leveraged longs were flushed, but spot holders did not follow the ETFs out — and $75,000 is the line that decides whether that reading holds.
    Author  Suzie
    Nov 09, Mon
    US spot Bitcoin ETFs logged $1.28 billion of net outflows in the week to Nov 6, the largest since late June, with BlackRock's IBIT accounting for $1.21 billion. Yet BTC only fell from $80,405 to $74,940, a 6.8% move. The gap between the fund flow and the price is the story: leveraged longs were flushed, but spot holders did not follow the ETFs out — and $75,000 is the line that decides whether that reading holds.
    placeholder
    Binance replaced 95% of a $6.3bn hole — Bitcoin is trading the plumbing, not the coinBinance resumed withdrawals on November 1 after a record $6.3bn theft. In the first 9.5 hours, users withdrew $4.64bn and deposited $1.01bn, a net outflow of $3.64bn, or 2.1% of assets. Bitcoin fell to 76,173 and is now 78,473. The market is pricing the exchange, not the supply.
    Author  Suzie
    Nov 02, Mon
    Binance resumed withdrawals on November 1 after a record $6.3bn theft. In the first 9.5 hours, users withdrew $4.64bn and deposited $1.01bn, a net outflow of $3.64bn, or 2.1% of assets. Bitcoin fell to 76,173 and is now 78,473. The market is pricing the exchange, not the supply.
    Live Quotes
    Name / SymbolChart% Change / Price
    LTCUSD
    LTCUSD
    0.00%0.00

    cryptocurrency Related Articles

    • Top 3 Price Prediction: Bitcoin, Ethereum, Ripple — Bulls take the reins, with $100K BTC, $3,500 ETH and $2.35 XRP in focus
    • Best Strategies When BTC Price Drops: From Hedging to Accumulating
    • How to Day Trade Crypto? Simplest Day Trading Strategy Ever
    • Trading Chart Patterns:Ultimate Guide to Price Action
    • Places that Provide Cheapest Ways to Buy Bitcoin In 2025
    • 10 Best Crypto With Most Potential to Buy and invest in 2025 - Top Picks from Expert Traders

    Click to view more