


Brent slips from $110 as Russian supply prospects return — is the five-month rally over?


Mitrade Insights — Three numbers tell Monday's oil story. $110 is where Brent briefly traded last week — its first visit since May. $108.06 is where the front-month CFD sits this morning, down 1.71%, after Washington moved to ease restrictions on Russian oil flows and traders priced in the return of additional barrels. $101 is where WTI hovered before dipping below $99 intraday. The pullback is real. The question is whether it is a pause in a five-month rally or the start of its unwind.
1. Three numbers: the high, the fade, and the second benchmark
$110 — the high. Brent settled Friday at $109.69, up 4.7% on the week, after touching $110 for the first time since May. The bid was built on supply risk: shipping disruption in the Strait of Hormuz, attacks on Saudi energy infrastructure and strikes on Russian refineries.
$108.06 — the fade. Monday's session opened at $109.65, made its high at the open, then slid to $107.75 before stabilising near $108. The trigger was supply, not demand: the US moved to ease restrictions on Russian oil, and the market began to price the possibility of additional barrels returning to the global pool.
$101 — the second benchmark. WTI traded around $101 for much of the Asian session before slipping below $99, a reminder that the two crudes are not telling the same story. Brent's premium to WTI remains historically wide, reflecting the heavier geopolitical content in the seaborne market.
2. The chain: Russian barrels → Brent → inflation → central banks
The transmission runs in two directions.
Lower prices: If Russian supply returns in size, the marginal barrel becomes cheaper, Brent's supply-risk premium compresses, and the first leg of the chain — crude → transport fuel → headline inflation — eases. That is the disinflationary path central banks want.
Higher prices: The risk premium has not disappeared. Hormuz shipping remains disrupted, Saudi energy infrastructure remains a target, and Russian refining capacity is still being hit. Any new event on those fronts can re-price Brent before the additional barrels actually reach the water.
That is why the market is doing two things at once: fading the headline risk premium, while keeping a floor under the curve. The next link in the chain is Wednesday's US initial jobless claims and Friday's flash PMI, followed by China's Q3 GDP data — all of which feed the demand side of the equation.
3. The levels that matter
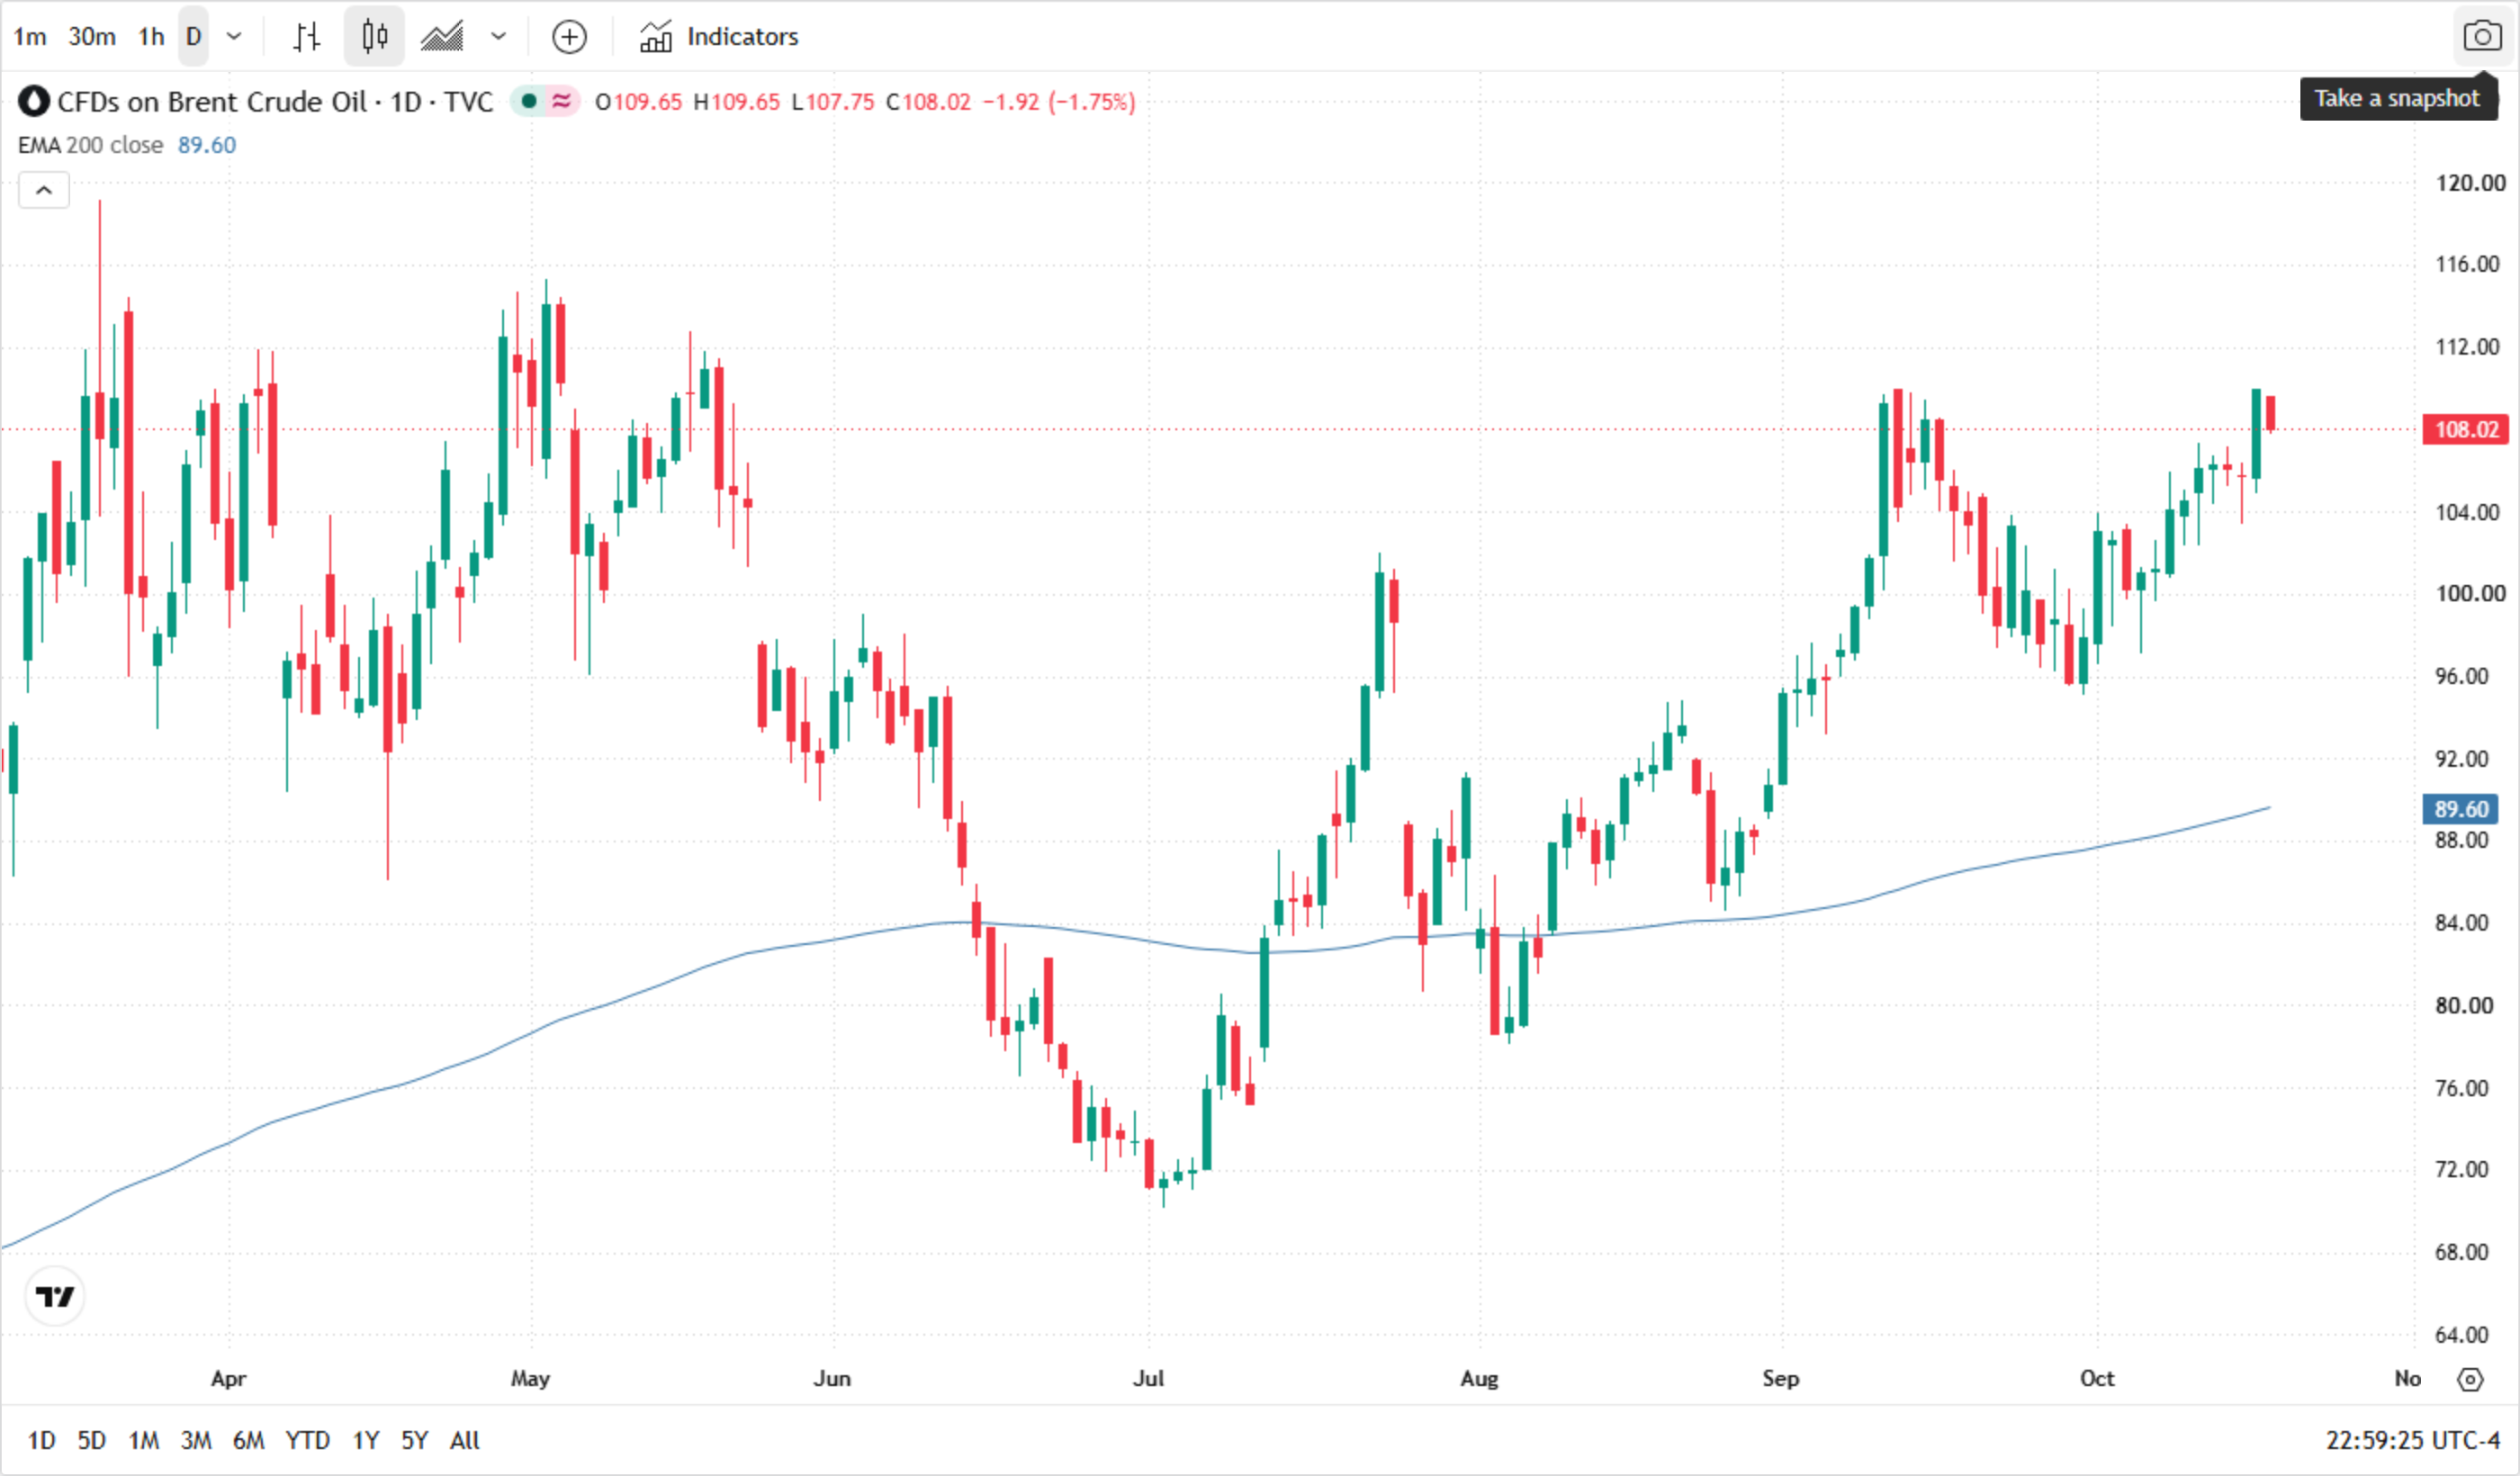
* Chart source: TradingView official chart screenshot (Brent crude CFD / UKOIL).
Above, $110 is the level that capped last week's advance; a daily close above it would re-open the May high and shift the conversation from "pause" to "breakout". Below, $104 is the nearest structural shelf; losing it would put the $100 psychological level and the 200-day EMA at $89.60 back on the map. Between $104 and $110, the market is trading headlines, not trend.
4. The bull case vs the bear case
| The bull case | The bear case |
|---|---|
| Hormuz shipping disruption and attacks on energy infrastructure remain live | Washington's easing of restrictions on Russian oil opens the door to additional barrels |
| Refinery strikes keep product markets tight | Last week's 4.7% rally created crowded long positioning; profit-taking is natural |
| China's Q3 GDP and stimulus expectations support the demand side | OPEC+ still holds spare capacity, and higher prices invite more supply |
| Brent's wide premium to WTI signals genuine seaborne tightness | A stronger dollar raises the cost of oil for non-US buyers |
The bull case is about what could still go wrong with supply; the bear case is about what is already starting to go right with supply. Until one side gets a clean break of $110 or $104, the market is likely to stay headline-driven — and headline-driven markets punish both chasing and fading.
Related reads: Bitcoin's double top at $88,000: why $78,000 is the line that decides the next move · Gold retests $4,200 as dollar and yields retreat — can bullion clear its hardest level?
Read more
* The content presented above, whether from a third party or not, is considered as general advice only. This article should not be construed as containing investment advice, investment recommendations, an offer of or solicitation for any transactions in financial instruments.


