Gold defends $4,100 as BofA targets a break below $4,000 — why the Middle East bid is missing

coverImg
Source: DepositPhotos

Mitrade Insights — Two stories, one session. While Brent pushed through $107 on fresh supply-risk headlines, gold — the market's classic hedge — got no bid: spot flushed to $4,099.89 on Wednesday, a whisker above this month's $4,090 low, before buyers stepped in. It closed at $4,138.25, up 0.82%, its first gain of the week — and it managed that even with US CPI running hot. The rebound is real. So is the problem: Bank of America now expects gold below $4,000 within three months.

The move: a flush, a bounce — and a missing bid

Gold has traded one driver more than any other this year: real yields. Wednesday's CPI didn't loosen that math — long-end yields spiked again before settling — yet gold closed higher anyway, because the dollar's post-CPI pop faded, and in 2026 gold trades as a dollar mirror first and a crisis hedge second.

The crisis bid, meanwhile, went somewhere else: oil. Attacks on Saudi energy infrastructure pushed Brent through $107 this week — the supply-risk channel lifts crude directly, while gold, which prices off rates and the dollar, sat it out. Even BofA's own note makes the contrarian point: if regional tensions escalate further, the risk it flags is central banks resuming sales — Turkey sold a net 82 tonnes and Russia 56 tonnes through August (World Gold Council data) — not a wave of haven buying.

BofA's case, in three lines

#The argumentThe data
DemandKey-buyer purchases are shrinkingDemand tracker −16.6% y/y; India imports −77.8%
Official sectorGold's 2026 pillar can flipTurkey net −82t, Russia −56t through August (WGC); escalation risk = resumed sales
TechnicalsThe chart agrees with the target$3,950 target ≈ the 0.5 Fibonacci retracement at $3,943; $3,900 ~ $4,000 held twice in June-July

BofA's call: gold averages $4,000 in Q4 and trades below $4,000 within three months — which would put it roughly 26% below January's all-time high of $5,598.

The levels that matter
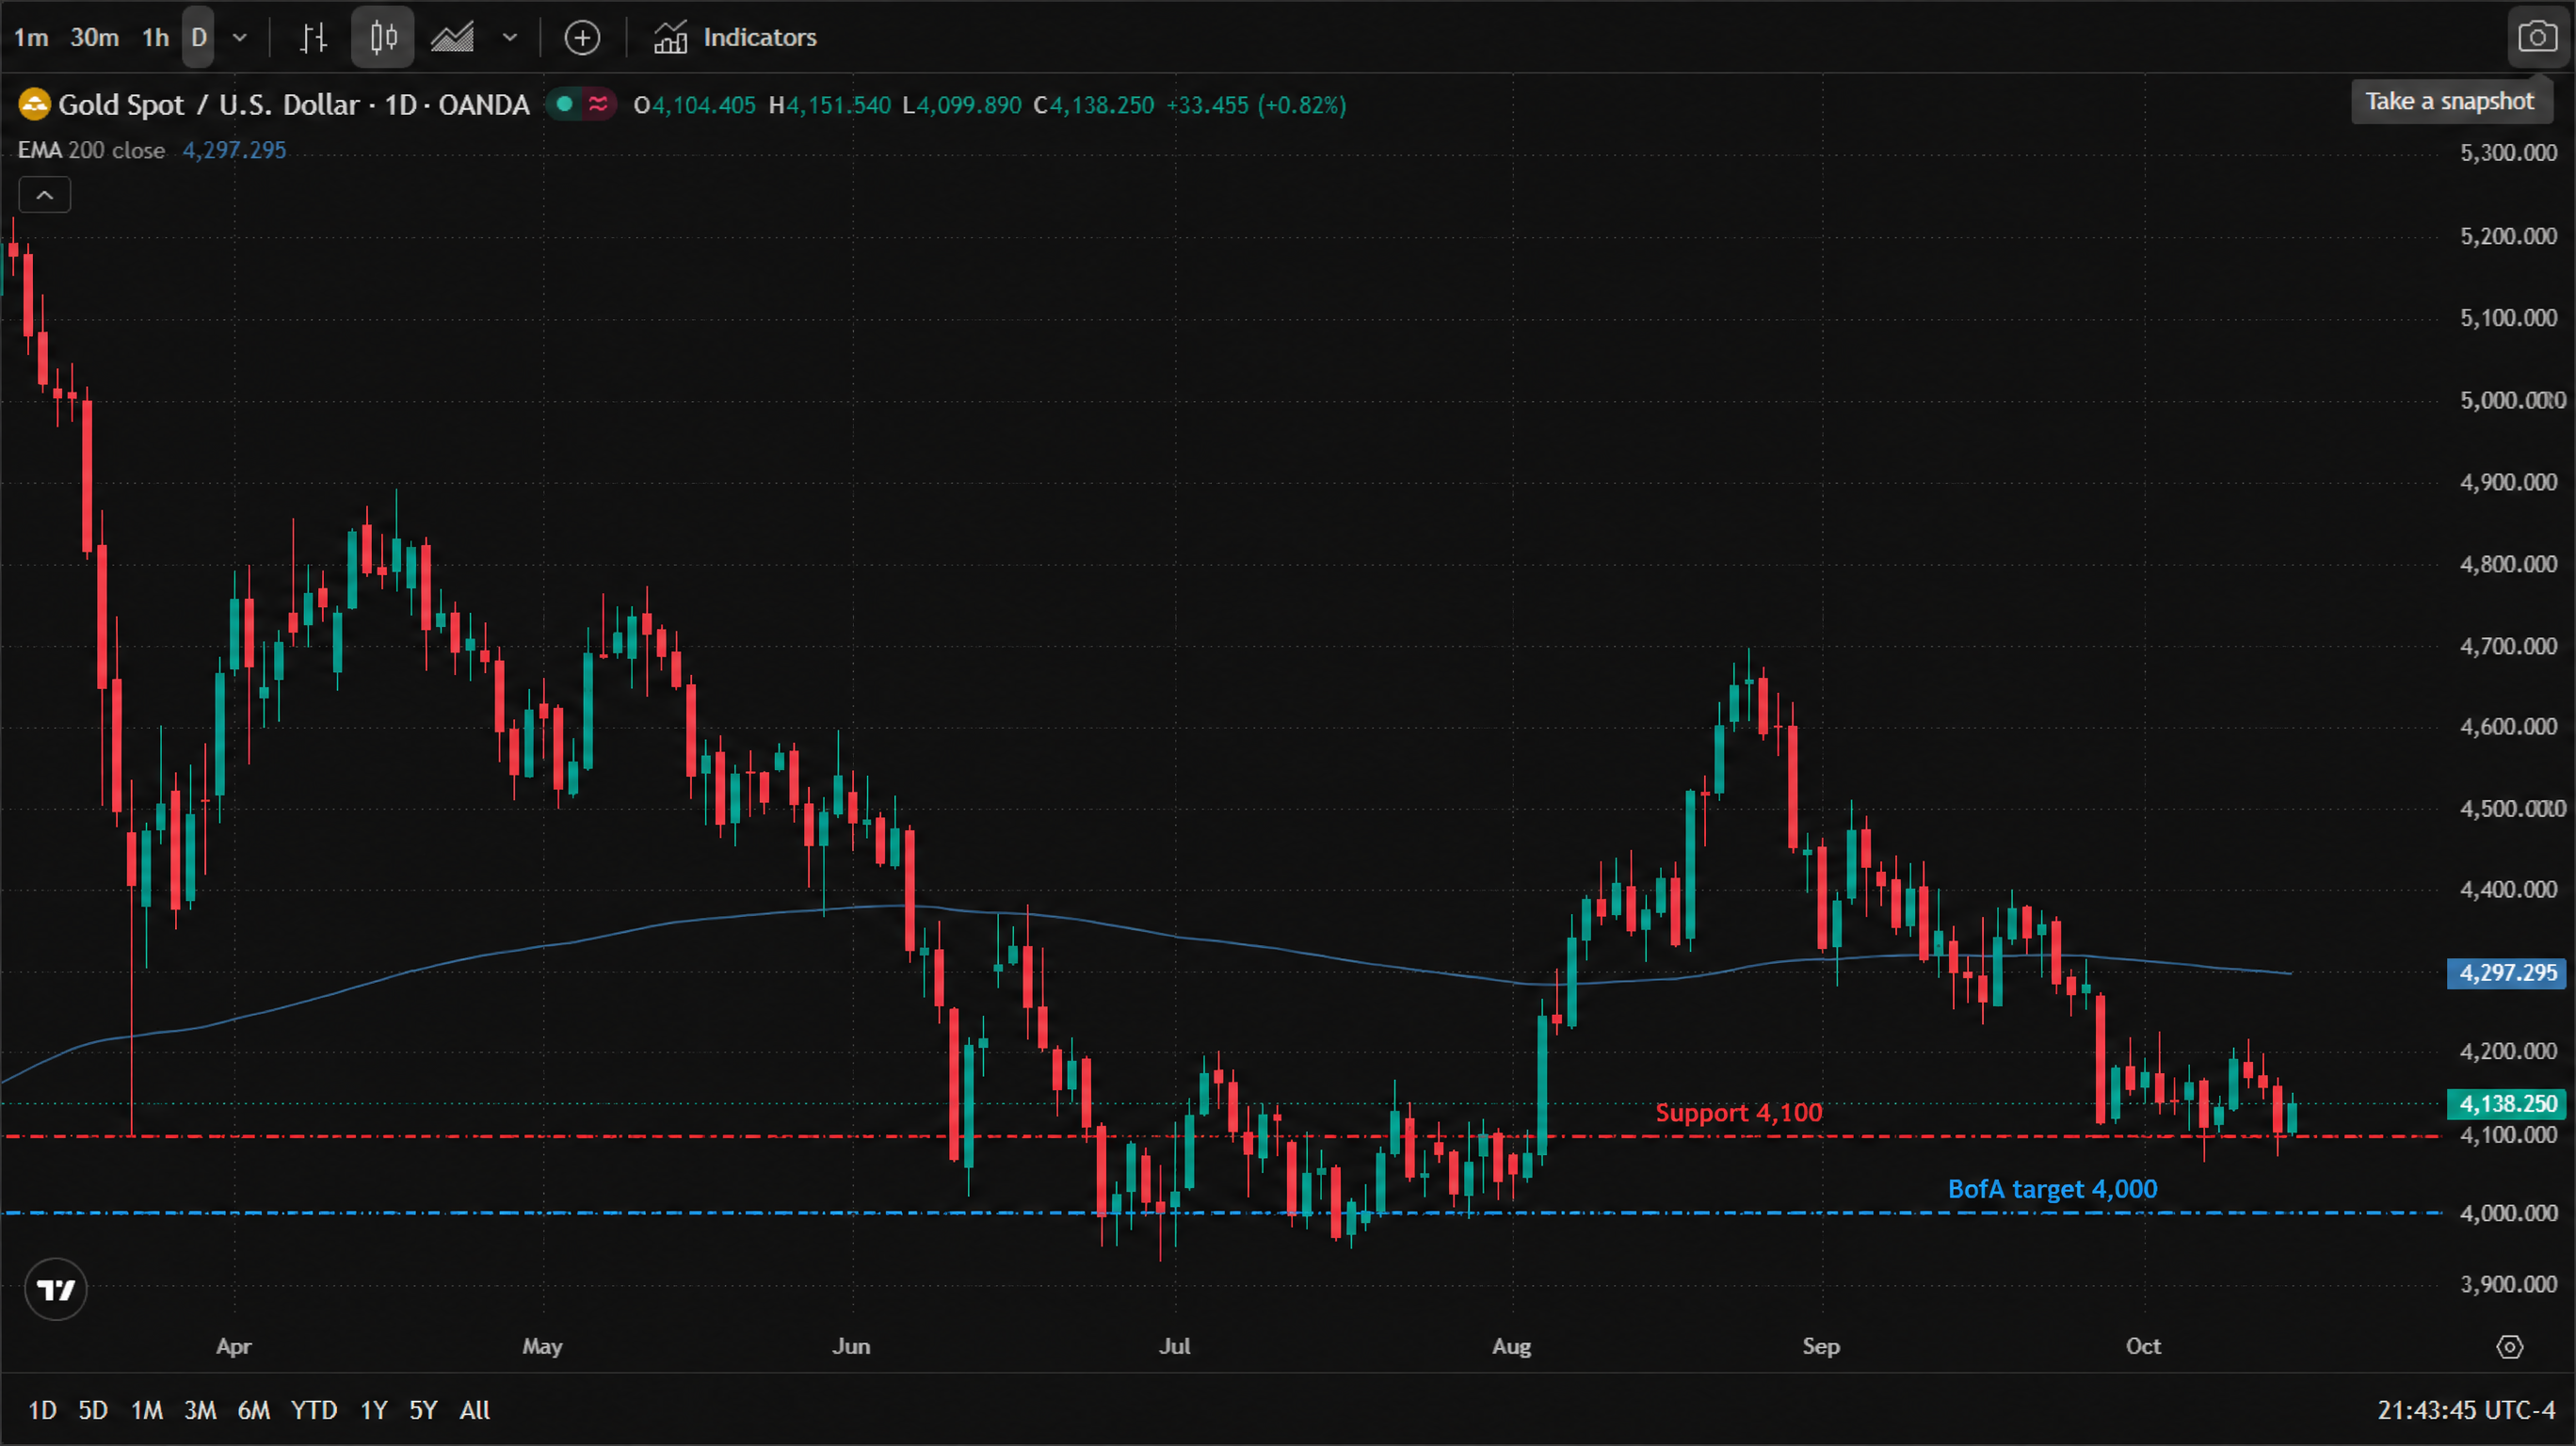
Gold Spot / U.S. Dollar (OANDA) daily candlestick chart with the 200-day EMA, April to October 2026: April highs faded from near 5,000; May slid into the 4,400s; June broke down toward the low 4,000s as July based in the 4,050–4,150 area; August rallied back above 4,500; early September peaked around 4,700, followed by a sustained slide into early October's 4,090 bottom; Wednesday flushed to 4,099.89 and rebounded to close at 4,138.250 (+0.82%), still below the 200-day EMA at 4,297.295. Dashed lines mark support at 4,100 (red) and BofA's 4,000 target (blue).

* Chart source: TradingView official chart screenshot, data source OANDA (spot gold / XAUUSD).

Watch $4,100 first: Wednesday's flush held it — just — with the session low of $4,099.89 stopping roughly ten dollars above the October 7 low of $4,090. Below that, BofA's $4,000 zone is the number the bank wants broken, with $3,950 as the deeper reference. Above, the 200-day EMA near $4,297 — the line draped across the chart — has capped every rebound since the September slide began; spot remains roughly 12% below September's high area.

What flips the script

  • A daily close back above the 200-day EMA (~$4,297). The first sign the September downtrend has actually broken rather than paused.

  • A daily close below $4,090. Opens the $4,000 psychological zone and BofA's $3,950 path in one move.

  • Long-end yields rolling over for more than a session. Every durable gold rally this year has started at the long end of the curve; bounces without that turn have faded.

  • Official-sector flows turning net-positive in the next World Gold Council monthly update — the single biggest swing factor in BofA's own thesis.

Bottom line: the bounce answered to the dollar; the target answers to demand. Between $4,090 and the 200-day EMA, gold is boxed — and both edges are now defined.

Read more

  • Gold Price Forecast: Ahead of September CPI, Will Gold Break Above $4,200 or Fall Below $4,100?
  • WTI rises above $94.00 amid escalating Middle East hostilities, supply risks
  • Note: If you want to share the article 《Gold defends $4,100 as BofA targets a break below $4,000 — why the Middle East bid is missing》, make sure you retain the original link. For more information, please visit Insights or browse www.mitrade.com.


    Before making any trading decisions, it is important to equip yourself with sufficient fundamental knowledge, have a comprehensive understanding of market trends, be aware of risks and hidden costs, carefully consider investment targets, level of experience, risk appetite, and seek professional advice if necessary.


    Furthermore, the content of this article is solely the author's personal opinion and does not necessarily constitute investment advice. The content of this article is for reference purposes only, and readers should not use this article as a basis for any investment decisions.


    Investors should not rely on this information as a substitute for independent judgment or make decisions solely based on this information. It does not constitute any trading activity and does not guarantee any profits in trading.


    If you have any inquiries regarding the data, information, or content related to Mitrade in this article, please contact us via email: insights@mitrade.com. The Mitrade team will carefully review the content to continue improving the quality of the article.


    goTop
    quote
    Related Articles
    placeholder
    US September CPI recap: inflation hits 3.7% as core runs hot — is an October Fed hike back on the table?September CPI landed hot: headline 3.7% y/y, core 2.6% y/y and 0.3% m/m. October hike odds jumped from ~22% to ~37% — yet the dollar faded to 101.74, gold closed higher and the S&P 500 fell 1.11%. Here is the full repricing, the levels and what to watch next.
    Author  Irene Q.
    2 hours ago
    September CPI landed hot: headline 3.7% y/y, core 2.6% y/y and 0.3% m/m. October hike odds jumped from ~22% to ~37% — yet the dollar faded to 101.74, gold closed higher and the S&P 500 fell 1.11%. Here is the full repricing, the levels and what to watch next.
    placeholder
    US September CPI Preview: Inflation May Heat Up, How Will US Stocks, Dollar and Gold React?The U.S. will release its September CPI data on Wednesday (October 14) Eastern Time, which will be one of the most important inflation reports ahead of the Federal Reserve's October 27-28
    Author  TradingKey
    Oct 13, Tue
    The U.S. will release its September CPI data on Wednesday (October 14) Eastern Time, which will be one of the most important inflation reports ahead of the Federal Reserve's October 27-28
    placeholder
    Gold posts first weekly gain in three weeks — can $4,200 hold through CPI?Spot gold closed at $4,194.645, up 1.47% — its first weekly gain in three weeks — and COMEX futures settled back above $4,200 at $4,220.30. Here are the drivers, the levels and the scenarios into Wednesday's CPI.
    Author  Irene Q.
    Oct 10, Sat
    Spot gold closed at $4,194.645, up 1.47% — its first weekly gain in three weeks — and COMEX futures settled back above $4,200 at $4,220.30. Here are the drivers, the levels and the scenarios into Wednesday's CPI.
    placeholder
    United States Dollar Index sits near March 2025 highs, above 102.00 ahead of US NFPThe US Dollar Index (DXY), which tracks the Greenback against a basket of currencies, attracts buyers for the fifth straight day and climbs back above the 102.00 mark during the Asian session on Friday.
    Author  FXStreet
    Oct 02, Fri
    The US Dollar Index (DXY), which tracks the Greenback against a basket of currencies, attracts buyers for the fifth straight day and climbs back above the 102.00 mark during the Asian session on Friday.
    placeholder
    US September Nonfarm Payrolls Preview: Job Growth May Cool, How Will US Stocks, Dollar and Gold React?On Friday, October 2 (EDT), the U.S. will release its September nonfarm payrolls report, with markets focusing on whether job growth can sustain August's rebound and whether the data will
    Author  TradingKey
    Oct 01, Thu
    On Friday, October 2 (EDT), the U.S. will release its September nonfarm payrolls report, with markets focusing on whether job growth can sustain August's rebound and whether the data will
    Live Quotes
    Name / SymbolChart% Change / Price
    XAUUSD
    XAUUSD
    0.00%0.00
    XAGUSD
    XAGUSD
    0.00%0.00

    USD Related Articles

    • Financial Markets 2026: Volatility Catalysts in Gold, Silver, Oil, and Blue-Chip Stocks—A CFD Trader's Outlook
    • Best Currency Pairs To Trade 2026: Guide to Choosing Currency Pairs
    • Trading Chart Patterns:Ultimate Guide to Price Action
    • Australian Dollar Forecast In 2024/2025/2026: Should I Buy AUD/USD Or Other AUD Currency Pairs?
    • AUD/USD holds above 0.6500, eyes on RBA Minutes

    Click to view more