


Gold Price Analysis Today | Forex Gold Analysis | XAU/USD Analysis - October 21, 2026


Today's Gold Price
Gold price chart for today
*0% Commission and Low Spreads 0️⃣
*$50,000 in Free Virtual Funds 💰
*$100 New Customer Bonus 🎁
Gold (XAU/USD) traded around $4,115 on the morning of October 21, 2026, hovering near the week's low after persistent pressure. Although the U.S. 10-year Treasury yield eased to 5.116% and Brent crude fluctuated on diplomatic talks in the Strait of Hormuz, a sharp slowdown in the U.S. housing market failed to support buying because markets still place more than a 92% probability on a Fed rate increase in December. The key question is whether gold can hold above support at $4,104–4,113.
Today's Key Points
| Key Points |
|
|
|
Hormuz diplomacy drives oil lower; Treasury yields ease but gold remains pressured by December Fed rate expectations
Spot gold remained in negative territory around $4,115–4,122 per ounce, although the U.S. 10-year Treasury yield eased to 5.116% and Brent crude quickly fell from highs above $111.99 per barrel after reports of diplomatic talks to reduce tensions in the Strait of Hormuz. Although no clear agreement has been reached, lower oil prices have temporarily eased inflation panic.
But lower oil prices and Treasury yields did little to support gold because markets still assign a 92–94% probability to a Fed rate increase in December after September CPI and PPI data remained hot. Investors view a hold in October as only a temporary pause, so persistently high interest costs continue to weigh on gold.
U.S. housing market slows sharply as housing starts fall 5.2%; high rates depress property demand to multi-year lows
U.S. economic data clearly show that high interest rates are heavily pressuring the housing sector. September housing starts fell 5.2% to 1.221 million units, below expectations of 1.305 million units. Single-family construction fell 4.6%, while the NAHB homebuilder confidence index dropped to 29, reflecting a clearly weak market.
Pending home sales fell 7.3% month on month and 11.3% year on year, reaching their lowest level since records began in 2001. Mortgage interest costs are destroying purchasing power, but sticky inflation means markets still do not believe the Fed will rush to cut rates. The weak data therefore have not been able to fully revive gold buying.
WGC says tokenized gold could unlock $700 billion in new demand and transform institutional collateral
The World Gold Council (WGC), with Boston Consulting Group, released its Digital Gold report saying tokenized gold could unlock as much as $700 billion in new investment demand if the market develops neutral infrastructure connecting physical gold holdings with digital systems, from a current market value of only $4 billion.
ICBC Standard Bank says tokenization could unlock gold on balance sheets as highly liquid collateral, while HSBC says it could attract younger investors. The WGC is developing Gold as a Service to enhance liquidity and support long-term market infrastructure.



Technical Analysis of Gold (XAU/USD)
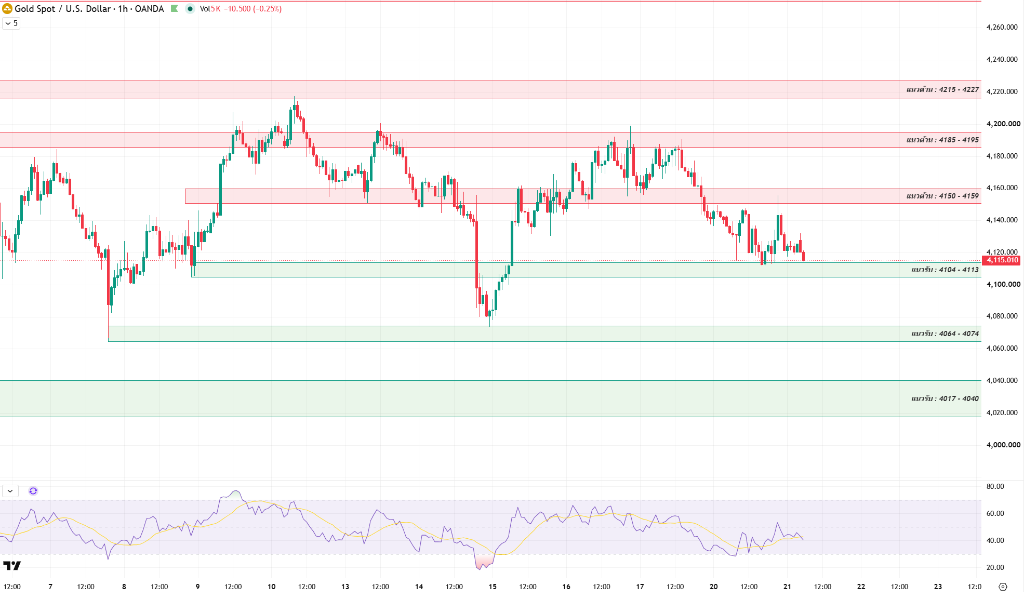
On the 1-hour chart, gold was sold below minor resistance at $4,150–4,159 to around $4,115.01. The short-term structure is weak and is testing first support at $4,104–4,113, where buying triggered a rebound last week.
The RSI is fluctuating around 40–42, slowing its decline and attempting to build a base, suggesting selling pressure has begun to ease. But price remains below the moving-average cluster, so a rebound still needs clear confirmation of a price base.
The key decision point is support at $4,104–4,113. Holding there and reclaiming $4,150–4,159 would open the way to a recovery, while a break below would risk follow-through selling.
If prices hold above support at $4,104–4,113 and break through resistance at $4,150–4,159, they could recover toward $4,185–4,195. But if they break below first support, they risk a correction toward $4,064–4,074 and $4,017–4,040.
Today's Gold Price Outlook
| Scenarios |
|
|
|
Today's Trading Strategy
Short-term traders should watch the response around key support and resistance levels and avoid chasing short positions near support as selling pressure begins to slow.
- Buy setup: Consider a position if prices pull back to the $4,104–4,113 support zone and show clear buying support and easing selling pressure, or follow a break and hold above $4,159, targeting $4,185–4,195 with a stop-loss below $4,095.
- Sell setup: Consider a position if prices rebound to test resistance at $4,150–4,159 or $4,185–4,195 and fail, or on a break below $4,104, targeting $4,064–4,074 with a stop-loss above resistance.
For long-term investors, structural factors from U.S. debt and tokenized gold remain strong. Consider gradually accumulating only after a pullback establishes a base above major support at $4,064 or $4,017–4,040.
Daily Support and Resistance Levels
| Type | Price Level |
| Support #1 | $4,104–4,113 |
| Support #2 | $4,064–4,074 |
| Support #3 | $4,017–4,040 |
| Resistance #1 | $4,150–4,159 |
| Resistance #2 | $4,185–4,195 |
| Resistance #3 | $4,215–4,227 |
Today's Questions (FAQ)
Why has a sharp slowdown in the U.S. housing market failed to support gold prices?
Although a weak housing market reflects the impact of high interest rates, accelerating September inflation led markets to believe that the Fed will still need to raise rates in December. Treasury yields therefore remain elevated and attract funds more than non-interest-bearing gold.
How can tokenized gold create new demand in the global market?
Tokenization can unlock gold in vaults and turn it immediately into liquid collateral in institutional financial systems, while also allowing retail investors to access investment at lower entry amounts.
Read more
The above content was completed with the assistance of AI and has been reviewed by an editor.


