


Gold Price Analysis Today | Forex Gold Analysis | XAU/USD Analysis - October 16, 2026


Today's Gold Price
Gold price chart for today
*0% Commission and Low Spreads 0️⃣
*$50,000 in Free Virtual Funds 💰
*$100 New Customer Bonus 🎁
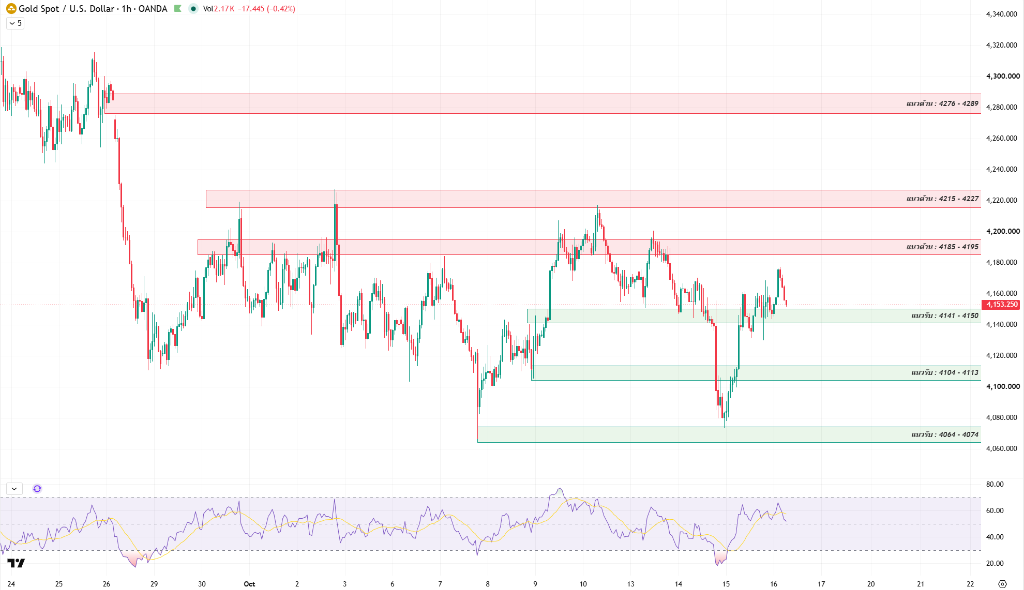
Gold (XAU/USD) traded around $4,153 on the morning of October 16, 2026, after rebounding more than $64 from the $4,064–4,074 base. The move was supported by the 10-year Treasury yield falling to 5.09% and a weaker dollar as fears over AI companies’ debt prompted buying of Treasuries. The question today is whether gold can hold above support at $4,141–4,150 to build momentum for a break above $4,185–4,195, despite PPI inflation rising 6.3% and retail sales increasing 0.8%.
Today's Key Points
| Key Points |
|
|
|
September PPI inflation surges 6.3% to the highest level in more than a year, but markets see the Fed pausing rate increases this month
The U.S. Labor Department said September PPI rose 1.3% month on month, above the 0.6% forecast, pushing annual producer inflation to 6.3% year on year. That was the largest monthly increase since March 2022. Energy prices rose 10.8% as gasoline prices jumped 20.3%, while core PPI increased 0.7% month on month to 5.0% year on year, reinforcing the earlier picture of CPI inflation rising to 3.7%.
Artem Bakushev of Monaxa said the PPI data had completely shattered hopes of disinflation for the Fed. Yet markets reduced the probability of a Fed rate increase on October 27–28 to 29%–34%, even as the probability of an increase in December stood as high as 91%. Economists expect core PCE to accelerate to 3.1% year on year later this month, allowing gold to shake off the pressure and rebound strongly on expectations of a near-term slowdown in rate increases.
Fears over Big Tech AI debt trigger a rush into Treasuries, sending yields down 10 basis points and supporting gold
Despite hot inflation, the U.S. bond market staged a major rally, with the 10-year Treasury yield falling 10 basis points to 5.09%, its steepest one-day decline since August 2025. Investors worried about the enormous debt burdens and infrastructure spending of AI companies, selling technology stocks and shifting funds into U.S. Treasuries for safety.
Falling Treasury yields and a weaker dollar eased gold’s opportunity-cost pressure, drawing institutional investors back to buy as a hedge. Gold rebounded strongly from its weekly base as portfolios were repositioned to shelter from volatility in U.S. equities and reduce private-sector debt risk.
September retail sales rise a solid 0.8%, lifting gold toward $4,170 amid the Strait of Hormuz oil crisis
The U.S. Commerce Department said September retail sales increased 0.8% month on month, above the 0.3% forecast, while core sales rose 0.9%, reflecting still-strong consumption. Tensions in the Strait of Hormuz remained elevated, supporting Brent crude’s close at $105.92 and WTI’s rise to $96.50.
Strong consumer demand and the war-risk premium pushed gold up more than $64, or 1.56%, to $4,168.70 before it consolidated around $4,153 this morning. Silver rose 3.24% to $57.31, reflecting continued interest in safe-haven assets.



Technical Analysis of Gold (XAU/USD)
On the 1-hour chart, gold rebounded sharply from support at $4,064–4,074 to a high around $4,168–4,170 before pulling back this morning to test whether it can hold above first support at $4,141–4,150 and confirm the strength of buying interest.
The RSI climbed from oversold territory to 65 before pulling back toward 55–60, indicating that buyers still hold the advantage and that the consolidation is cooling the indicator’s overheated conditions.
The day’s pivotal point is a firm reclaim of the $4,141–4,150 support zone. Sustained closes above that level would confirm a higher-low structure and build momentum to test the next resistance level.
If prices hold above support at $4,141–4,150 and break through resistance at $4,185–4,195, they could open upside toward $4,215–4,227 and $4,276–4,289. But if they fall below $4,141, they risk a bull trap and a slide toward support at $4,104–4,113.
Today's Gold Price Outlook
| Scenarios |
|
|
|
Today's Trading Strategy
Short-term traders should trade the range with discipline, watch the response around support at $4,141–4,150, and avoid chasing long positions without volume confirming a breakout.
Buy setup: Wait for a pullback to support at $4,141–4,150 with buying interest absorbing liquidity, or follow a break above $4,195, targeting $4,215–4,227 with a stop-loss below $4,130.
Sell setup: Consider positions if prices rebound to test resistance at $4,185–4,195 and show rejection, or on a break below $4,141, targeting $4,104–4,113 with a stop-loss above resistance.
For long-term investors, falling Treasury yields support gold, but still-high inflation may keep interest rates elevated for longer. Wait for a clear higher-low base above major support before gradually accumulating positions.
Daily Support and Resistance Levels
| Type | Price Level |
| Support #1 | $4,141–4,150 |
| Support #2 | $4,104–4,113 |
| Support #3 | $4,064–4,074 |
| Resistance #1 | $4,185–4,195 |
| Resistance #2 | $4,215–4,227 |
| Resistance #3 | $4,276–4,289 |
Today's Questions (FAQ)
Why did PPI inflation surge while Treasury yields fell and gold rebounded?
High inflation normally pushes Treasury yields higher. This time, however, the market worried about AI companies’ debt, so investors sold risk assets and rushed into U.S. Treasuries for safety. That drove the 10-year yield sharply lower and weakened the dollar, reducing the opportunity cost of holding gold and supporting an immediate rebound.
Does gold’s rebound to around $4,168 signal a new uptrend?
The rebound has eased oversold conditions and begun to create a recovery setup, but it is too early to conclude that a new uptrend has begun. Gold must first hold above support at $4,141–4,150 and break through resistance at $4,185–4,195 to confirm a higher base; otherwise, it risks being only a rebound that builds selling pressure.
Read more
The above content was completed with the assistance of AI and has been reviewed by an editor.


