


The Stock Market Has Crossed This Dubious Threshold 6 Times in 155 Years -- and History Couldn't Be Clearer What Comes Next
Key Points
The stock market has been virtually unstoppable, with the Dow Jones Industrial Average, S&P 500, and Nasdaq Composite all hitting record highs in recent months.
Under a select set of circumstances, one time-tested valuation tool has a perfect track record of foreshadowing significant declines in Wall Street's major stock indexes.
Thankfully, stock market cycles aren't linear, which is a powerful realization for long-term investors.
- 10 stocks we like better than S&P 500 Index ›
For much of the last seven years, the stock market has been unstoppable. The benchmark S&P 500 (SNPINDEX: ^GSPC) has gained at least 16% for three consecutive years on three occasions throughout its nearly century-long history. Two of those streaks have occurred over the last seven years (2019-2021 and 2023-2025).
Meanwhile, we've watched the iconic Dow Jones Industrial Average (DJINDICES: ^DJI) reach 50,000 and the growth-stock-driven Nasdaq Composite (NASDAQINDEX: ^IXIC) briefly top 24,000.
Will AI create the world's first trillionaire? Our team just released a report on the one little-known company, called an "Indispensable Monopoly" providing the critical technology Nvidia and Intel both need. Continue »
Stocks have been fueled by game-changing innovation, such as the artificial intelligence (AI) revolution and the advent of quantum computing, as well as historic share buyback activity by S&P 500 companies.
But when things seem too good to be true on Wall Street, they typically are.

Image source: Getty Images.
Although the stock market is a time-tested wealth-creating machine (something I'll touch on in more detail later), it's also historically expensive. Based on what 155 years of history show, the party may be nearing an end.
The stock market is historically expensive -- and that's bad news for investors
To preface the following discussion, "value" is subjective. What one investor believes is pricey might be viewed as a bargain by another.
Nevertheless, one time-tested valuation tool has historically done a phenomenal job of pushing beyond this subjectivity. The metric in question is the S&P 500's Shiller Price-to-Earnings (P/E) Ratio, which is also referred to as the Cyclically Adjusted P/E Ratio (CAPE Ratio).
The Shiller P/E is based on average inflation-adjusted earnings over the previous 10 years. That compares with the traditional P/E ratio (the go-to valuation metric for most investors), which accounts only for trailing 12-month earnings. Whereas recessions or shock events easily trip up the P/E ratio, the CAPE Ratio remains useful.
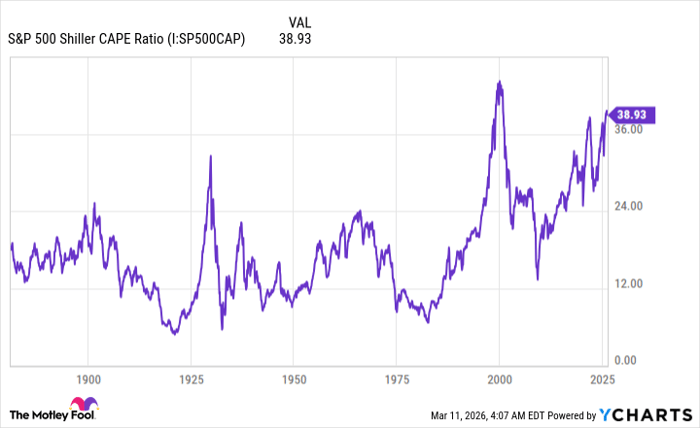
S&P 500 Shiller CAPE Ratio data by YCharts.
Although economists didn't introduce the Shiller P/E until the late 1980s, it's been back-tested to January 1871. Over 155 years, it's averaged 17.35.
But as you'll note, it's spent much of the last 30 years above this mark. Lower interest rates and the internet revolution, which broke down information barriers between Wall Street and Main Street that had existed for more than a century, paved the way for greater risk-taking by retail investors.
Over the last five months, the S&P 500's CAPE Ratio has danced between 39 and 41, marking the second-priciest stock market in history. It's also the sixth instance in 155 years where the Shiller P/E has exceeded 30 for at least a two-month period.
S&P 500 Shiller PE Ratio hits 2nd highest level in history 🚨 The highest was the Dot Com Bubble 🤯 pic.twitter.com/Lx634H7xKa
-- Barchart (@Barchart) December 28, 2025
Although a Shiller P/E of 30 is an arbitrary line in the sand, history shows that it represents trouble for Wall Street. Here's how the major stock indexes have performed when this threshold has been crossed:
- August to September 1929: In the months leading up to the start of the Great Depression, the Shiller P/E topped 30 for the first time. The Dow Jones Industrial Average would eventually lose 89% of its value.
- June 1997 to August 2001: The CAPE Ratio hit its highest value ever (44.19 in December 1999) in the months before the dot-com bubble officially burst. The S&P 500 and Nasdaq Composite shed 49% and 78% of their respective value before the stock market bottomed.
- September 2017 to November 2018: The Shiller P/E peaked above 33 in early 2018. By the fourth quarter of 2018, the S&P 500 was mired in a downturn that reached 20%.
- December 2019 to February 2020: Just prior to the COVID-19 pandemic taking shape, the Shiller P/E topped 30 again. During the five-week COVID-19 crash in February-March 2020, the S&P 500 lost 34% of its value.
- August 2020 to May 2022: The fiscal stimulus-fueled post-COVID rally saw the CAPE Ratio peak just above 40 in the first week of January 2022. This was followed by the nine-month-long 2022 bear market, which wiped away one quarter of the S&P 500's value.
- November 2023 to present: Thus far, the Shiller P/E has peaked at 41.20, making this the second-priciest stock market on record.
A Shiller P/E above 30 has foreshadowed an eventual 20% (or greater) pullback in one or more of Wall Street's major indexes every time over 155 years.
The one caveat to this data is that the Shiller P/E offers investors no assistance in determining when the music will stop. Sometimes, pricey markets last for mere months. On other occasions, such as during the dot-com era, stocks remained historically expensive for more than four years. Although we don't know precisely when a significant decline will begin, history couldn't be clearer that a 20% or greater drop is expected.

Image source: Getty Images.
History is a pendulum that favors long-term optimists
While historical correlations with the Shiller P/E point to the possibility of significant declines in the Dow Jones Industrial Average, S&P 500, and Nasdaq Composite, history is a pendulum that swings both directions on Wall Street and overwhelmingly favors investors who maintain perspective and exercise patience.
On the one hand, stock market corrections, bear markets, and even those feared elevator-down moves are normal, healthy, and inevitable. Think of these events as the price of admission for investing in the greatest wealth creator on the planet.
But what's most important to recognize about these declines is that they're often short-lived. Stock market cycles aren't linear, which is a powerful realization for long-term-minded investors.
Recently, market research firm Bespoke Investment Group published a data set on X (formerly Twitter) that analyzed the length of every S&P 500 bull and bear market dating back to the start of the Great Depression (September 1929). What researchers found was overwhelming evidence supporting optimists.
The current bull market -- the "AI Bull" -- has eclipsed the 1,200-day mark. This is the 10th bull market to last 1,000+ days based on the 20% rally/decline threshold.
-- Bespoke (@bespokeinvest) February 10, 2026
Bear markets, on average, are much shorter, at just 286 days, with the longest being 630 days back in... pic.twitter.com/ds7lqWWHFh
Bespoke's data shows that the average of 27 bear markets has lasted just 286 calendar days (approximately 9.5 months), with none surpassing 630 calendar days.
On the flipside, the typical S&P 500 bull market has endured for 1,011 calendar days since September 1929, with 10 of these bull markets lasting at least 1,200 calendar days. The average bull market is 3.5 times longer than the typical bear market.
This data demonstrates that every significant downturn in the Dow, S&P 500, and Nasdaq Composite represents an opportunity for long-term-minded investors to pounce with confidence.
Should you buy stock in S&P 500 Index right now?
Before you buy stock in S&P 500 Index, consider this:
The Motley Fool Stock Advisor analyst team just identified what they believe are the 10 best stocks for investors to buy now… and S&P 500 Index wasn’t one of them. The 10 stocks that made the cut could produce monster returns in the coming years.
Consider when Netflix made this list on December 17, 2004... if you invested $1,000 at the time of our recommendation, you’d have $514,000!* Or when Nvidia made this list on April 15, 2005... if you invested $1,000 at the time of our recommendation, you’d have $1,105,029!*
Now, it’s worth noting Stock Advisor’s total average return is 930% — a market-crushing outperformance compared to 187% for the S&P 500. Don't miss the latest top 10 list, available with Stock Advisor, and join an investing community built by individual investors for individual investors.
See the 10 stocks »
*Stock Advisor returns as of March 15, 2026.
Sean Williams has no position in any of the stocks mentioned. The Motley Fool has no position in any of the stocks mentioned. The Motley Fool has a disclosure policy.
Recommended Articles


