




Bitcoin Price Forecast: BTC struggles as ETF outflows, geopolitical uncertainty weigh
- Bitcoin hovers around $83,600 on Monday after a 3.1% correction last week.
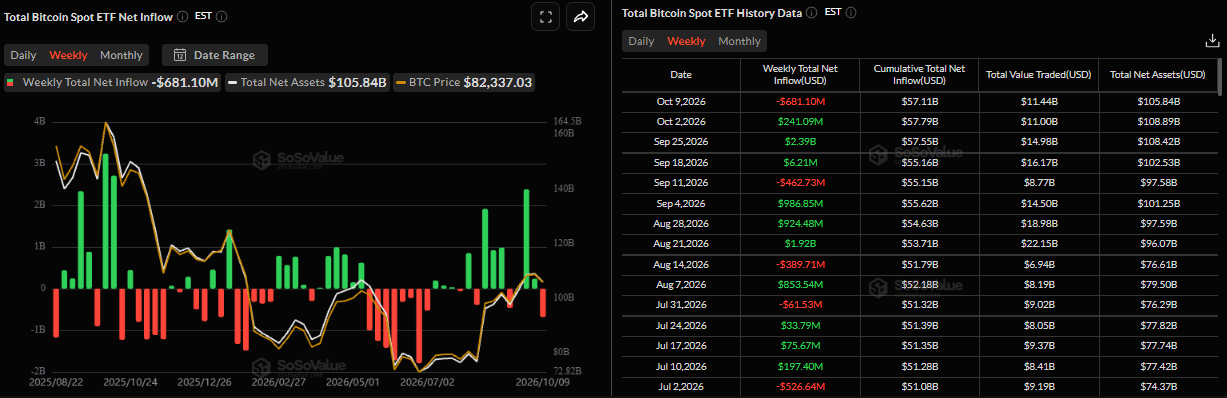
- US-listed spot ETFs recorded an outflow of $681.10 million last week, snapping the three-week inflow streak.
- Geopolitical uncertainty and mixed signals keep investors cautious.
Bitcoin (BTC) steadies around $83,600 at the time of writing on Monday, after a 3.1% decline last week. Institutional demand shows weakening signs, with spot Exchange Traded Funds (ETFs) recording $681.10 million in net outflows last week, ending a three-week streak of inflows. Meanwhile, ongoing geopolitical uncertainty and mixed signals are dampening risk appetite, keeping investors cautious and capping Crypto King’s rebound.
Geopolitical uncertainty and mixed signals dampen risk appetite
US President Donald Trump on Sunday claimed Russia and Ukraine have agreed to an ”energy ceasefire”, but he offered no details on it, as per The Guardian.
“Effective immediately, there is an ENERGY CEASEFIRE in the War between Russia and Ukraine. Both parties have agreed. Do not break it!” he wrote on his Truth Social network.
Ukraine’s President Volodymyr Zelenskyy said that he was not aware of the “energy ceasefire” between Ukraine and Russia announced by Trump, but added that if Moscow agreed to it, Kyiv would accept it.
However, addressing the conference virtually on Monday, Zelenskyy said it is clear that Russian President Vladimir Putin “does not read Truth Social”, the site where the US president posted his ceasefire declaration. As we have been reporting, Russia’s strikes continued despite the announcement.
“Immediately after the post, Russia launched a targeted strike on a power plant in Kharkiv, causing further damage to our energy system,” Zelenskyy said, noting that Ukraine is facing a wave of escalatory attacks from Russia ahead of the winter.
In addition, last week Trump said the US would not attack Iran before the November 3 midterm elections and that the two sides were holding productive discussions, which supported mild recovery in BTC.
However, the Saudi-led coalition said on Sunday that an unidentified projectile hit a passenger terminal at King Khalid International Airport in Riyadh. The Houthis swiftly claimed the attacks, saying they were a response to “Saudi aggression.”
These developments underscore persistent uncertainty and mixed signals, dampening risk appetite and, therefore, weighing on risk-sensitive assets such as BTC.
Institutional demand shows signs of weakness
Institutional demand for Bitcoin showed weakness last week, supporting its price decline. SoSoValue data show spot ETFs recorded $681.10 million in outflows last week, snapping the three-week inflow streak. If these withdrawals continue and intensify throughout this week, BTC could see further correction.
Bitcoin technical outlook: Faces rejection from key zone
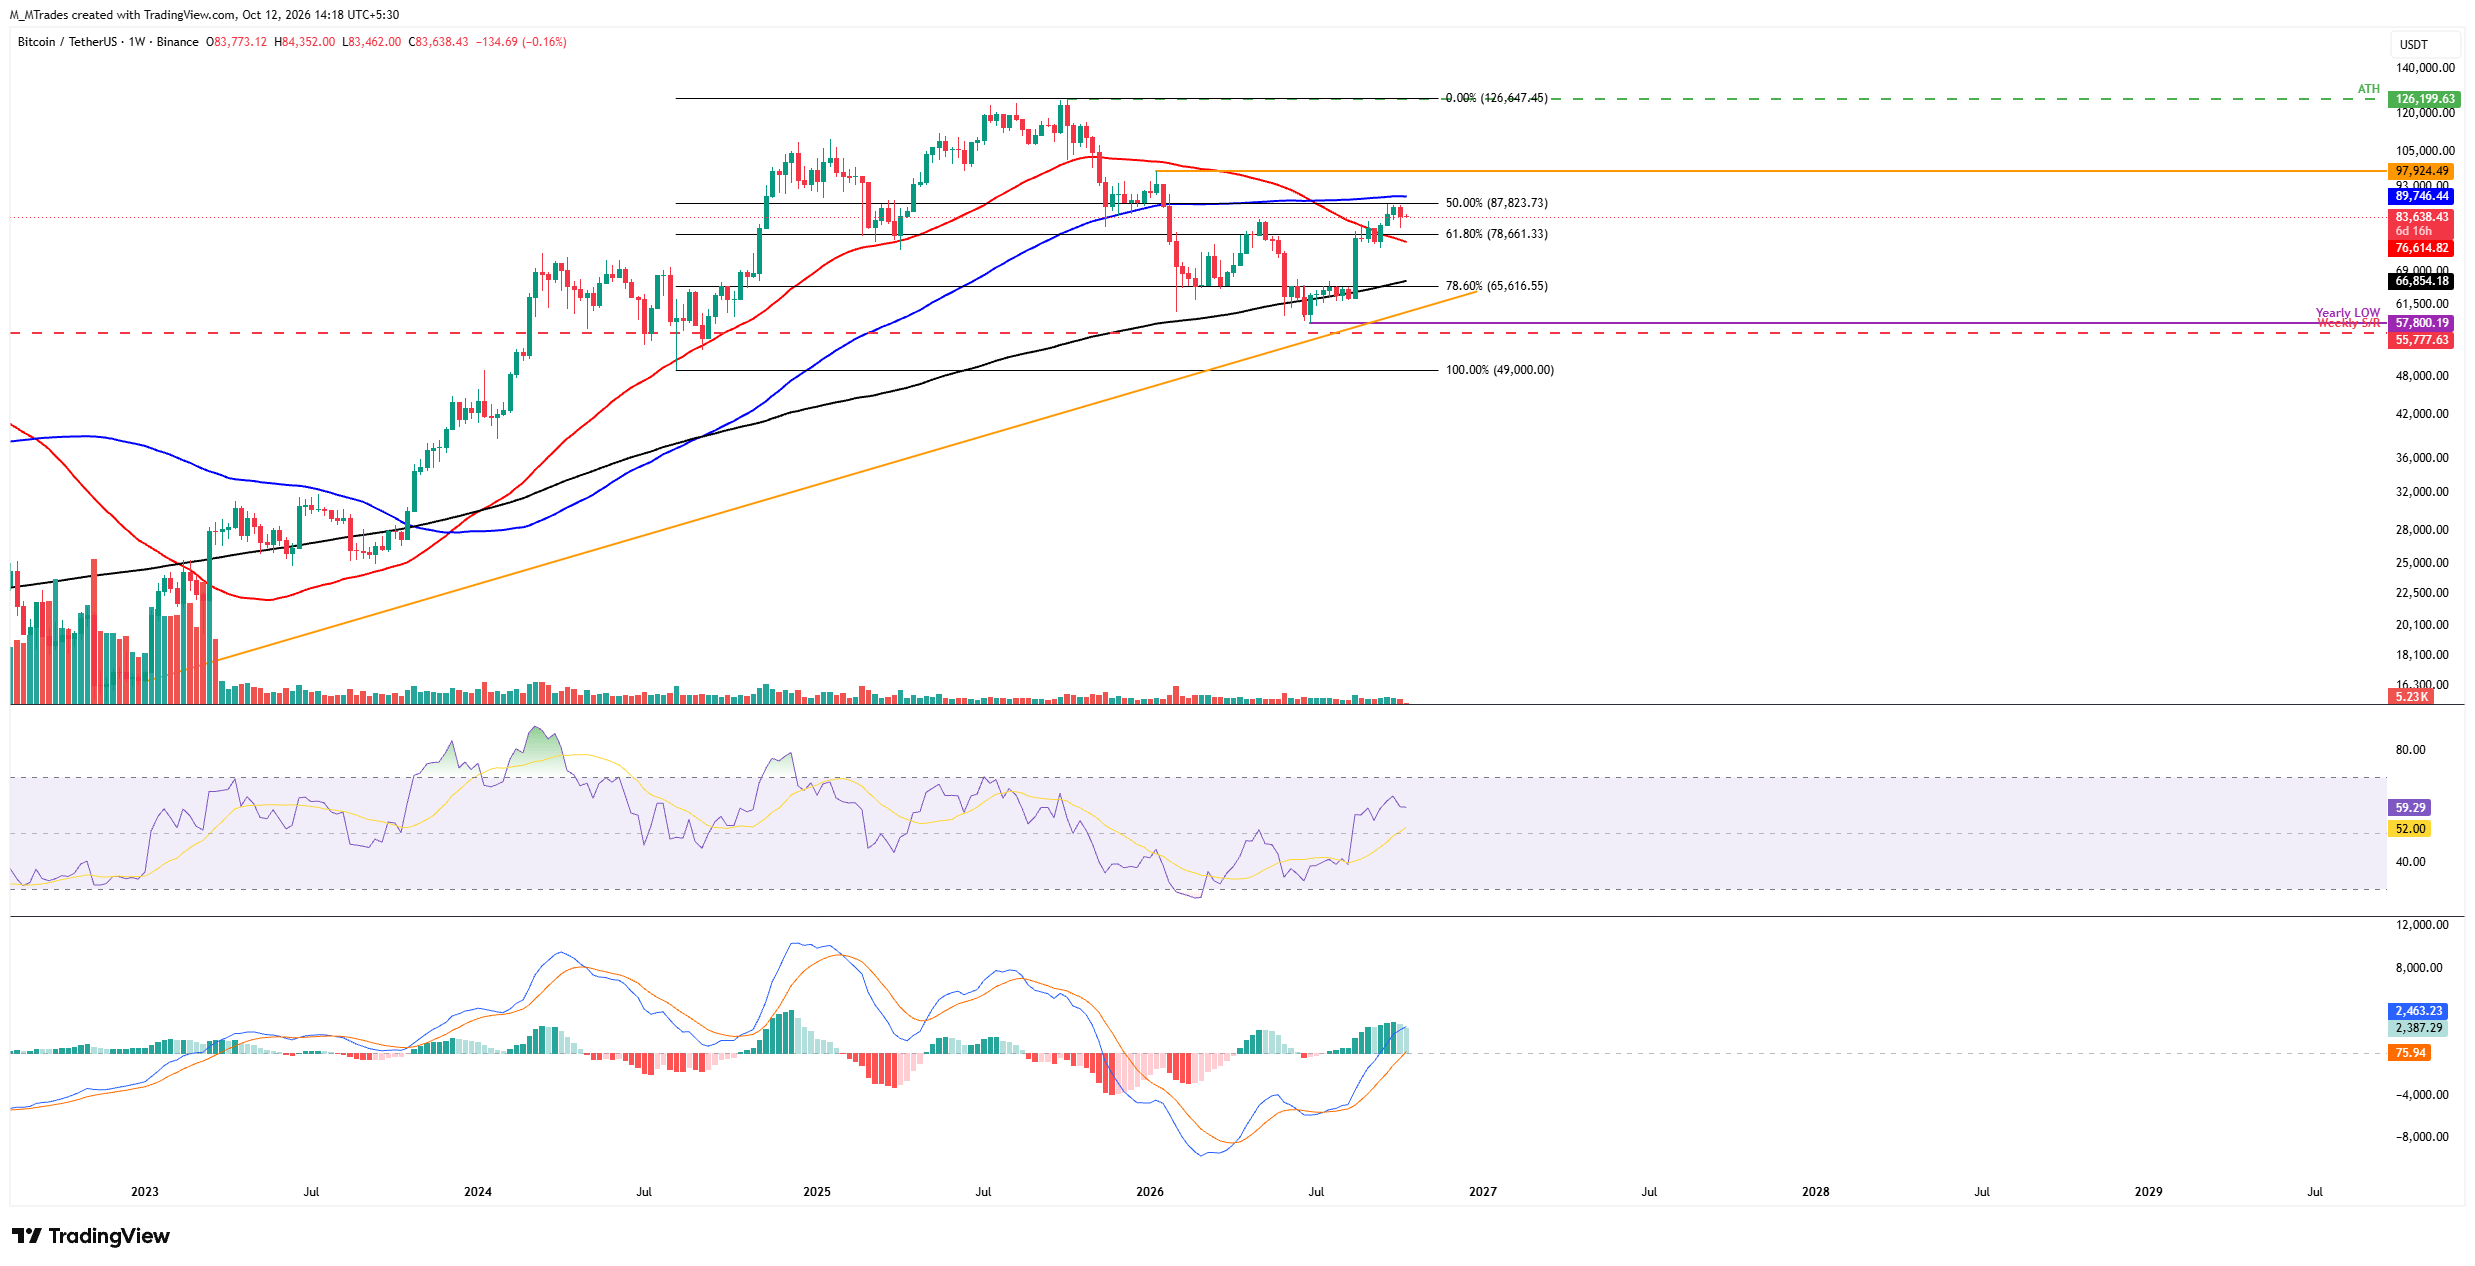
The Crypto King dropped 3.19% last week after facing rejection at the 50% Fibonacci retracement level of $87,823 (drawn from the August 2024 low of $49,000 to the October 2025 record high of $126,199). At the start of this week, on Monday, BTC hovered around $83,500.
If BTC continues its correction, it could extend the losses toward the 61.8% Fibonacci retracement level of $78,661, which roughly coincides with the 50-week Simple Moving Average (SMA) at $76,614.
The Relative Strength Index (RSI) on the weekly chart around 59 shows mildly positive momentum without reaching overbought conditions. At the same time, the Moving Average Convergence Divergence (MACD) histogram remains firmly in positive territory, hinting that upside pressure persists despite nearby resistance and ongoing pullback.
If BTC recovers, it could extend the advance toward $87,823, then the 100-week SMA at $89,746.
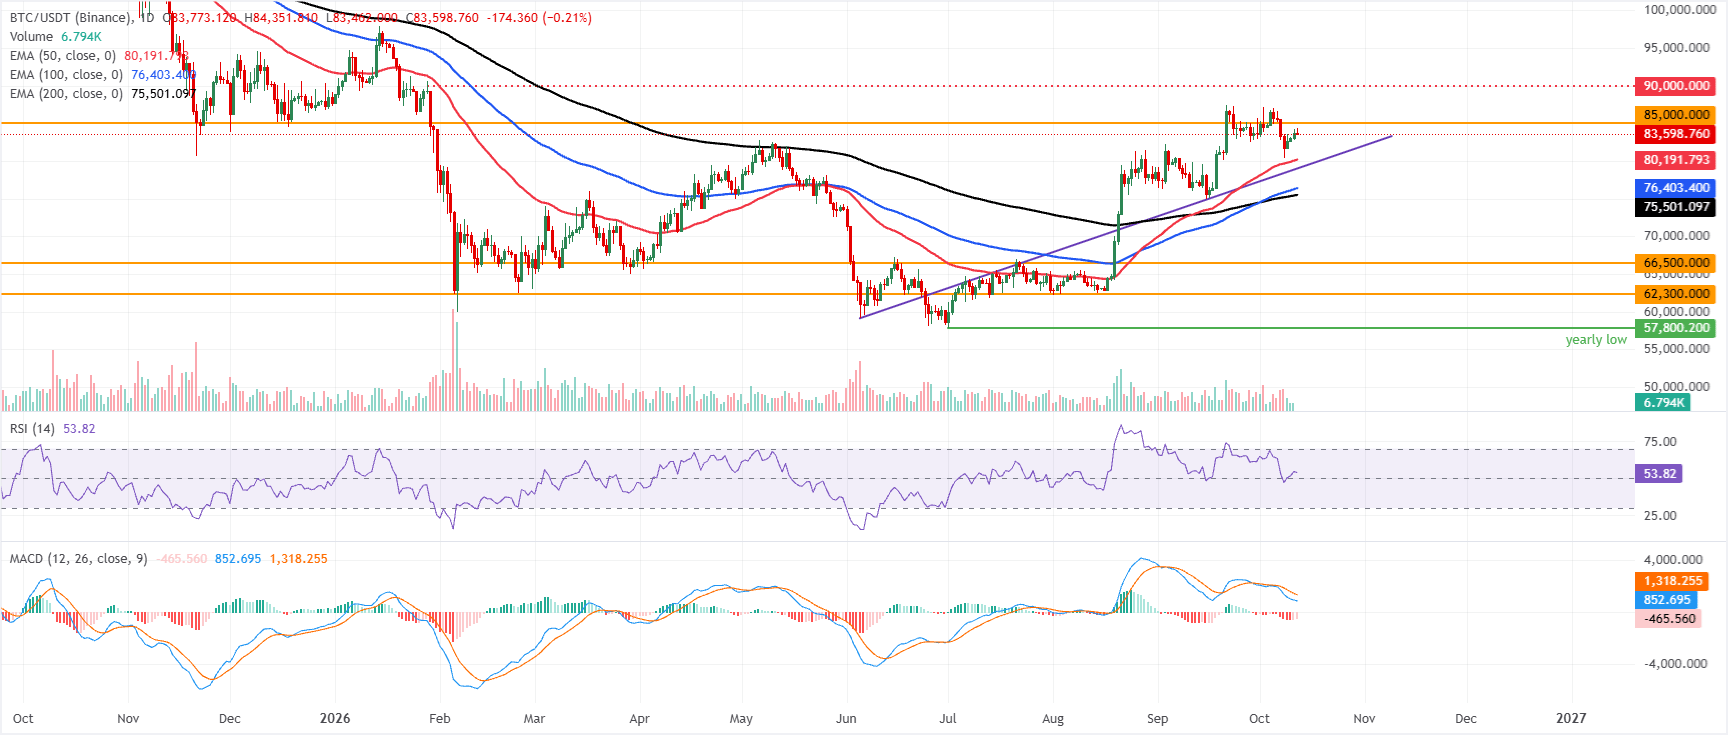
On the daily chart, BTC holds a constructive bias as it consolidates well above the 50-day, 100-day, and 200-day Exponential Moving Averages (EMAs), clustered between roughly $75,500 and $80,200.
The RSI on the daily chart at about 53 suggests moderate positive momentum without overbought conditions. At the same time, the MACD histogram remains below zero, hinting that bullish follow-through is still tentative despite the supportive trend backdrop.
On the topside, initial resistance is located at the horizontal barrier near $85,000, where a clear daily close above would open the way for a fresh leg higher.
On the downside, immediate dynamic support is provided by the 50-day EMA around $80,191, followed by the 100-day EMA near $76,403 and the 200-day EMA at approximately $75,501; a deeper pullback toward the prior horizontal floors at $66,500 and $62,300 would likely attract dip-buying interest while keeping the broader bullish structure intact.
(The technical analysis of this story was written with the help of an AI tool. Know more.)
Bitcoin, altcoins, stablecoins FAQs
Bitcoin is the largest cryptocurrency by market capitalization, a virtual currency designed to serve as money. This form of payment cannot be controlled by any one person, group, or entity, which eliminates the need for third-party participation during financial transactions.
Altcoins are any cryptocurrency apart from Bitcoin, but some also regard Ethereum as a non-altcoin because it is from these two cryptocurrencies that forking happens. If this is true, then Litecoin is the first altcoin, forked from the Bitcoin protocol and, therefore, an “improved” version of it.
Stablecoins are cryptocurrencies designed to have a stable price, with their value backed by a reserve of the asset it represents. To achieve this, the value of any one stablecoin is pegged to a commodity or financial instrument, such as the US Dollar (USD), with its supply regulated by an algorithm or demand. The main goal of stablecoins is to provide an on/off-ramp for investors willing to trade and invest in cryptocurrencies. Stablecoins also allow investors to store value since cryptocurrencies, in general, are subject to volatility.
Bitcoin dominance is the ratio of Bitcoin's market capitalization to the total market capitalization of all cryptocurrencies combined. It provides a clear picture of Bitcoin’s interest among investors. A high BTC dominance typically happens before and during a bull run, in which investors resort to investing in relatively stable and high market capitalization cryptocurrency like Bitcoin. A drop in BTC dominance usually means that investors are moving their capital and/or profits to altcoins in a quest for higher returns, which usually triggers an explosion of altcoin rallies.
Recommended Articles


