



Solana Price Forecast: SOL tests resistance breakout amid ETFs inflows, retail demand

Source Fxstreet
  • Solana holds above its 50-day EMA on Friday after roughly 5% gains the previous day.
  • Institutional investors' return continues this week as SOL-focused ETFs recorded $15.50 million in inflows on Thursday.
  • Retail demand follows suit, with SOL futures Open Interest rising by double digits in 24 hours to $5.53 billion.

Solana (SOL) trades below $90 at press time on Friday, testing grounds above the 50-day Exponential Moving Average (EMA) at $87.42. Institutional demand is resurfacing, with over $20 million in inflows so far this week, while retail investors are returning, as SOL derivatives data shows a positional buildup. Technically, Solana should exceed the 100-day EMA at $98.00 for an extended rally.

Demand heats up for Solana in leverage and institutional markets

Solana is regaining momentum in the leverage market, aligning with the renewed institutional interest. The Sosovalue data shows $15.50 million in inflows into SOL-focused Exchange Traded Funds (ETFs) on Thursday, marking the third consecutive daily inflow this week and bringing the total to $22.14 million. 
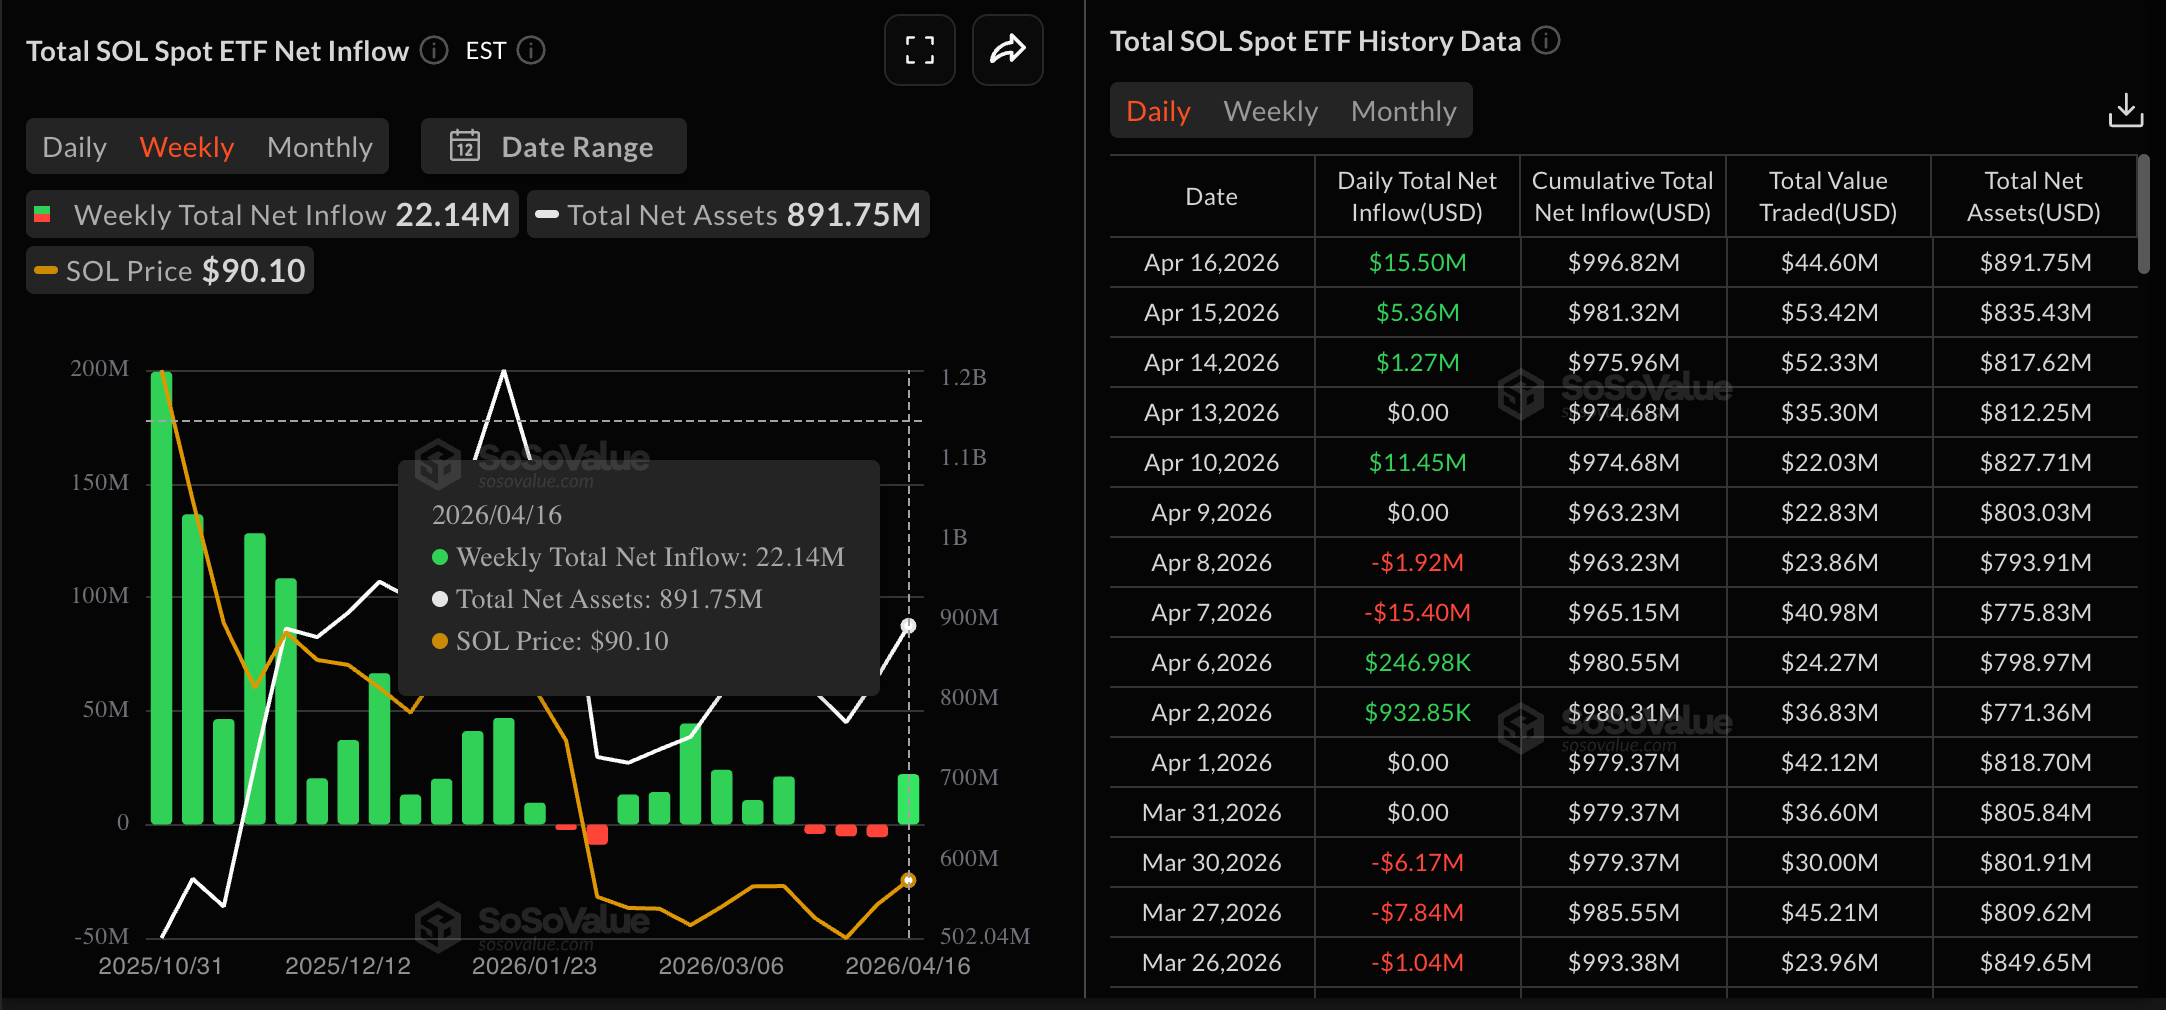
SOL ETFs data. Source: Sosovalue

On the other hand, the CoinGlass data shows SOL futures Open Interest (OI) is at $5.53 billion on Friday, reflecting an uptick after a steady decline in positional value. A surge in OI reflects renewed anticipation among retail traders, which could provide leveraged support to spot prices.
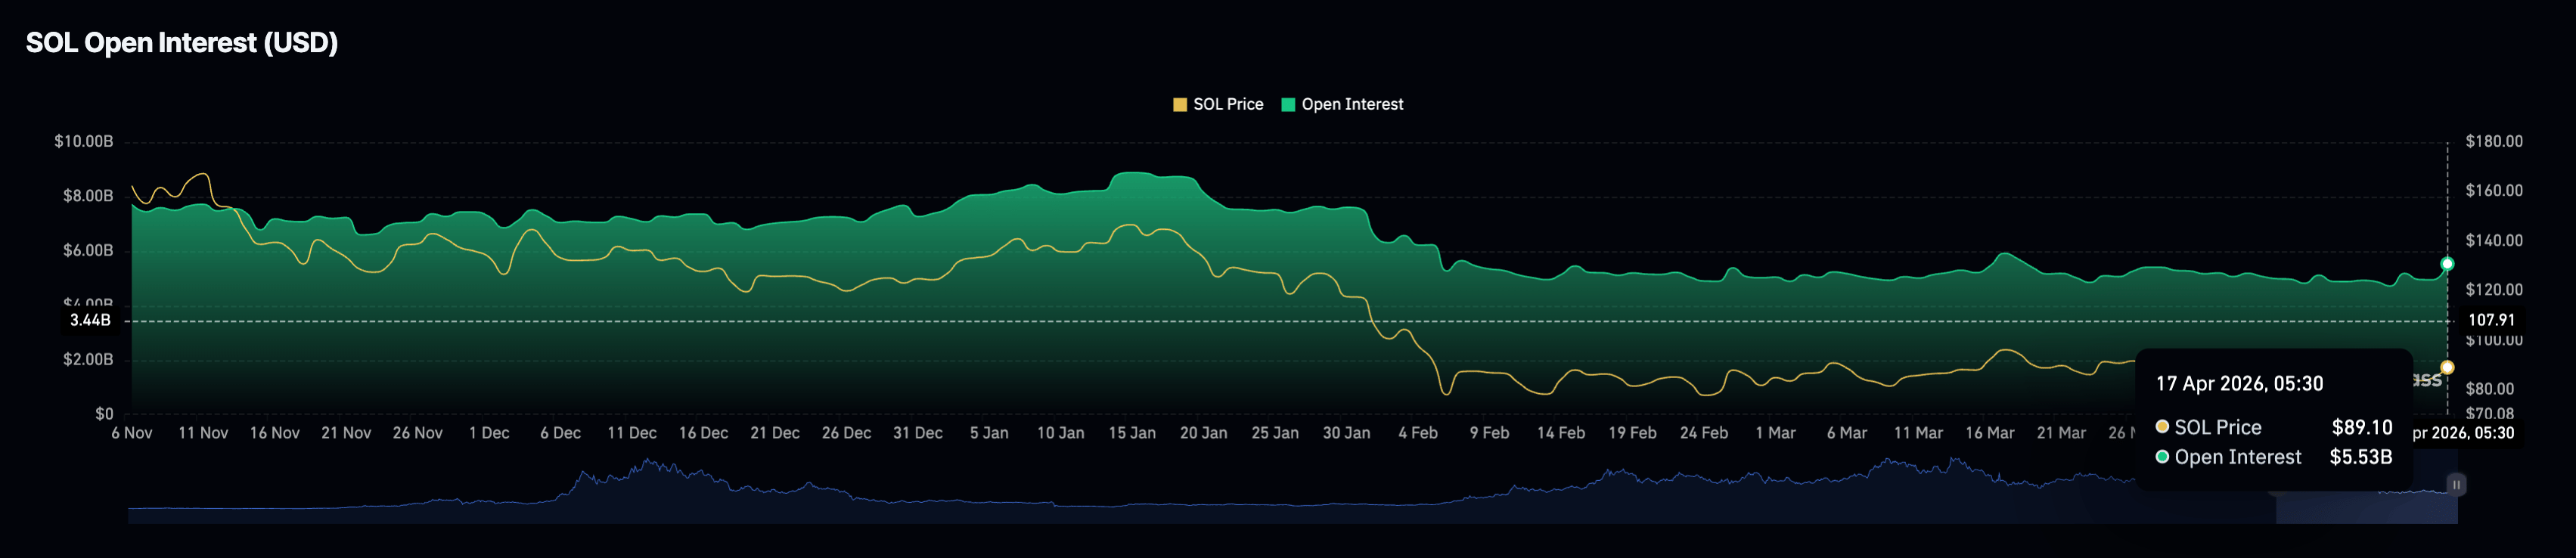
SOL Open Interest data. Source: CoinGlass

Technical outlook: Will Solana resurface above $100?

Solana holds just above the 50-day EMA at $87.43, while remaining well below the 100-day EMA at $98.01 and the 200-day EMA near $117.38, leaving the broader trend capped despite a short-term floor.

The Moving Average Convergence Divergence (MACD) line is in positive territory on the daily chart above its signal line, with constructive histogram bars. Meanwhile, the Relative Strength Index (RSI) at 55 suggests improving but not yet impulsive bullish momentum within this mid-range context.

On the topside, initial resistance is at the 100-day EMA at $98.01, with the 200-day EMA at $117.38 as the next technical barrier, which marks a major structural cap.

Chart Analysis SOL/USDT (Binance)
SOL/USDT daily price chart.

On the downside, immediate support is provided by the 50-day EMA at $87.43, broken by Thursday's close at $89.05. A daily close below this level would weaken the current stabilization phase and expose a deeper pullback toward the February 5 low at $77.60.

(The technical analysis of this story was written with the help of an AI tool.)

Disclaimer: For information purposes only. Past performance is not indicative of future results.
placeholder
XRP Whales Accused Of Manipulating Liquidity In Major Market MoveFresh accusations of market manipulation are surrounding XRP after a wave of unusual whale activity triggered sharp liquidity shifts across major exchanges. On-chain analysts claim that large XRP
Author  NewsBTC
19 hours ago
Fresh accusations of market manipulation are surrounding XRP after a wave of unusual whale activity triggered sharp liquidity shifts across major exchanges. On-chain analysts claim that large XRP
placeholder
Ethereum Cools Off Below $2,450 – Lower Leverage Sets The Stage For A BreakoutEthereum is testing resistance as the market heats up and buyers attempt to force a decisive break above the level that has capped the recovery for nearly a month. The price action is building toward
Author  NewsBTC
19 hours ago
Ethereum is testing resistance as the market heats up and buyers attempt to force a decisive break above the level that has capped the recovery for nearly a month. The price action is building toward
placeholder
Spot Solana ETFs post biggest inflows since February as traders eye $120 SOLSpot Solana ETFs recorded their biggest weekly inflows since February, bringing in about $39.23 million.
Author  Cryptopolitan
19 hours ago
Spot Solana ETFs recorded their biggest weekly inflows since February, bringing in about $39.23 million.
placeholder
Circle Q1 Earnings: $21.5 Trillion USDC Volume Fails to Stop 15% Profit Drop as Investors PanicCircle Internet Group (CRCL) reported a 263% surge in USD Coin (USDC) on-chain transaction volume to $21.5 trillion in Q1 2026, while net income from continuing operations fell 15% to $55 million.The
Author  Beincrypto
19 hours ago
Circle Internet Group (CRCL) reported a 263% surge in USD Coin (USDC) on-chain transaction volume to $21.5 trillion in Q1 2026, while net income from continuing operations fell 15% to $55 million.The
placeholder
MicroStrategy’s Latest Bitcoin Buy Is Its Smallest of 2026, and the Slowdown May Be StructuralMicroStrategy bought just 535 Bitcoin (BTC) between May 5 and May 11, its smallest weekly purchase of 2026 and the latest data point in a clear deceleration of corporate accumulation.The $43 million t
Author  Beincrypto
19 hours ago
MicroStrategy bought just 535 Bitcoin (BTC) between May 5 and May 11, its smallest weekly purchase of 2026 and the latest data point in a clear deceleration of corporate accumulation.The $43 million t
Related Instrument
goTop
quote