Nasdaq-100 Hits 100 Days Below Record High: Here’s What History Says Happens Next

Source Beincrypto

The Nasdaq-100 has dropped around 6.6% so far in 2026, yet recent signals suggest a recovery may not be far off.

Nasdaq-100 (NDX) Performance. 
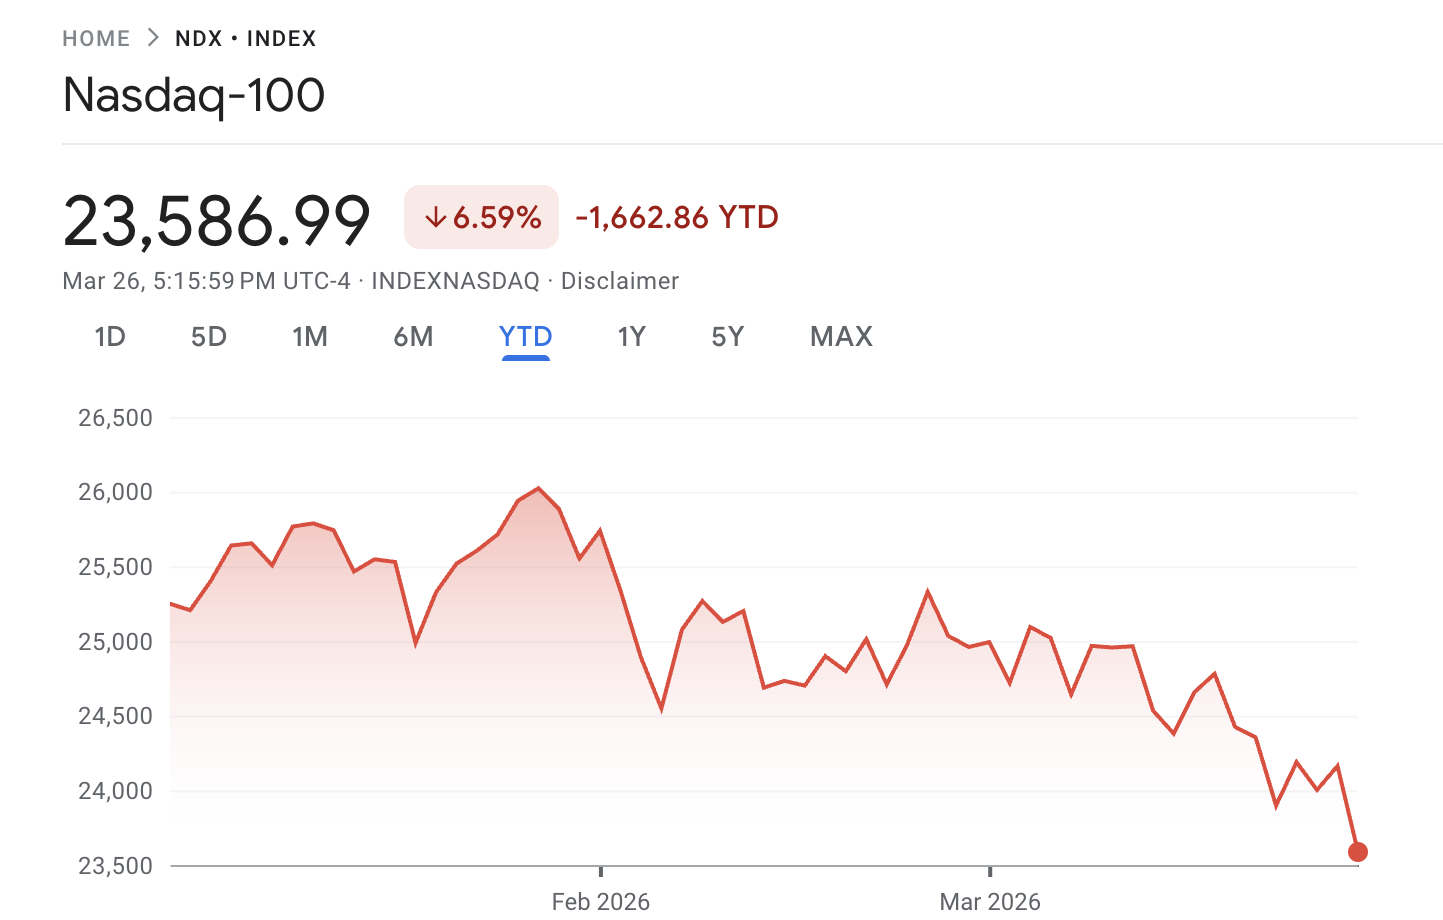
Nasdaq-100 (NDX) Performance. Source: Google Finance

The Kobeissi Letter highlighted that the index has spent 100 consecutive trading days below its all-time high, the longest such streak since 2023.

Moreover, the Nasdaq-100 remains within 10% of its peak, a pattern that has occurred only 6 times since 1985. The historical track record for this setup is notably bullish.

The post added that in the five prior instances, the index posted flat or positive returns 80% of the time after a month, averaging a gain of around 1.1%. At the two-month mark, the results were similar, positive 80% of the time with an average return of 2.3%. 

Most striking, the index was higher a year later in every single case, delivering an average gain of 17%.

“History suggests technology stocks are set to recover soon,” the post read.

Nasdaq-100 Historical Comparison
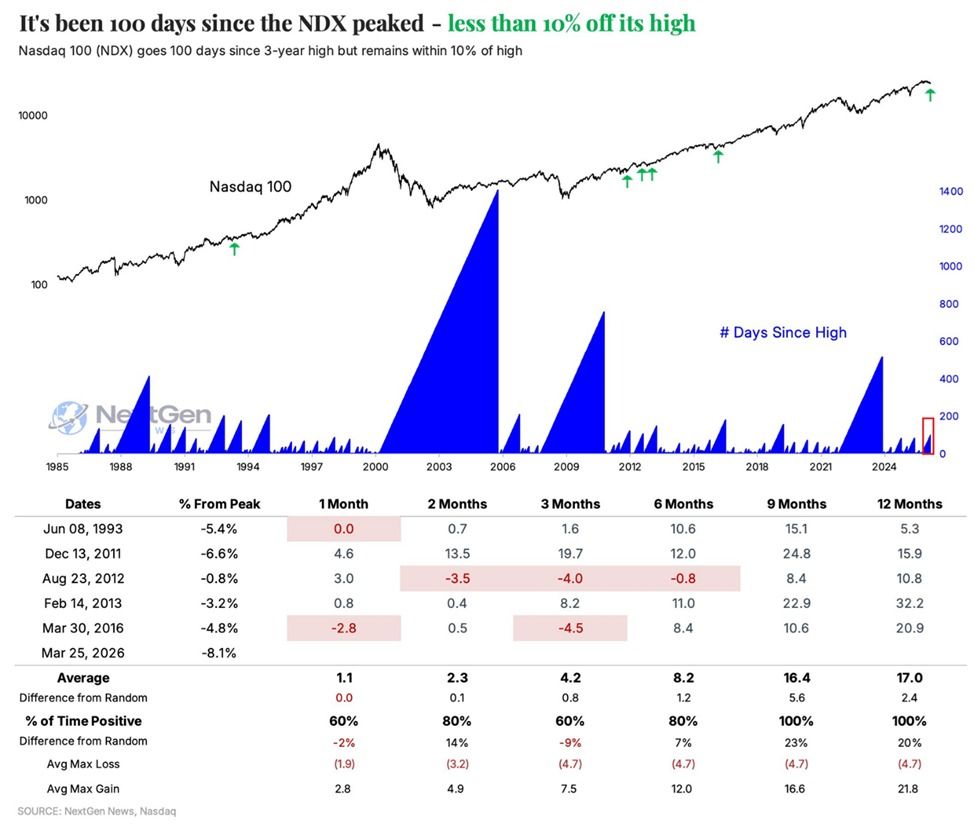
Nasdaq-100 Historical Comparison. Source: X/The Kobeissi Letter

Follow us on X to get the latest news as it happens

Pension Fund Inflows and Earnings Support

In a separate post, The Kobeissi Letter noted that Goldman Sachs estimates US pension funds will purchase $13.8 billion in equities by the end of the quarter. That figure exceeds 97% of all monthly purchases over the past three years and 93% of monthly buys since January 2000.

For context, pension funds have sold an average of $1.8 billion per month since 2000. The all-time high for monthly equity purchases was $80.6 billion in 2020, during the pandemic. 

“This comes as US pension funds are set to rebalance from bonds to equities to maintain target allocations after the recent decline in stocks. As a consequence, an equivalent amount of bonds will be sold to fund the purchases. Equities are set for large inflows,” the analysts said.

Meanwhile, Jurrien Timmer, Director of Global Macro at Fidelity, offered a supportive fundamental case. Timmer argued that the Magnificent 7 stocks, which represent a significant share of the index’s market capitalization, remain supported by strong earnings growth.

Thus, the catalysts are lining up, but whether historical patterns and institutional flows translate into a sustained rally remains to be seen.

Disclaimer: For information purposes only. Past performance is not indicative of future results.
placeholder
3 Altcoins To Watch In The Final Week Of March 2026Some altcoins are standing at technical and fundamental inflection points as March 2026 enters its final week. Each faces a near-term catalyst that could resolve their chart structures in one directio
Author  Beincrypto
Mar 24, Tue
Some altcoins are standing at technical and fundamental inflection points as March 2026 enters its final week. Each faces a near-term catalyst that could resolve their chart structures in one directio
placeholder
Ethereum Price’s Climb Above $2,500 Requires Crossing This “Red Circle”Ethereum (ETH) is trading at $2,187, recovering inside a rising channel after pulling back from a March high near $2,393. Two on-chain signals and a clear technical resistance zone now frame exactly w
Author  Beincrypto
Yesterday 02: 11
Ethereum (ETH) is trading at $2,187, recovering inside a rising channel after pulling back from a March high near $2,393. Two on-chain signals and a clear technical resistance zone now frame exactly w
placeholder
Gold’s 21% Fall Forms 106 Year Record While Bitcoin Stabilizes At $71,000Gold, the long-standing store of value, has recorded its worst consecutive losing streak in over a century. The yellow metal fell from $5,193 to $4,098 at its worst, a decline of nearly 21%, before re
Author  Beincrypto
Yesterday 02: 11
Gold, the long-standing store of value, has recorded its worst consecutive losing streak in over a century. The yellow metal fell from $5,193 to $4,098 at its worst, a decline of nearly 21%, before re
placeholder
Bittensor (TAO) Breaks Out Toward $600, but an 80% Long Bias Stands in the WayBittensor (TAO) price surged over 10% in the past 24 hours and 22% over the past week, extending a breakout from a cup and handle pattern on the daily chart.The rally is backed by fading sell-side pre
Author  Beincrypto
Yesterday 02: 12
Bittensor (TAO) price surged over 10% in the past 24 hours and 22% over the past week, extending a breakout from a cup and handle pattern on the daily chart.The rally is backed by fading sell-side pre
placeholder
Solana’s Golden Cross Faces a 16% Supply Exit That Could Derail the RallySolana (SOL) price rose over 5% since March 24, reclaiming the $92 zone as a potential golden cross takes shape on the 4-hour chart.However, on-chain data reveals that a key holder cohort has been qui
Author  Beincrypto
Yesterday 02: 13
Solana (SOL) price rose over 5% since March 24, reclaiming the $92 zone as a potential golden cross takes shape on the 4-hour chart.However, on-chain data reveals that a key holder cohort has been qui
goTop
quote