Pi Network Price Forecast: CEXs deposits, core team outflows weigh down on PI token

Source Fxstreet
  • Pi Network extends losses on Friday as bulls lose the tug-of-war near the 50-day EMA, following a roughly 3% decline the previous day.
  • PiScan data shows an increase in CEXs deposits and outflows from Pi Foundation wallets amid the second migration rollout.
  • The technical outlook for the PI token is bearish as selling pressure resurfaces.

Pi Network (PI) remains under bearish pressure, extending losses for the second straight day. Large deposits to Centralized Exchanges (CEXs) and outflows from Pi Foundation wallets over the last 24 hours suggest intense selling pressure during the second migration phase. The technical outlook for the PI token is bearish as selling pressure rises.

Available supply surge adds to selling pressure

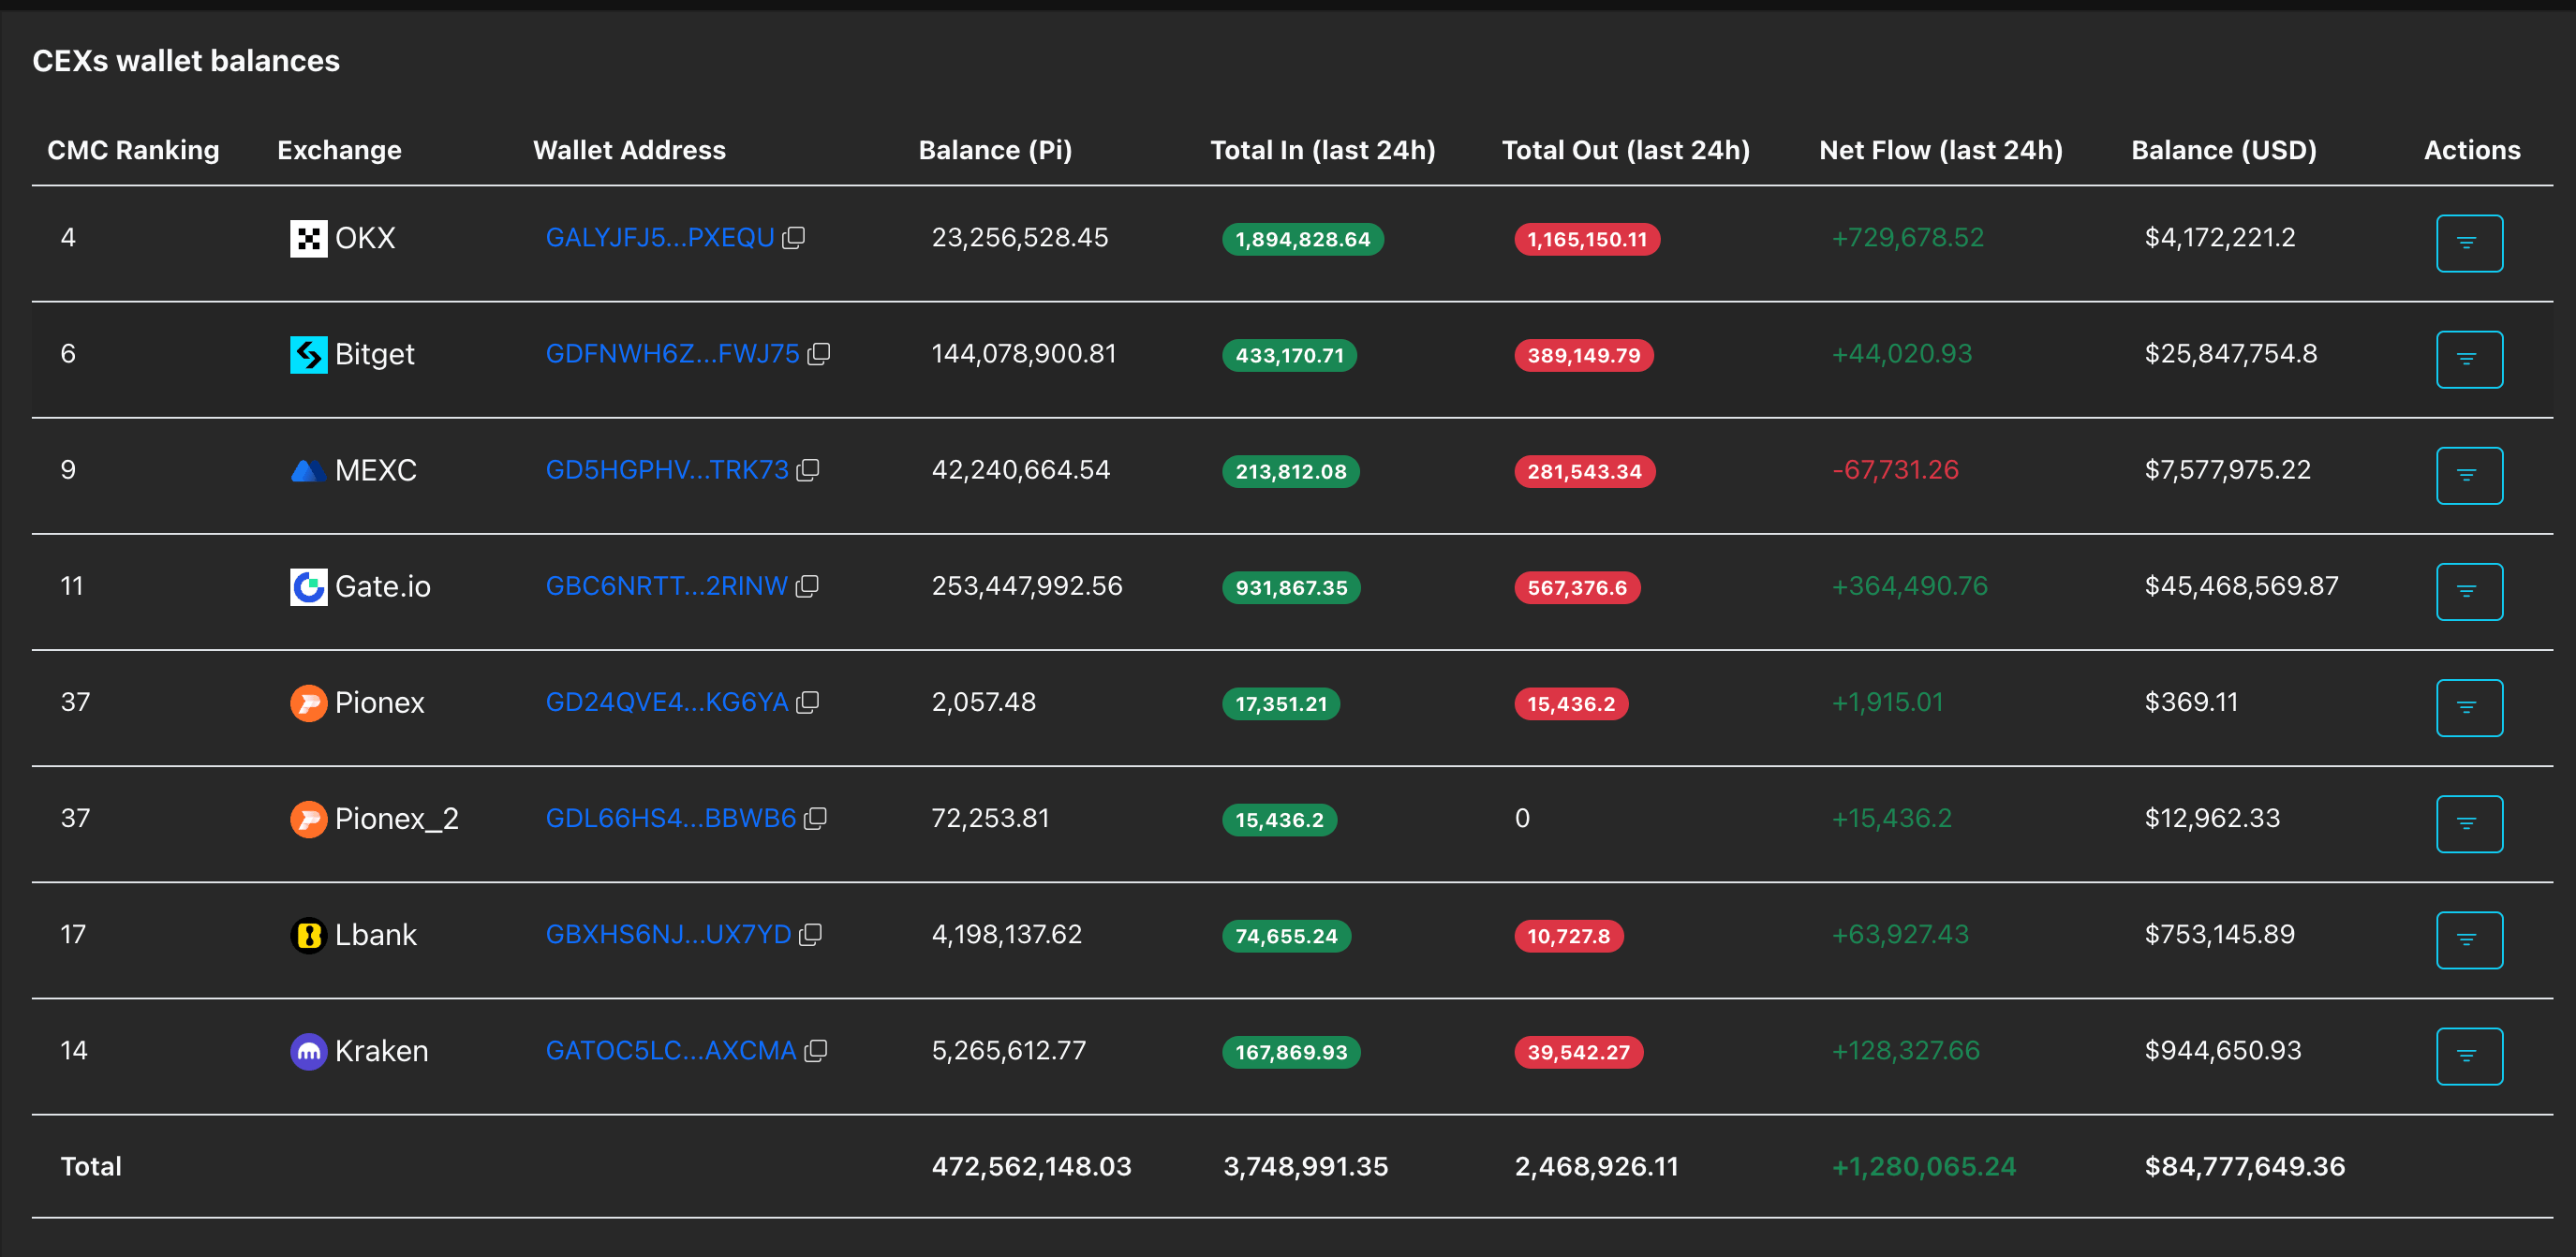
PiScan data shows 1.28 million PI tokens deposited to CEXs in the last 24 hours, led by 729,678 tokens from OKX and 364,490 tokens from Gate.io. Typically, an increase in deposits suggests rising selling pressure, which aligns with falling spot market prices. 

PI CEXs flow. Source: PiScan

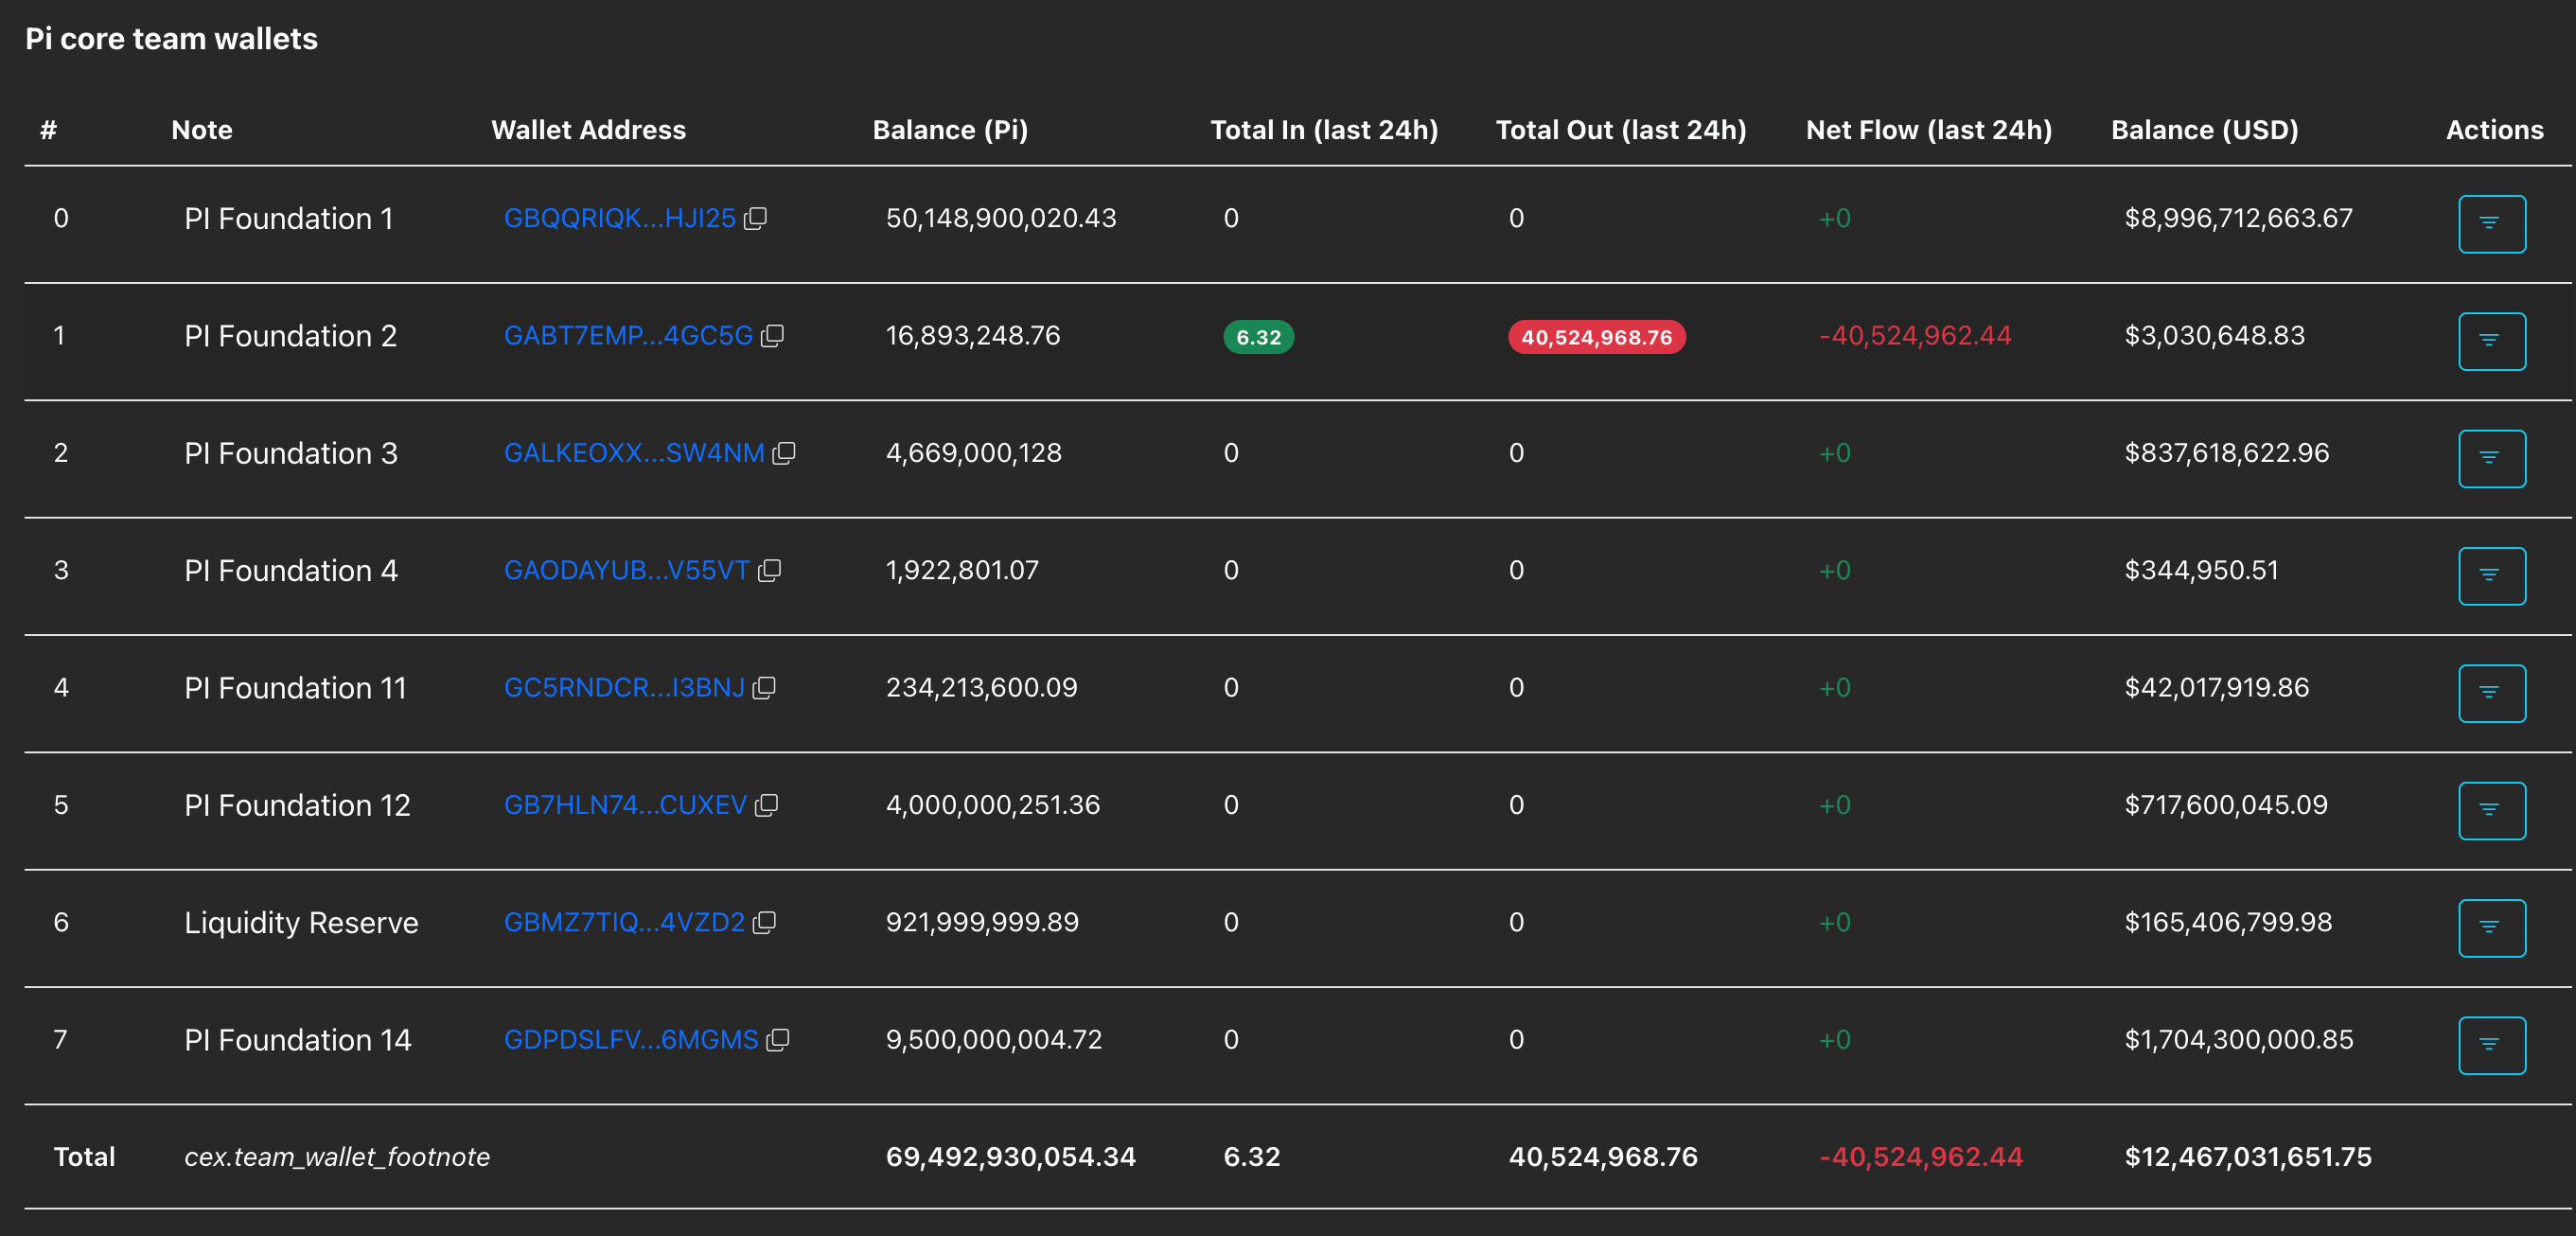
At the same time, the Pi core team offloaded 40.52 million PI tokens into the market, likely linked to the ongoing second migration rollout, allowing investors to transfer their PI holdings to the mainnet. This adds to the selling pressure, as Pi investors, commonly called Pioneers, remain anxious and take profits quickly due to a lack of a clear roadmap, delayed upgrades, and communication problems between the core team and Pioneers.

Pi core team wallets data. Source: PiScan

Steady deposits into CEXs and a supply dump from core team wallets could expose the mobile-mining cryptocurrency to a steeper downside. 

Technical outlook: Pi Network risks losing the near-term support

Pi Network loses strength as it extends losses below the 50-day Exponential Moving Average (EMA) at $0.1886. The near-term bias is cautiously bearish as the PI token now trades below the 50-, 100-, and 200-day EMAs, which still slope lower and cap the broader trend.

The Moving Average Convergence Divergence (MACD) histogram remains negative below the zero line, pointing to persistent selling pressure despite a modest improvement in recent sessions. The Relative Strength Index at 45 stays below the 50 midline, reinforcing a soft tone consistent with consolidation inside a broader downtrend.

The immediate support for PI token is at $0.1736, capping the downside risk to the February 23 low at $0.1556.

Chart Analysis PI/USD (baha Crypto)
PI/USDT daily price chart.

On the upside, the 50- and 100-day EMAs at $0.1886 and $0.1972, respectively, serve as crucial resistances.

(The technical analysis of this story was written with the help of an AI tool.)

Disclaimer: For information purposes only. Past performance is not indicative of future results.
placeholder
3 Altcoins To Watch In The Final Week Of March 2026Some altcoins are standing at technical and fundamental inflection points as March 2026 enters its final week. Each faces a near-term catalyst that could resolve their chart structures in one directio
Author  Beincrypto
Mar 24, Tue
Some altcoins are standing at technical and fundamental inflection points as March 2026 enters its final week. Each faces a near-term catalyst that could resolve their chart structures in one directio
placeholder
Ethereum Price’s Climb Above $2,500 Requires Crossing This “Red Circle”Ethereum (ETH) is trading at $2,187, recovering inside a rising channel after pulling back from a March high near $2,393. Two on-chain signals and a clear technical resistance zone now frame exactly w
Author  Beincrypto
Yesterday 02: 11
Ethereum (ETH) is trading at $2,187, recovering inside a rising channel after pulling back from a March high near $2,393. Two on-chain signals and a clear technical resistance zone now frame exactly w
placeholder
Gold’s 21% Fall Forms 106 Year Record While Bitcoin Stabilizes At $71,000Gold, the long-standing store of value, has recorded its worst consecutive losing streak in over a century. The yellow metal fell from $5,193 to $4,098 at its worst, a decline of nearly 21%, before re
Author  Beincrypto
Yesterday 02: 11
Gold, the long-standing store of value, has recorded its worst consecutive losing streak in over a century. The yellow metal fell from $5,193 to $4,098 at its worst, a decline of nearly 21%, before re
placeholder
Bittensor (TAO) Breaks Out Toward $600, but an 80% Long Bias Stands in the WayBittensor (TAO) price surged over 10% in the past 24 hours and 22% over the past week, extending a breakout from a cup and handle pattern on the daily chart.The rally is backed by fading sell-side pre
Author  Beincrypto
Yesterday 02: 12
Bittensor (TAO) price surged over 10% in the past 24 hours and 22% over the past week, extending a breakout from a cup and handle pattern on the daily chart.The rally is backed by fading sell-side pre
placeholder
Solana’s Golden Cross Faces a 16% Supply Exit That Could Derail the RallySolana (SOL) price rose over 5% since March 24, reclaiming the $92 zone as a potential golden cross takes shape on the 4-hour chart.However, on-chain data reveals that a key holder cohort has been qui
Author  Beincrypto
Yesterday 02: 13
Solana (SOL) price rose over 5% since March 24, reclaiming the $92 zone as a potential golden cross takes shape on the 4-hour chart.However, on-chain data reveals that a key holder cohort has been qui
goTop
quote