


Pi Coin Recovery Rally Failed, Is There Any Hope for the Altcoin?
Pi Network (PI) is trading around $0.20 on March 21, 2026, attempting to recover from a sharp 35.74% decline that began on March 13 after a local peak near $0.2700.
However, momentum indicators suggest the rebound may struggle to sustain itself. Two technical signals point to continued selling pressure despite the modest daily bounce of roughly 4.43%.
Pi Coin Faces Pressure
The Squeeze Momentum indicator currently reads -0.0241, the most negative reading visible across the entire September 2025 to March 2026 price history shown on the chart.
The histogram bars have flipped deep red and continue to extend downward. This signals that bearish momentum for Pi Coin is accelerating, not decelerating. The black dots above the zero line on the squeeze band indicate the squeeze has fired to the downside.
Want more token insights like this? Sign up for Editor Harsh Notariya’s Daily Crypto Newsletter here.
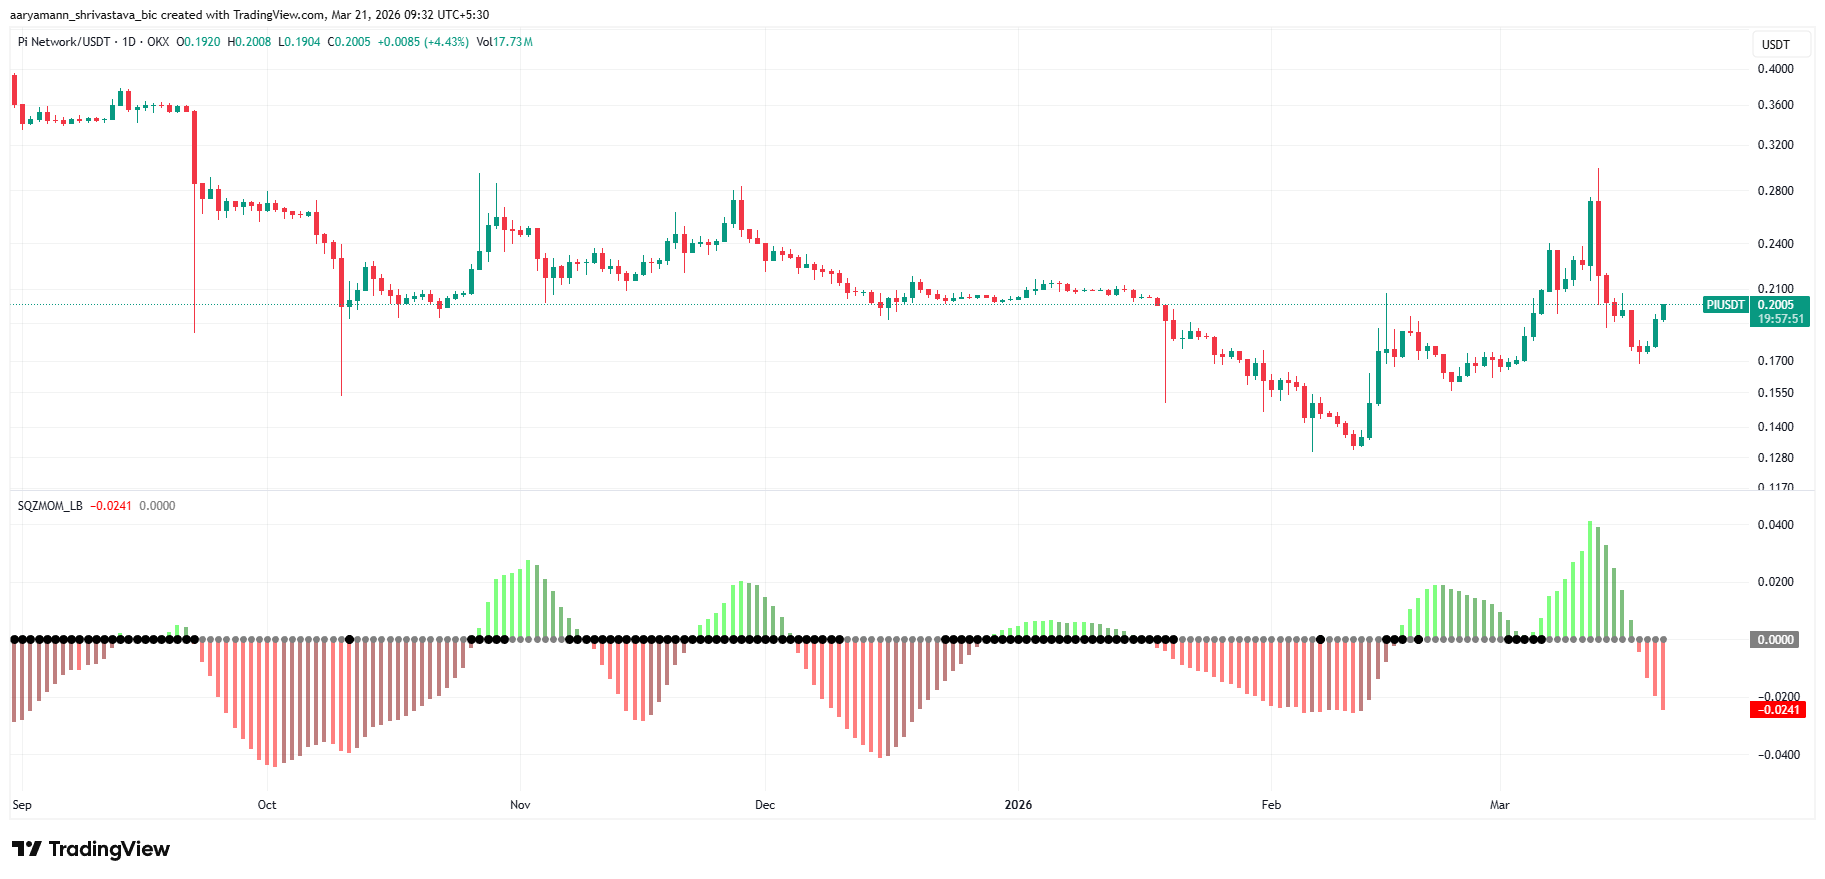 Pi Coin Squeeze Momentum Indicator. Source: TradingView
For the signal to flip bullish, the red bars would need to shorten and turn green. That has not happened yet. Until SQZMOM crosses back above zero, any price bounce risks being absorbed by persistent selling momentum.
Buying Pressure Dissipates
Despite the bearish Squeeze Momentum picture, the Money Flow Index (MFI) chart tells a more nuanced story. MFI peaked above 84 around March 11-12, reaching deeply overbought territory, just before Pi Coin price sell-off began.
The current MFI reading of 42.34 sits between the 20 oversold and 80 overbought thresholds, placing it in neutral territory. The decline from 84 to 42.34 in roughly 10 days reflects a sharp unwinding of buyer pressure that coincided with the 35% price drop.
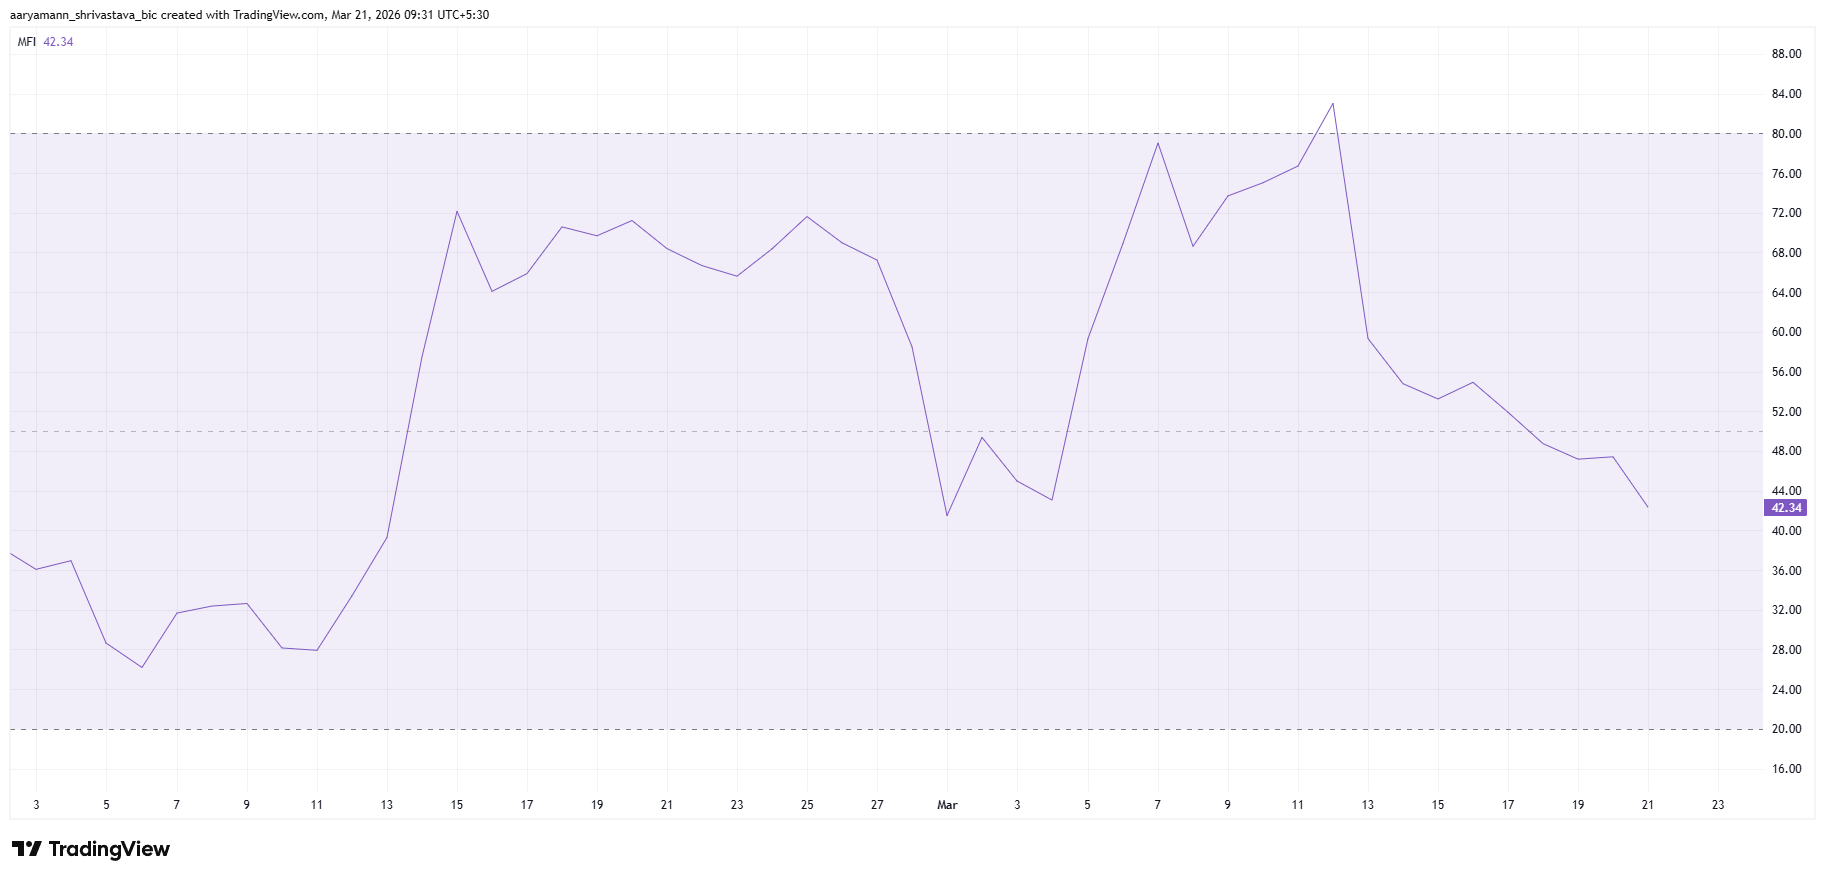 Pi Coin MFI. Source: TradingView
The MFI’s current neutral zone position means the indicator does not yet support a strong buy signal. A further decline toward the 20 level would signal genuine oversold conditions and could attract fresh buyers. However, the speed of the drop from overbought to neutral suggests capital outflows remain significant.
PI Price Has a Long Way To Go
The daily price chart shows PI trading near $0.1992 after an annotated 35.74% decline measuring -0.0971 from the March 13 high. Fibonacci retracement levels are plotted from the February swing low at $0.1600 to the March 13 peak near $0.2700.
PI currently hovers just above the 0.786 Fibonacci level at $0.1907. This is the critical support zone. A daily close below $0.1907 would expose the next level at 0.618, which sits at $0.1779.
Below that, the 0.382 level near $0.1600 aligns with the swing low and represents the maximum downside target within the current measured structure.
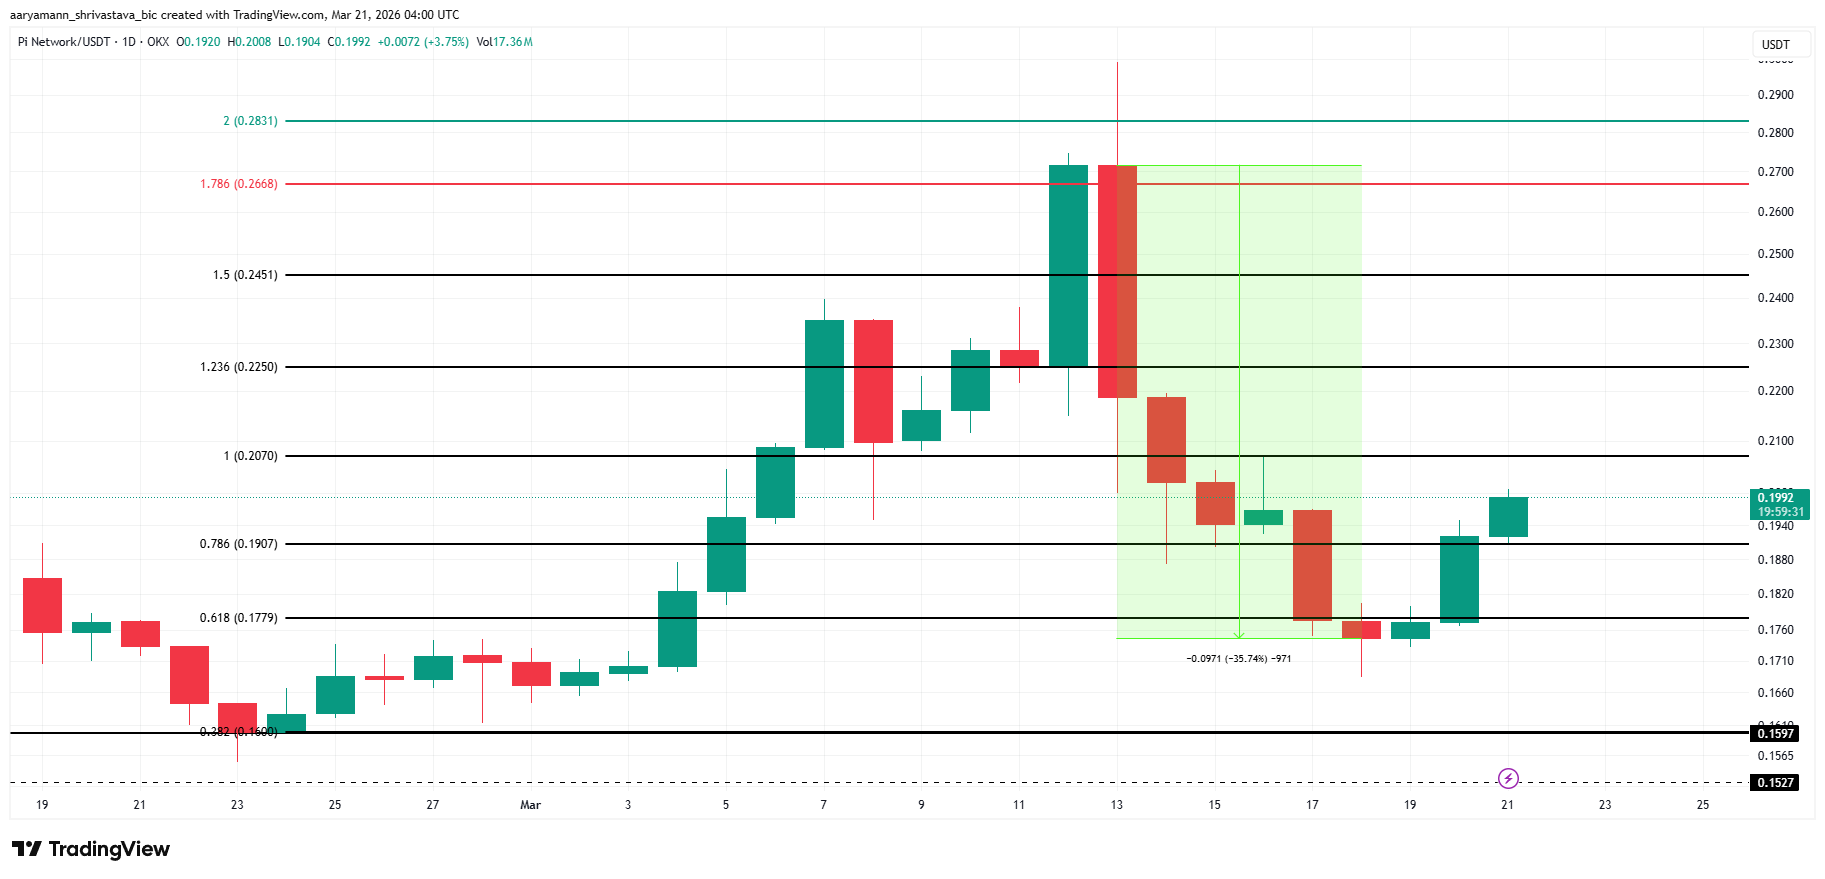 Pi Coin Price Analysis. Source: TradingView
On the upside, a sustained move back above the 1.0 level at $0.2070 would signal that the correction is over. The 1.236 level at $0.2250 and the 1.786 level at $0.2668 serve as the two key resistance levels bulls must reclaim to invalidate the bearish thesis.
The Kraken listing of PI on March 13, 2026, coincided with the price peak, and the subsequent Protocol 20 upgrade provided only limited upside amid macro pressure weighing on the broader market.
If selling from newly liquid token holders continues, the $0.1907 level may not hold. A confirmed bounce and a close above $0.2070, with improving MFI, would be the clearest signal that PI’s recovery has a real footing.
Recommended Articles


