


Silver Price Forecast: XAG/USD plunges, clearing key levels below $70
- Silver plunges below 100-day SMA, accelerating selloff toward six-week lows.
- RSI dives toward oversold territory, signaling strong bearish momentum persists.
- Recovery requires reclaiming $70.00 and 100-day SMA to stabilize prices.
Silver price (XAG/USD) retreats late in the North American session, down by over 6.80% in the day, poised to finish the week with losses of more than 15.70%, posting its second-largest weekly loss since the one that ended down 17.39% on January 30. At the time of writing, XAG/USD trades at $67.89.
XAG/USD Price Forecast: Technical Outlook
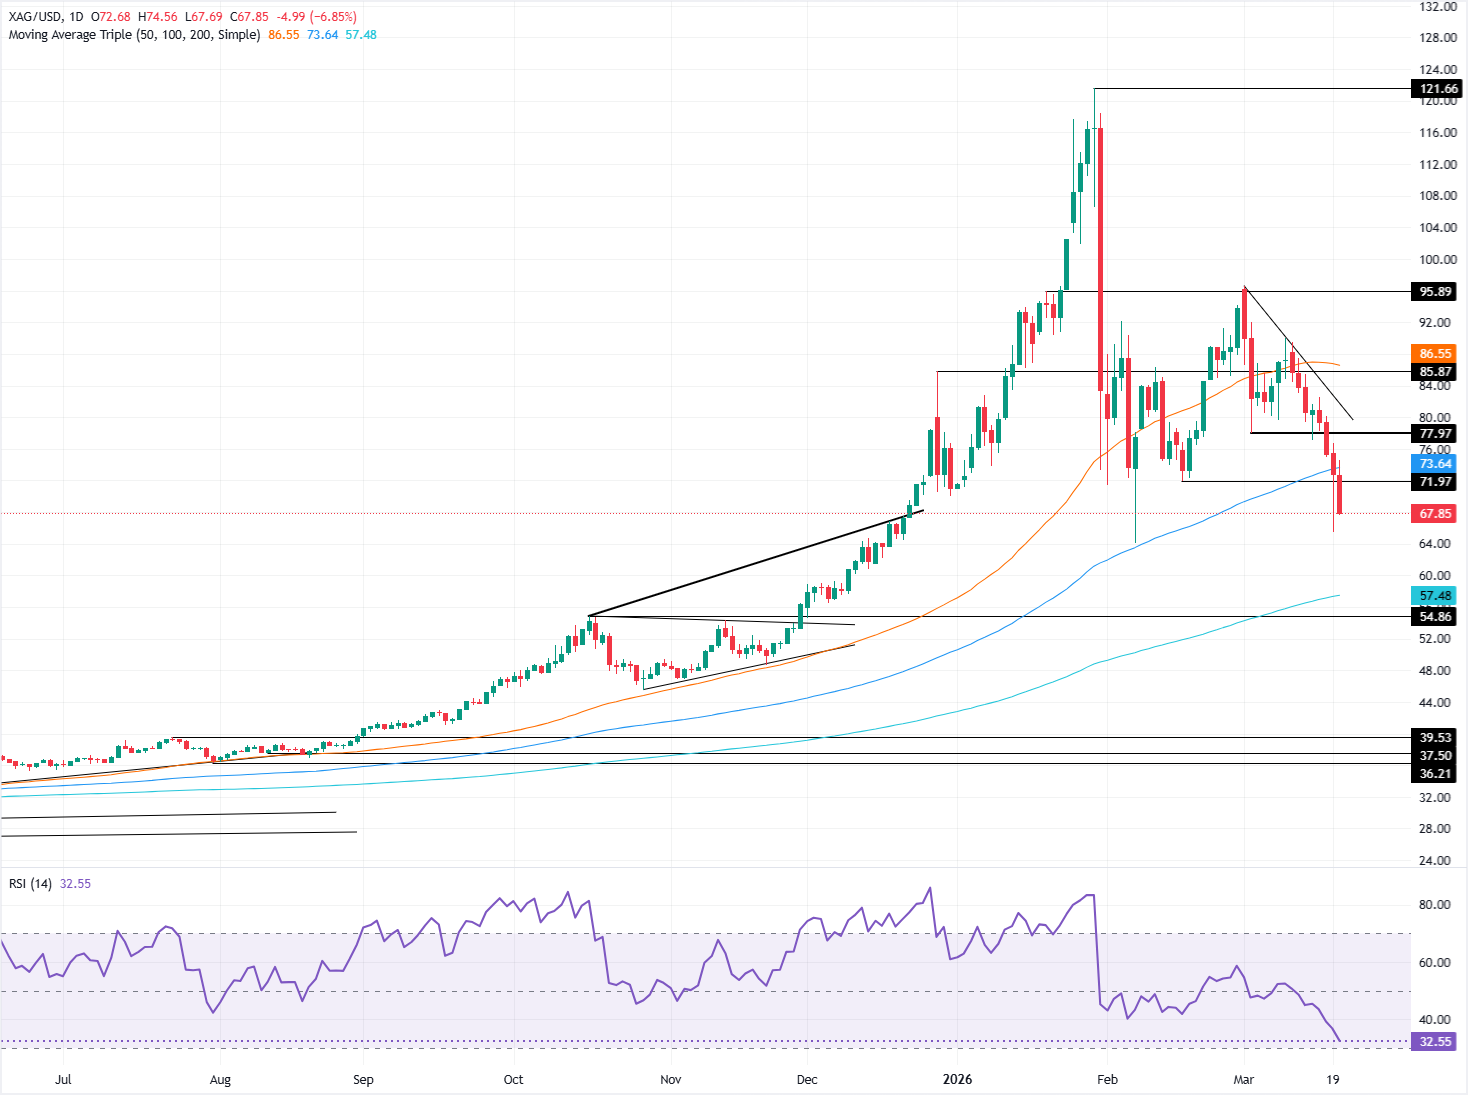
Although turned bearish this week, Silver remains upward biased as long as the bulls keep spot prices above the February 6 swing low of $64.10. In the short term, XAG/USD turned negative after falling below the 100-day SMA at $72.55, which exacerbated a drop below $70.00, towards a six-week low of $65.52.
Nevertheless, in the medium term, the market structure has respected the successive series of higher lows and higher highs, keeping the bulls in the driver’s seat.
Momentum notably favours sellers, as evidenced by the Relative Strength Index (RSI), which pierced its neutral level and fell sharply toward oversold territory. A drop below the RSI’s 30 level and a quick jump back above it could open the door to form a bottom, IF the RSI consolidates steadily, registering higher peaks and troughs.
For a bull market recovery, XAG/USD needs to reclaim $70.00 and the 100-day SMA. Once surpassed, the next stop is the cycle low-turned-resistance at $77.98, the March 3 daily low.
XAG/USD Price Chart – Daily
Silver FAQs
Silver is a precious metal highly traded among investors. It has been historically used as a store of value and a medium of exchange. Although less popular than Gold, traders may turn to Silver to diversify their investment portfolio, for its intrinsic value or as a potential hedge during high-inflation periods. Investors can buy physical Silver, in coins or in bars, or trade it through vehicles such as Exchange Traded Funds, which track its price on international markets.
Silver prices can move due to a wide range of factors. Geopolitical instability or fears of a deep recession can make Silver price escalate due to its safe-haven status, although to a lesser extent than Gold's. As a yieldless asset, Silver tends to rise with lower interest rates. Its moves also depend on how the US Dollar (USD) behaves as the asset is priced in dollars (XAG/USD). A strong Dollar tends to keep the price of Silver at bay, whereas a weaker Dollar is likely to propel prices up. Other factors such as investment demand, mining supply – Silver is much more abundant than Gold – and recycling rates can also affect prices.
Silver is widely used in industry, particularly in sectors such as electronics or solar energy, as it has one of the highest electric conductivity of all metals – more than Copper and Gold. A surge in demand can increase prices, while a decline tends to lower them. Dynamics in the US, Chinese and Indian economies can also contribute to price swings: for the US and particularly China, their big industrial sectors use Silver in various processes; in India, consumers’ demand for the precious metal for jewellery also plays a key role in setting prices.
Silver prices tend to follow Gold's moves. When Gold prices rise, Silver typically follows suit, as their status as safe-haven assets is similar. The Gold/Silver ratio, which shows the number of ounces of Silver needed to equal the value of one ounce of Gold, may help to determine the relative valuation between both metals. Some investors may consider a high ratio as an indicator that Silver is undervalued, or Gold is overvalued. On the contrary, a low ratio might suggest that Gold is undervalued relative to Silver.
Recommended Articles


