


Cardano Price at This Level Could Trigger $10 Million Long Squeeze
Cardano (ADA) is trading near $0.264 on March 21, sitting just above a dense liquidation cluster that could force $9.93 million in long positions to unwind if the price slides 4% to $0.253.
On-chain data shows the network’s realized losses have contracted sharply from their March lows, suggesting the worst of the capitulation phase may be behind ADA — but the derivatives setup below current price still poses a near-term risk.
Cardano Sellers Remain in Control
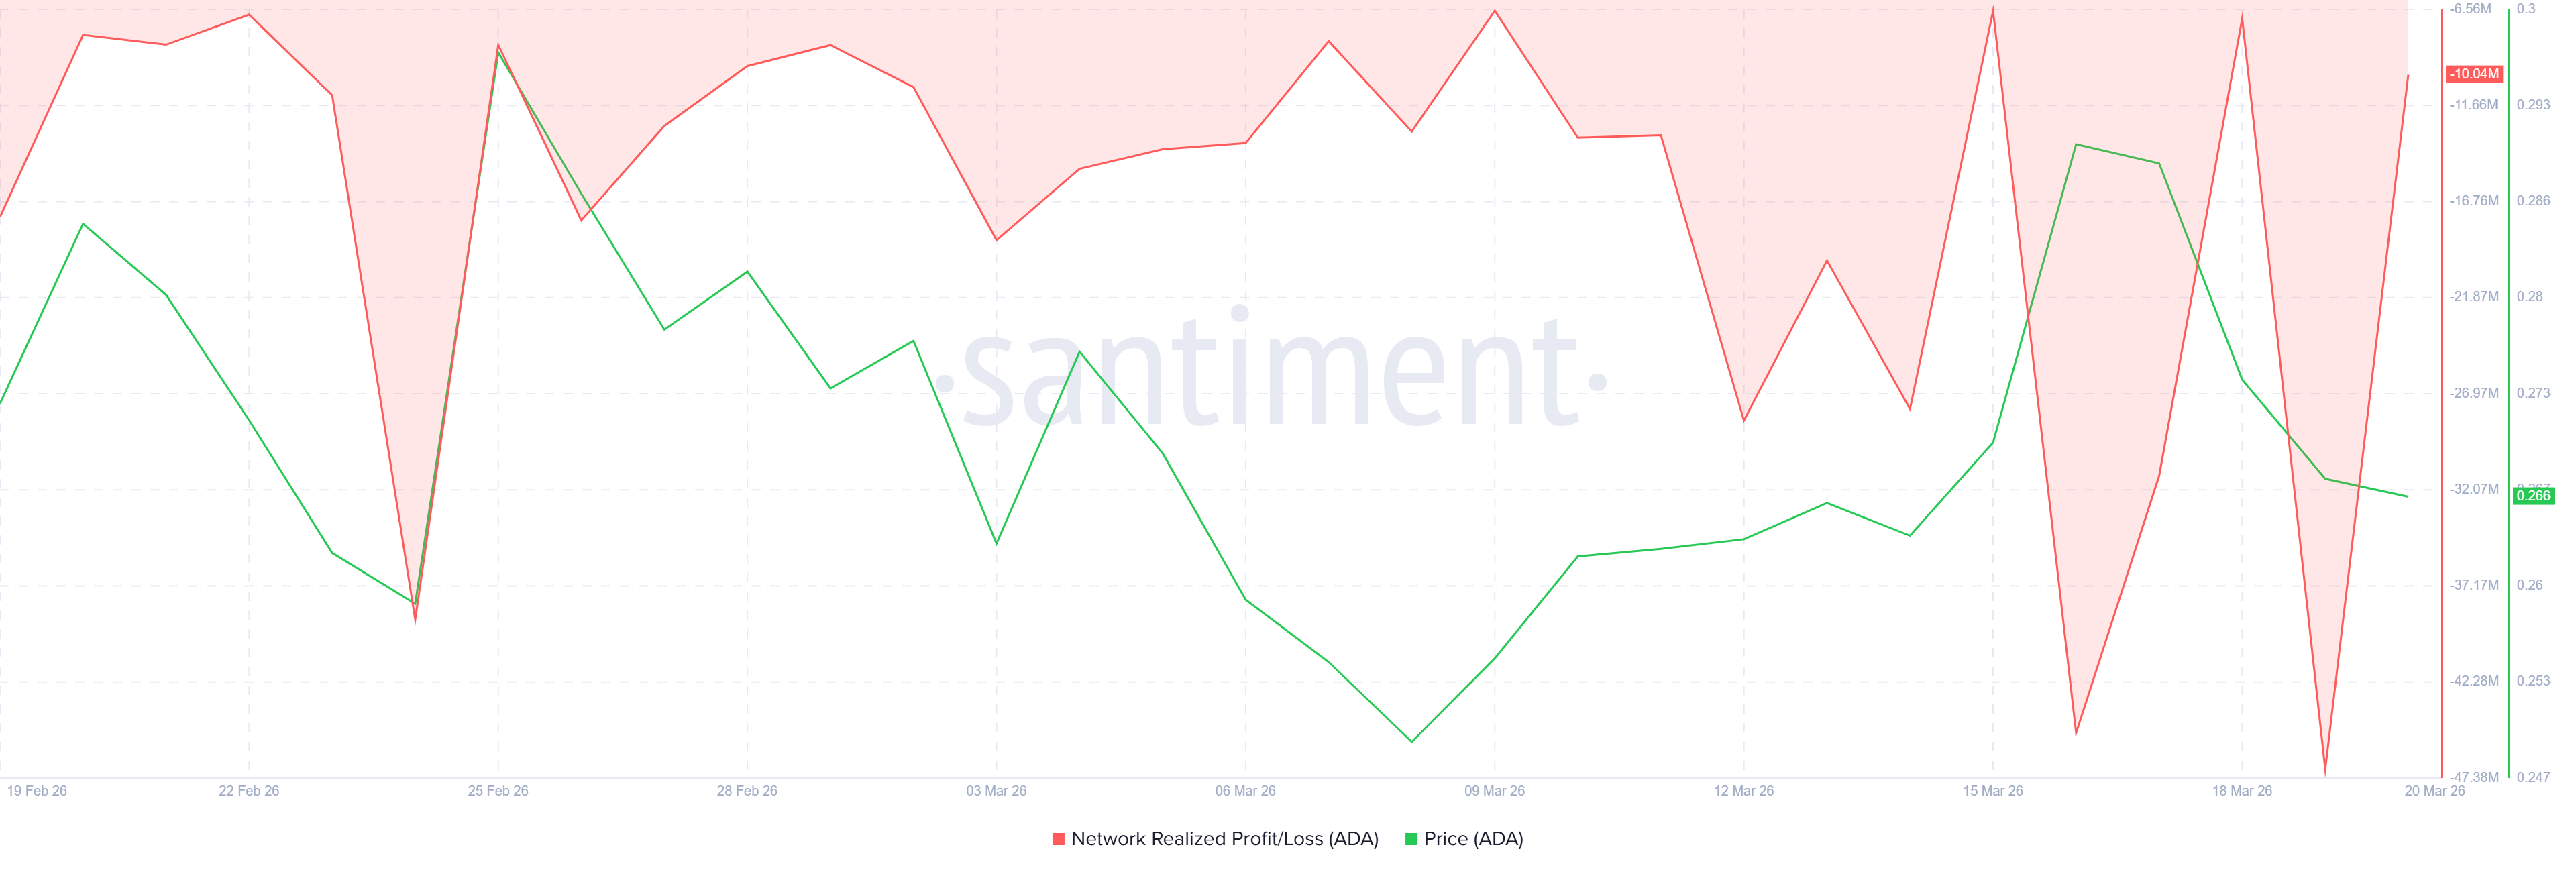
Santiment data covering February 19 through March 20 shows Cardano’s Network Realized Profit/Loss metric has been negative throughout the entire period, with losses denominated in ADA on the right axis ranging from approximately -6.56 million to -47.38 million ADA.
The deepest trough occurred around March 8, when net realized losses hit approximately -44.28 million ADA. That reading coincided with the price chart’s cycle low, where ADA touched $0.2547 on the TradingView daily chart. Since then, the loss metric has recovered substantially.
As of March 20–21, the reading sits at -10.04 million ADA — the shallowest loss reading since before February 22. That contraction from -44 million to -10 million represents a roughly 77% reduction in the volume of on-chain losses being realized.
Want more token insights like this? Sign up for Editor Harsh Notariya’s Daily Crypto Newsletter here.
 Cardano Realized Profit/Loss. Source: Santiment
However, the metric has not yet crossed into positive territory. Until realized profits consistently exceed realized losses, the network remains in a state of net distribution, and sustained price recovery is difficult to achieve.
Those holders are realizing losses rather than profits, which historically suppresses buying conviction and creates continued downside pressure until capitulation clears the market.
Long Cardano Traders At Risk?
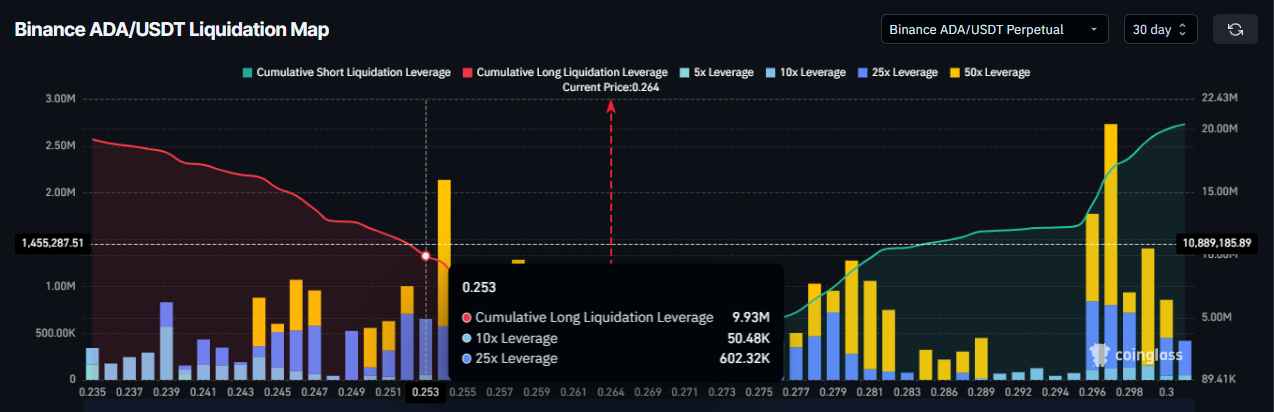
The Liquidation Map shows a concentrated long liquidation build-up starting at $0.275 and accelerating into the $0.253 level. At $0.254 exactly, cumulative long liquidation leverage reaches $9.93 million.
Short liquidation leverage is stacked on the other side of the current price, building from $0.277 upward to approximately $20.89 million cumulative at $0.300.
This structure reveals a classic liquidity pinch. Cardano price at $0.264 sits between two competing liquidation pools, but the nearer and more immediately accessible pool is the $0.253 long cluster below.
 Cardano Liquidation Map. Source: Coinglass
Market makers and larger participants frequently target such clusters. A move to $0.253 would not require a major breakdown — just a 4.1% decline from current levels.
Meanwhile, clearing the short-side liquidity above $0.277 requires a 4.9% rally and a sustained close above the $0.2856 resistance level that has capped every recent bounce.
ADA Price Resistance Zone Denies Breakout
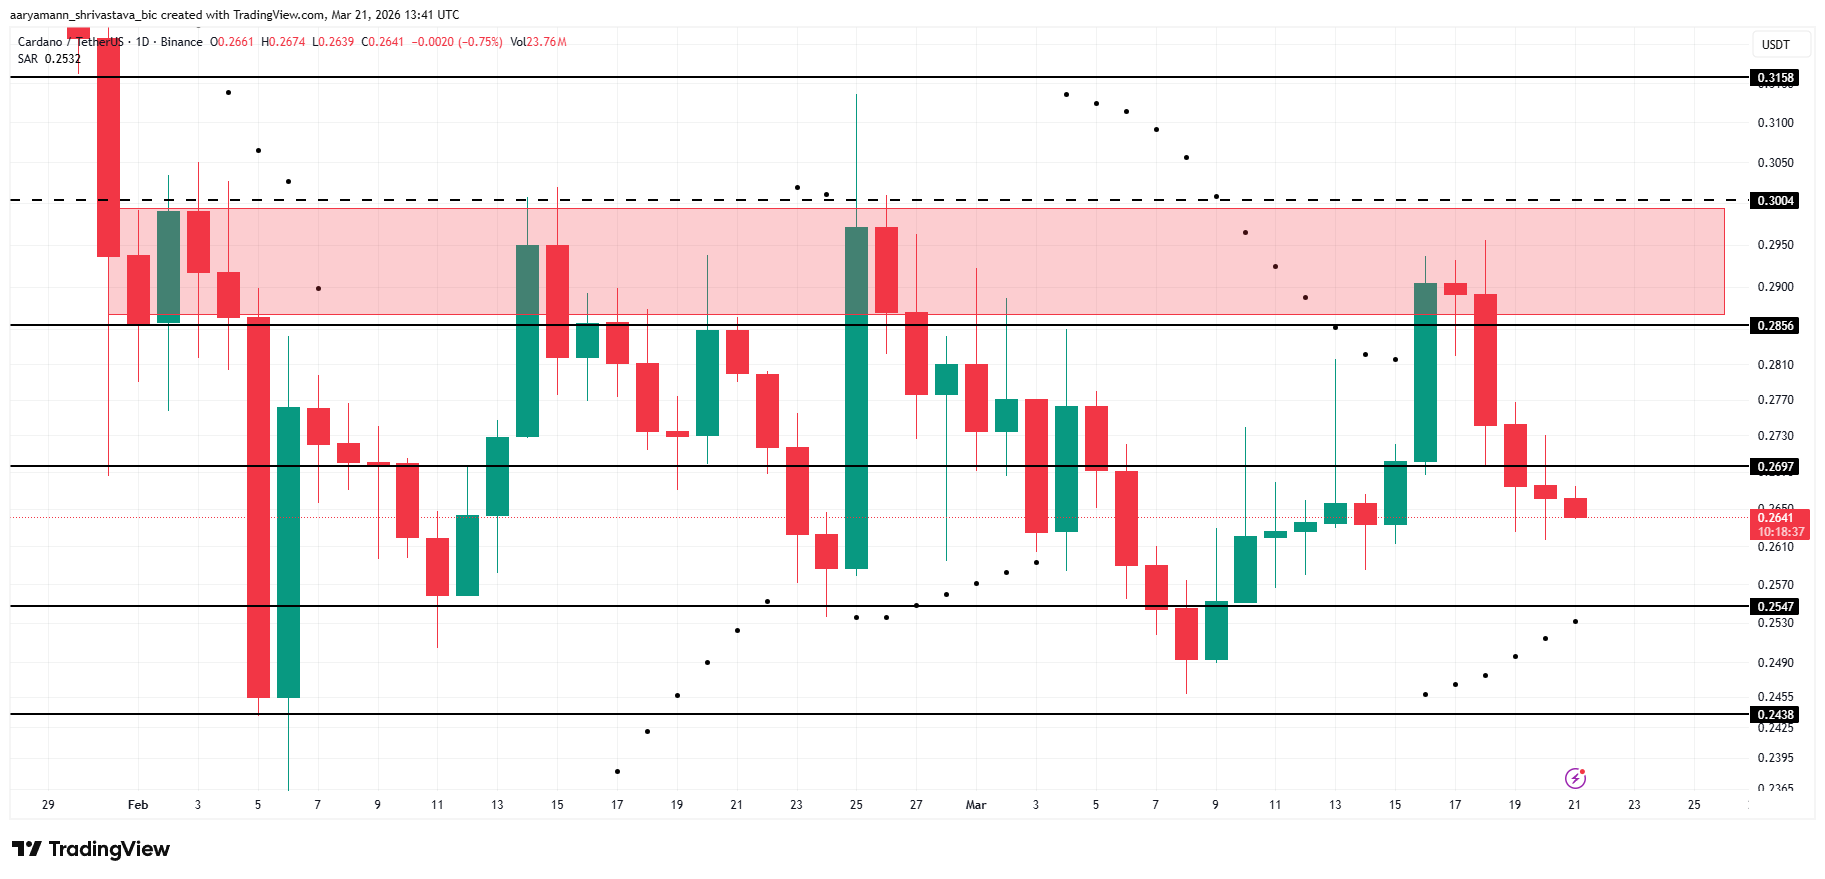
Cardano’s price is at $0.2641, with the Parabolic SAR dot sitting at $0.2532 — below the current price, confirming the indicator is currently in a short-term bullish phase. However, price sits inside a defined resistance zone (shaded red) that spans from $0.2856 to $0.3004.
Every rally into this zone since late January has failed. The most recent attempt, from March 15 to March 17, took ADA from $0.2697 to $0.2920, only for a two-candle reversal to push the price back below $0.2856. That level is now confirmed resistance.
 Cardano Price Analysis. Source: TradingView
Below the current ADA price, $0.2697 is the first horizontal support. Below that, $0.2547, then $0.2438, represent the next visible floors.
The liquidation map’s $0.253 target sits neatly between $0.2547 and $0.2438, meaning a sweep of the long cluster would not necessarily represent a catastrophic breakdown — but it would likely test $0.2438 next.
For bulls, the scenario that avoids a squeeze requires a clean daily close above $0.2856, which would flip the resistance zone into support and open the path toward $0.3004 and eventually $0.3158. The Parabolic SAR at $0.2532 would need to hold as a floor for that scenario to develop.
Recommended Articles


