


Bitcoin Price Forecast: BTC range-bound under pressure amid hawkish FOMC minutes, US-Iran geopolitical tension
- Bitcoin price is nearing the lower consolidation range at $65,729 on Thursday.
- Less dovish FOMC Minutes, alongside US-Iran geopolitical tension, weigh on risky assets.
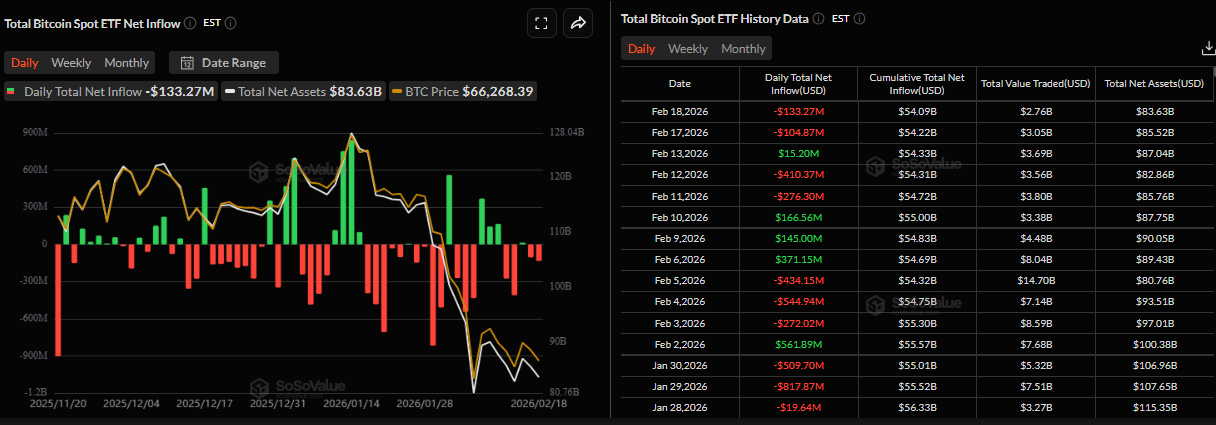
- US-listed spot ETFs recorded an outflow of $133.27 million on Wednesday.
Bitcoin (BTC) is approaching the lower consolidation range at $65,759 at the time of writing on Thursday, where a firm close below this level whould suggest a deeper correction. Wednesday’s hawkish Federal Open Market Committee (FOMC) Minutes, alongside rising geopolitical tension between the US and Iran, dampened risk appetite and pressured risky assets. In addition, institutional demand for the Crypto King has continued to wane so far this week, failing to support its price.
FOMC’s less dovish tone dampened risk appetite
The Minutes from the FOMC’s January meeting showed on Wednesday that policymakers were deeply divided over the necessity and timing of further rate cuts amid concerns about inflation.
In fact, several Federal Reserve (Fed) officials indicated that more rate cuts could be warranted if inflation declines as expected, while others cautioned that easing too early could compromise the central bank’s 2% inflation target.
The cautiously balanced, rather than dovish, continue to support the US Dollar (USD), with the US Dollar Index (DXY) hitting an over two-week high at $97.69 on Wednesday. The less dovish FOMC Minutes dampened risk appetite, pressuring risky assets, with Bitcoin (BTC) falling below $67,000 that day.
Rising geopolitical tension weighs on risky assets
Apart from a hawkish tilt by the US central bank, the US military is ready for possible strikes on Iran as soon as Saturday, CBS reported on Wednesday.
Nonetheless, US President Donald Trump has yet to make a final decision on whether to carry out an attack. Trump has repeatedly demanded that Iran cease its nuclear program and has warned that he intends to use force if no deal is reached.
The source said that the USS Abraham Lincoln aircraft carrier group and its flotilla of warships are already in the region. The USS Gerald Ford, a second carrier group, is en route to the Middle East.
Meanwhile, the third round of US-mediated negotiations between Ukraine and Russia concluded in Geneva on Wednesday without any major breakthrough. This underscores that substantive disagreements remain over the status of eastern Ukrainian territories occupied by Russian forces.
These rising geopolitical risks, in combination with tighter monetary policy expectations, are triggering a risk-off tone in the market, with safe-haven assets such as Gold (XAU) rising above $5,000 while risky assets such as BTC trading below $67,000 on Thursday.
Institutional demand continues to fade
Institutional demand continues to wane so far this week. SoSoValue data show that spot ETFs recorded an outflow of $133.27 million on Wednesday, marking the second consecutive day of withdrawals this week. If this trend continues and intensifies, BTC could see further correction.
Bitcoin Price Forecast: BTC could deepen its correction if it closes below support zone
Bitcoin price has been consolidating within a range between $65,729 and $71,746 since February 7. BTC declines 2.67% so far this week and, as of Thursday, is trading around $67,000 and approaching the lower consolidation boundary.
If BTC closes below the lower consolidation level at $65,729 on a daily basis, it could extend the decline toward the key support level at $60,000.
The Relative Strength Index (RSI) on the daily chart reads 34, below the neutral level of 50 and pointing downward toward the oversold levels, indicating bearish momentum gaining traction.
However, the Moving Average Convergence Divergence (MACD) showed a bullish crossover on Sunday, which remains in place, suggesting that upside bias has not been invalidated yet.
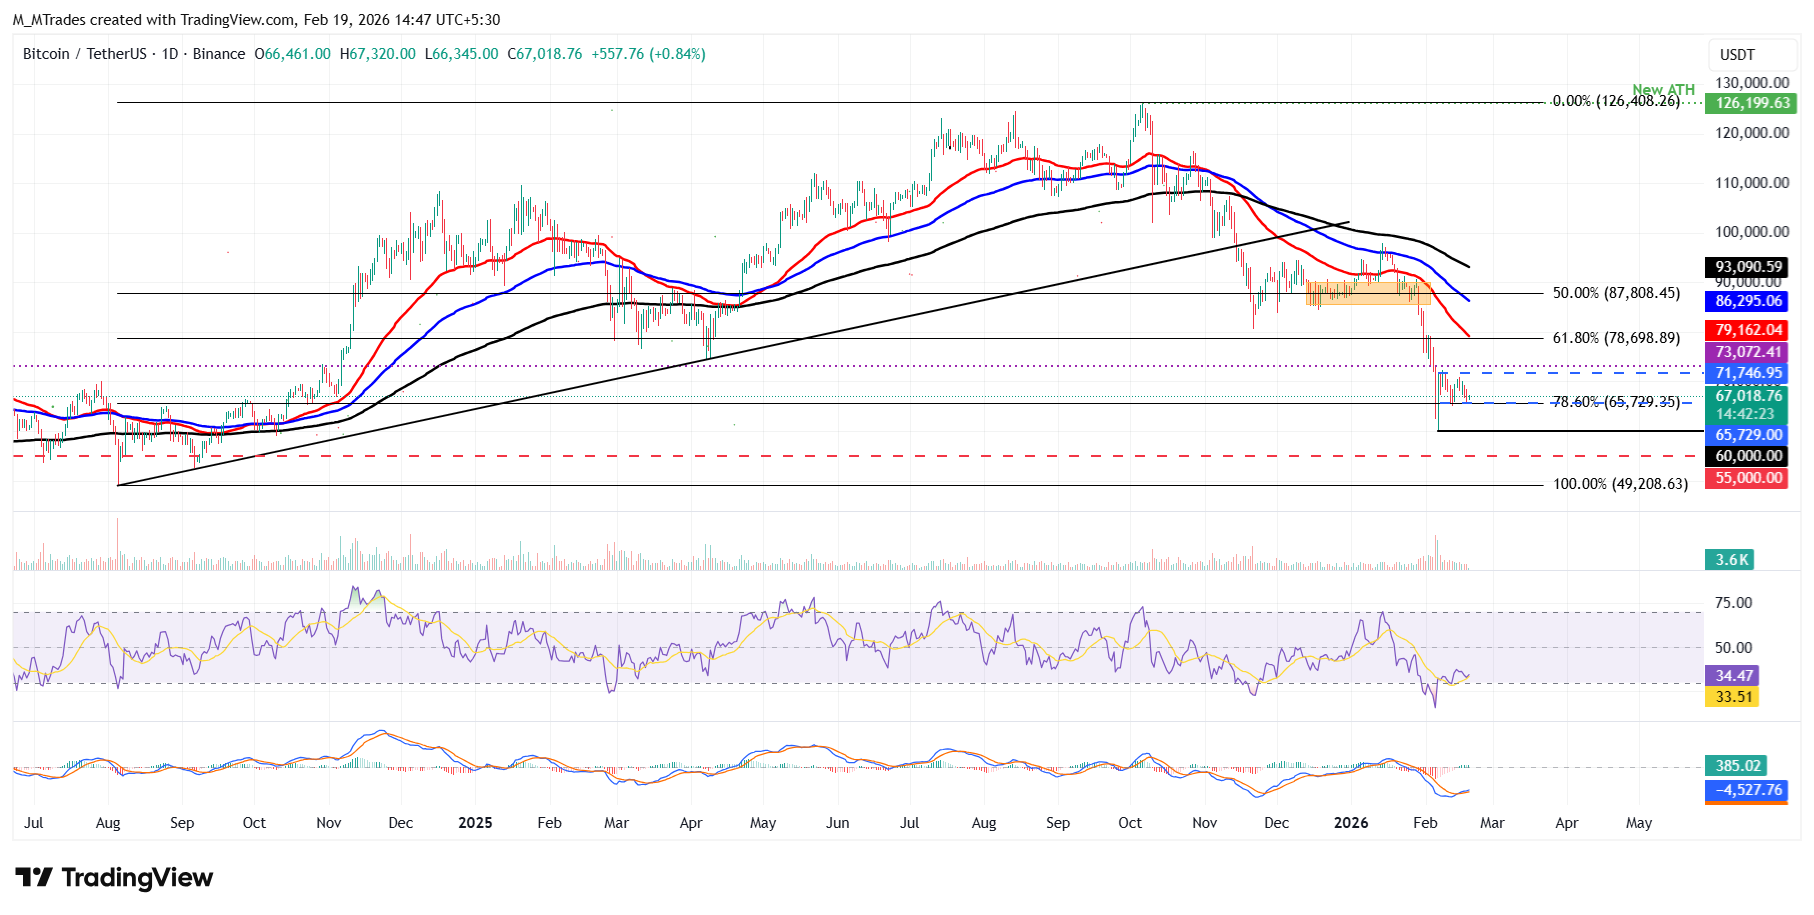
On the other hand, if BTC breaks above the upper consolidation range at $71,746 on a daily basis, it could extend the recovery toward the daily resistance at $73,072.
Bitcoin, altcoins, stablecoins FAQs
Bitcoin is the largest cryptocurrency by market capitalization, a virtual currency designed to serve as money. This form of payment cannot be controlled by any one person, group, or entity, which eliminates the need for third-party participation during financial transactions.
Altcoins are any cryptocurrency apart from Bitcoin, but some also regard Ethereum as a non-altcoin because it is from these two cryptocurrencies that forking happens. If this is true, then Litecoin is the first altcoin, forked from the Bitcoin protocol and, therefore, an “improved” version of it.
Stablecoins are cryptocurrencies designed to have a stable price, with their value backed by a reserve of the asset it represents. To achieve this, the value of any one stablecoin is pegged to a commodity or financial instrument, such as the US Dollar (USD), with its supply regulated by an algorithm or demand. The main goal of stablecoins is to provide an on/off-ramp for investors willing to trade and invest in cryptocurrencies. Stablecoins also allow investors to store value since cryptocurrencies, in general, are subject to volatility.
Bitcoin dominance is the ratio of Bitcoin's market capitalization to the total market capitalization of all cryptocurrencies combined. It provides a clear picture of Bitcoin’s interest among investors. A high BTC dominance typically happens before and during a bull run, in which investors resort to investing in relatively stable and high market capitalization cryptocurrency like Bitcoin. A drop in BTC dominance usually means that investors are moving their capital and/or profits to altcoins in a quest for higher returns, which usually triggers an explosion of altcoin rallies.
Recommended Articles


