


Why Is Gold Plunging? Gold Prices Fall Below $4,300, Strong Nonfarm Payrolls and Rising Oil Prices Open Downside Space
TradingKey - During the European session on June 8, gold ( XAUUSD) extended its downward trend, falling below $4,300 at one point during the day and hitting a low of $4,268.53. Technical analysis indicates that further downside room for gold prices has opened up, with a potential decline toward $4,100.
Why are gold prices plunging?
From a fundamental perspective, the catalyst for this sharp drop in gold was the May non-farm payrolls data released by the U.S. last Friday (June 5).
According to BLS data, U.S. non-farm payrolls increased by 172,000 in May, significantly exceeding market expectations of approximately 85,000. The unemployment rate held steady at 4.3%, while average hourly earnings rose 0.3% month-over-month and 3.4% year-over-year. More importantly, employment data for March and April were revised upward by a combined 93,000, indicating that the U.S. labor market is not merely experiencing a single-month rebound but possesses overall resilience stronger than previously anticipated.
Robust employment figures imply that the Federal Reserve has no immediate need to pivot toward easing; instead, the market has begun re-betting on the possibility of a rate hike by year-end. Trading Economics noted that the strong U.S. jobs data reinforced market expectations for a potential Fed rate hike this year. Markets currently price in an approximately 70% probability of a rate hike in December, up from about 50% prior to the payrolls release. This directly pushed up real interest rate expectations, diminishing the appeal of gold, a non-yielding asset, in a high-rate environment.
Meanwhile, renewed hostilities between Iran and Israel led to another surge in oil prices, further increasing downward pressure on gold. The latest reports indicate a direct military conflict has erupted between Israel and Iran, with both sides launching missile strikes against each other's territories, completely shattering the fragile ceasefire agreement from early April.
Following the news, oil prices jumped accordingly. WTI crude ( USOIL) surged 4.9% during the session, reaching a high of $95.25, while Brent crude saw gains exceeding 5% at one point, hitting a high of $98.08. Rising oil prices typically intensify inflation concerns; if inflation resurfaces, it becomes harder for the Fed to pivot to easing, and it may even maintain or further tighten policy, thereby increasing downward pressure on gold.
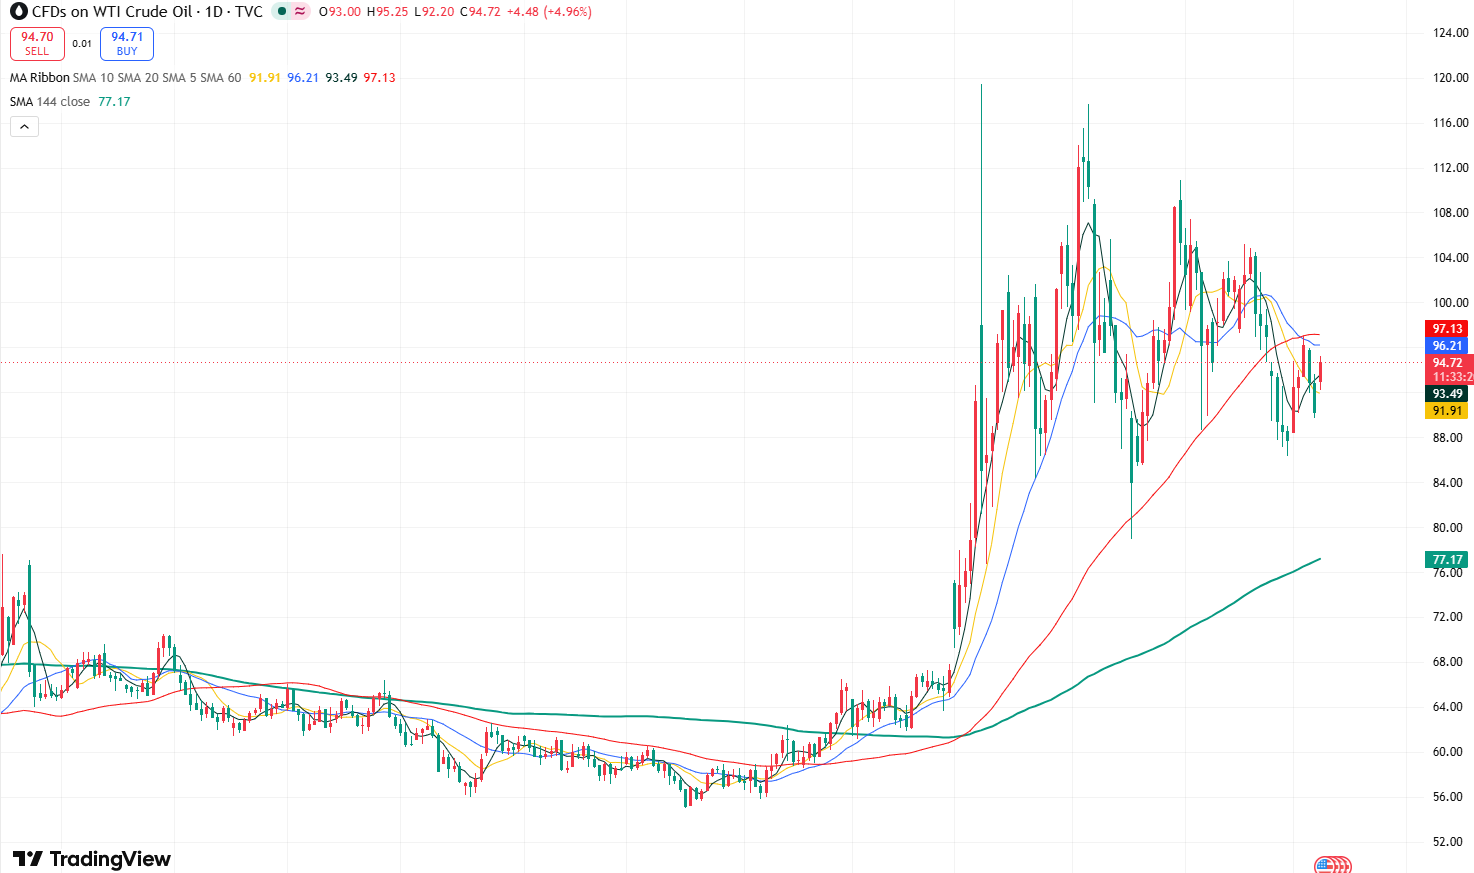
WTI Daily Price Chart, Source: TradingView
Furthermore, a strengthening U.S. dollar has exacerbated the decline in gold. Market data shows the U.S. Dollar Index has crossed above the 100 psychological level. For non-U.S. investors, a persistently strong dollar increases the investment cost of dollar-denominated gold, thereby weakening both physical and investment demand.
Will gold prices continue to decline?
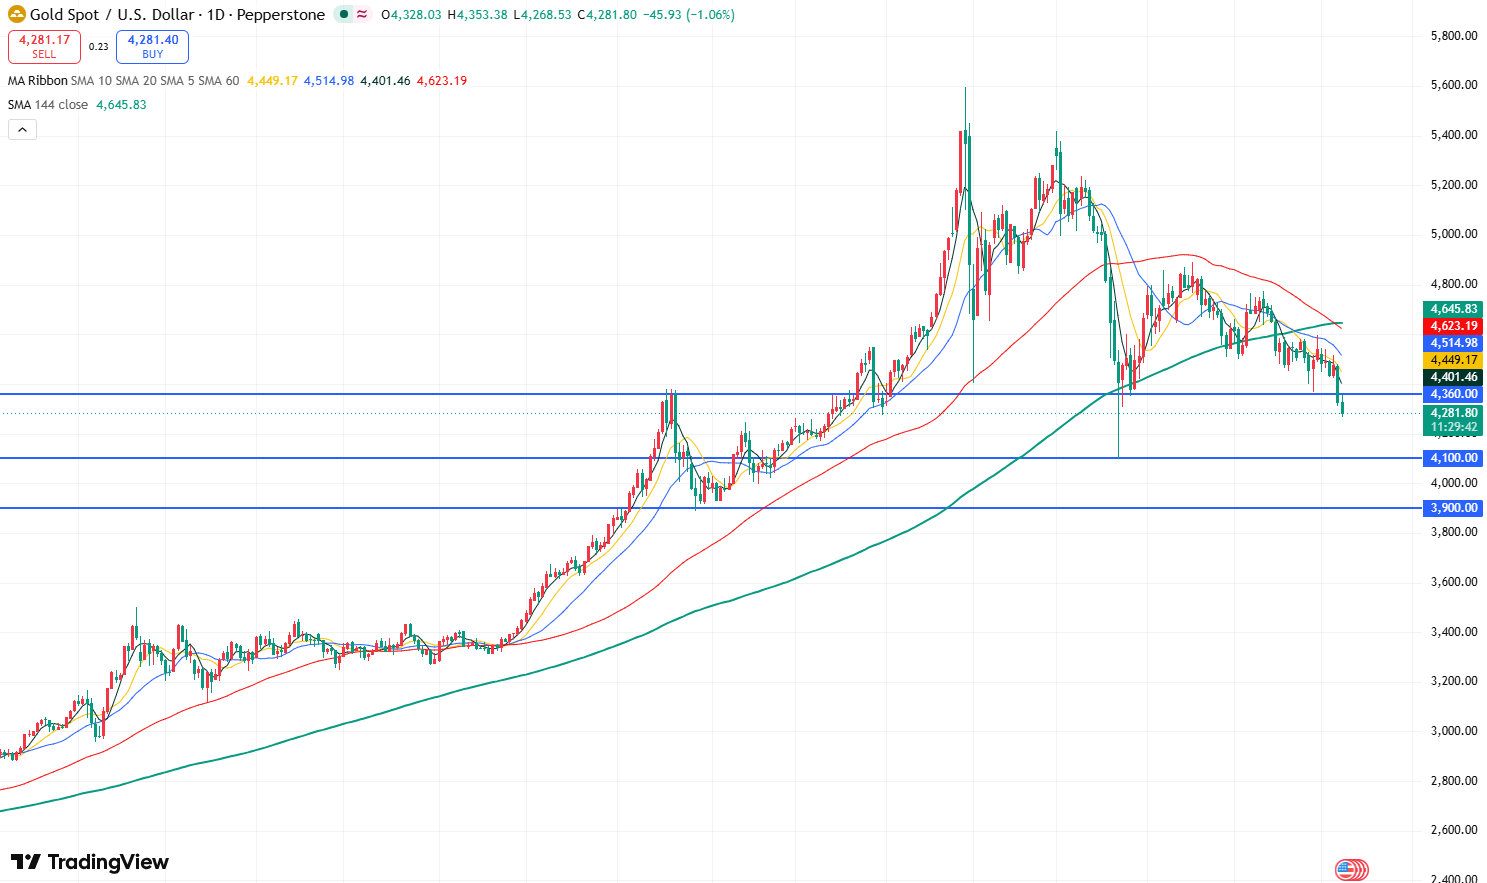
Gold Price Daily Chart, Source: TradingView
According to the daily chart, gold prices broke below key support at $4,360 last Friday and subsequently breached the $4,300 psychological mark today. This has significantly bolstered bearish momentum, suggesting further declines ahead.
Currently, with the breach of both the $4,360 and $4,300 support levels, further downside room has opened. Gold is set to first test the March low of $4,100; should this level fail, it could pave the way toward the $4,000 round-number mark or even $3,900.
On the upside, the break below $4,360 has turned this level into a significant resistance zone. For gold to regain upward momentum, it must decisively break and hold above this level before it can challenge the $4,520 resistance.
Recommended Articles


