




Gold advances as US-Iran deal hopes improve following Israel-Lebanon ceasefire
- Gold gains as the Israel-Lebanon ceasefire boosts hopes for progress in US-Iran talks
- Central banks resumed buying Gold in April, according to the WGC.
- XAU/USD holds above its 200-day SMA, keeping key long-term support intact.
Gold (XAU/USD) climbs modestly as the US Dollar (USD) weakens in the wake of a ceasefire between Israel and Lebanon brokered by the United States. At the time of writing, XAU/USD is trading around $4,497, up 1.40% on the day.
The ceasefire agreement is contingent on "a complete cessation of Hezbollah fire and the evacuation of all Hizbollah (sic) operatives from the South Litani Sector," according to a joint statement issued by the United States, Lebanon and Israel.
Markets view the development as a positive step toward a broader US-Iran agreement, particularly after both sides exchanged missile and drone strikes in the Gulf region earlier this week.
The breakthrough also removes a major obstacle in the US-Iran talks. Tehran has repeatedly insisted that any agreement with Washington must include an end to hostilities in Lebanon.
Still, the lack of clarity and slow progress in the US-Iran negotiations are keeping traders cautious, limiting stronger gains in Gold. Traders remain reluctant to place aggressive bets in either direction as XAU/USD consolidates within a familiar range above long-term support provided by the 200-day Simple Moving Average (SMA).
The recent surge in Crude Oil prices has increased upside risks to inflation, fueling expectations that major central banks, including the Federal Reserve (Fed), may need to keep interest rates higher for longer or even consider further tightening.
Higher interest rates are typically negative for Gold because the metal offers no yield. Recent US employment data further reinforces the view that the US central bank can afford to keep borrowing costs unchanged. Friday's Nonfarm Payrolls (NFP) report will be closely watched for fresh clues on the future path of interest rates.
Meanwhile, the underlying demand for Gold remains supported by steady central bank buying. According to the World Gold Council (WGC), central banks added a net 17 tonnes of Gold to their reserves in April after recording net sales in March.
Technical Analysis: XAU/USD struggles to build momentum above 200-day SMA
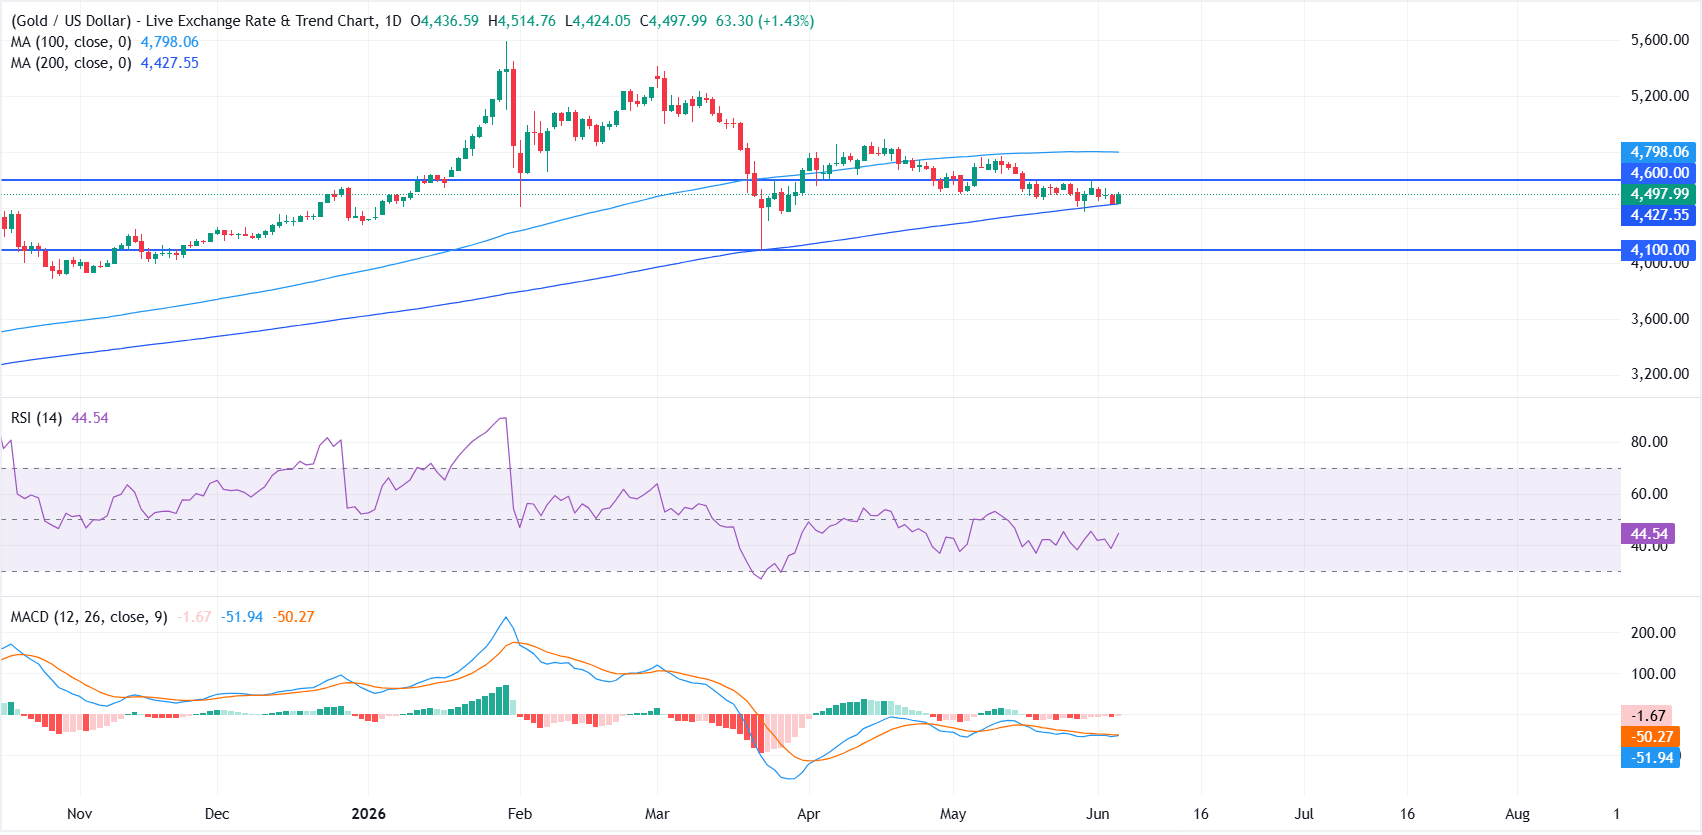
On the daily chart, XAU/USD holds above the 200-day Simple Moving Average (SMA) at roughly $4,427 but well below the 100-day SMA near $4,798, which keeps the broader tone neutral to slightly bearish as rallies face overhead supply.
The Relative Strength Index (RSI) around 45 suggests subdued buying interest, while the Moving Average Convergence Divergence (MACD) remains marginally negative, hinting that bullish momentum is subdued even as price stays supported by the longer-term trendline implied by the 200-day SMA.
On the topside, initial resistance is seen at the horizontal barrier around $4,600, with the 100-day SMA at approximately $4,798 acting as a higher cap if buyers extend the recovery.
On the downside, immediate support emerges from the 200-day SMA near $4,427, ahead of more substantial structural backing at the prior horizontal support zone around $4,100.
(The technical analysis of this story was written with the help of an AI tool.)
US Dollar Price Today
The table below shows the percentage change of US Dollar (USD) against listed major currencies today. US Dollar was the strongest against the Canadian Dollar.
| USD | EUR | GBP | JPY | CAD | AUD | NZD | CHF | |
|---|---|---|---|---|---|---|---|---|
| USD | -0.34% | -0.28% | -0.16% | -0.02% | -0.17% | -0.29% | -0.56% | |
| EUR | 0.34% | 0.05% | 0.19% | 0.32% | 0.15% | -0.04% | -0.23% | |
| GBP | 0.28% | -0.05% | 0.13% | 0.26% | 0.10% | -0.10% | -0.29% | |
| JPY | 0.16% | -0.19% | -0.13% | 0.12% | -0.03% | -0.24% | -0.41% | |
| CAD | 0.02% | -0.32% | -0.26% | -0.12% | -0.15% | -0.36% | -0.55% | |
| AUD | 0.17% | -0.15% | -0.10% | 0.03% | 0.15% | -0.18% | -0.36% | |
| NZD | 0.29% | 0.04% | 0.10% | 0.24% | 0.36% | 0.18% | -0.20% | |
| CHF | 0.56% | 0.23% | 0.29% | 0.41% | 0.55% | 0.36% | 0.20% |
The heat map shows percentage changes of major currencies against each other. The base currency is picked from the left column, while the quote currency is picked from the top row. For example, if you pick the US Dollar from the left column and move along the horizontal line to the Japanese Yen, the percentage change displayed in the box will represent USD (base)/JPY (quote).
Recommended Articles


