

Gold Price Forecast: Inflation Breaking 4% Pushes Gold to $4,000, Will It Continue to Fall?
TradingKey - On June 11 ET, impacted by strong CPI data and the situation in the Middle East, gold prices ( XAUUSD) briefly retreated toward the $4,000 level during intraday trading, hitting a low of $4,023.76. As of today's Asian session, gold prices hovered around $4,100, up 0.79% for the day.
Inflation surpasses 4%, coupled with the renewed deterioration of US-Iran tensions, intensifying downward pressure on gold.
From a fundamental perspective, the core reason for the current plunge in gold prices is the renewed deterioration of the U.S.-Iran situation.
U.S. Central Command reportedly stated on June 10 ET that the U.S. military launched a second wave of airstrikes against Iran, targeting military surveillance systems, communication facilities, and air defense infrastructure; Trump warned that Iran must reach a peace agreement or face even harsher strikes. Following the U.S. strikes, Iran launched missile attacks on U.S. bases in the Gulf region and announced the closure of the Strait of Hormuz.
Upon the news, oil prices surged rapidly. As of the early Asian session on June 11, WTI crude jumped from near $88 to a high of $93.64, and Brent crude rose from around $91 to a high of $95.5. The renewed hostilities between the U.S. and Iran pushed up oil prices and inflation expectations, which in turn weighed on gold prices, leading to a continuous decline.
At the same time, the U.S. May CPI data reinforced the downward pressure on gold. According to the Bureau of Labor Statistics, the May CPI rose 0.5% month-over-month and 4.2% year-over-year, exceeding April's 3.8%. Energy prices rose 3.9% monthly while gasoline prices rose 7.0%; on a yearly basis, energy prices surged 23.5% and gasoline 40.5%. This illustrates that the inflation rebound was mainly driven by energy shocks, highly correlated with the U.S.-Iran conflict and rising oil prices.
However, the CPI data was not entirely bearish. Core CPI rose 0.2% month-over-month, lower than April's 0.4%, with the year-over-year core rate at 2.9%. This implies that core inflation has not spiraled out of control, causing the market to slightly trim extreme rate hike expectations in the short term. The issue remains that headline inflation has climbed back above 4%, which, combined with last week's strong non-farm payrolls, continues to make it difficult for the Federal Reserve to pivot toward easing.
Will gold prices continue to decline?
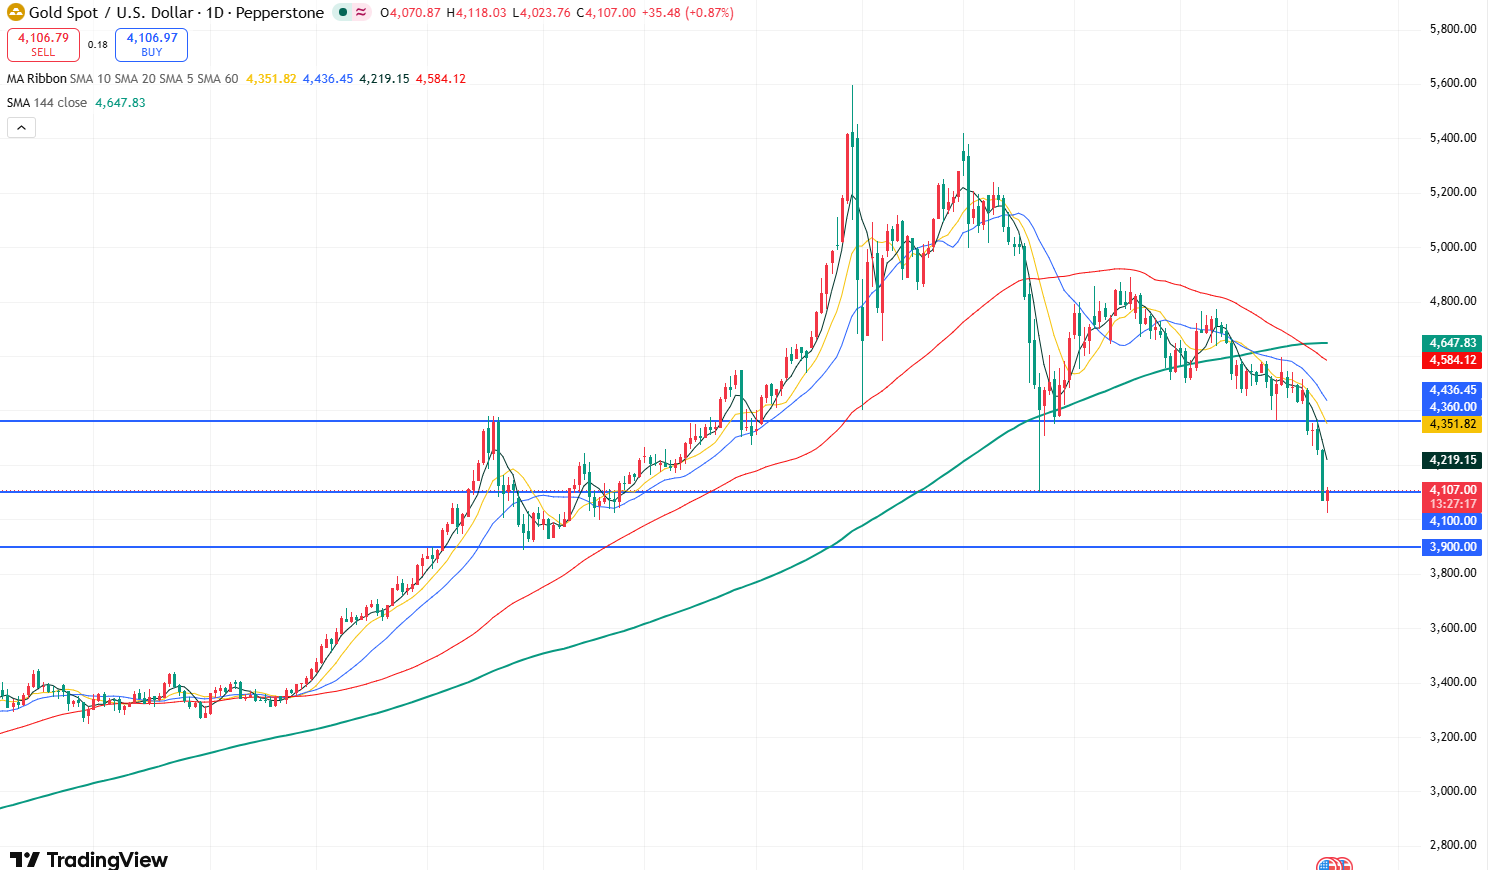
Gold price daily chart, source: TradingView
According to the daily gold chart, gold broke below the key support level of $4,100 on June 10 and briefly touched the $4,000 round-number mark. Price action indicates this level was not lost, and the rebound maintained today suggests strong support at $4,000. In the short term, the rebound may continue upward to test the $4,150 resistance level.
However, with the breach of the $4,100 support level, overall market sentiment for gold has turned bearish, further opening up the downside. The initial target for the decline is $4,000; if this level fails to hold, gold prices could see a deeper retreat to the $3,900 support level.
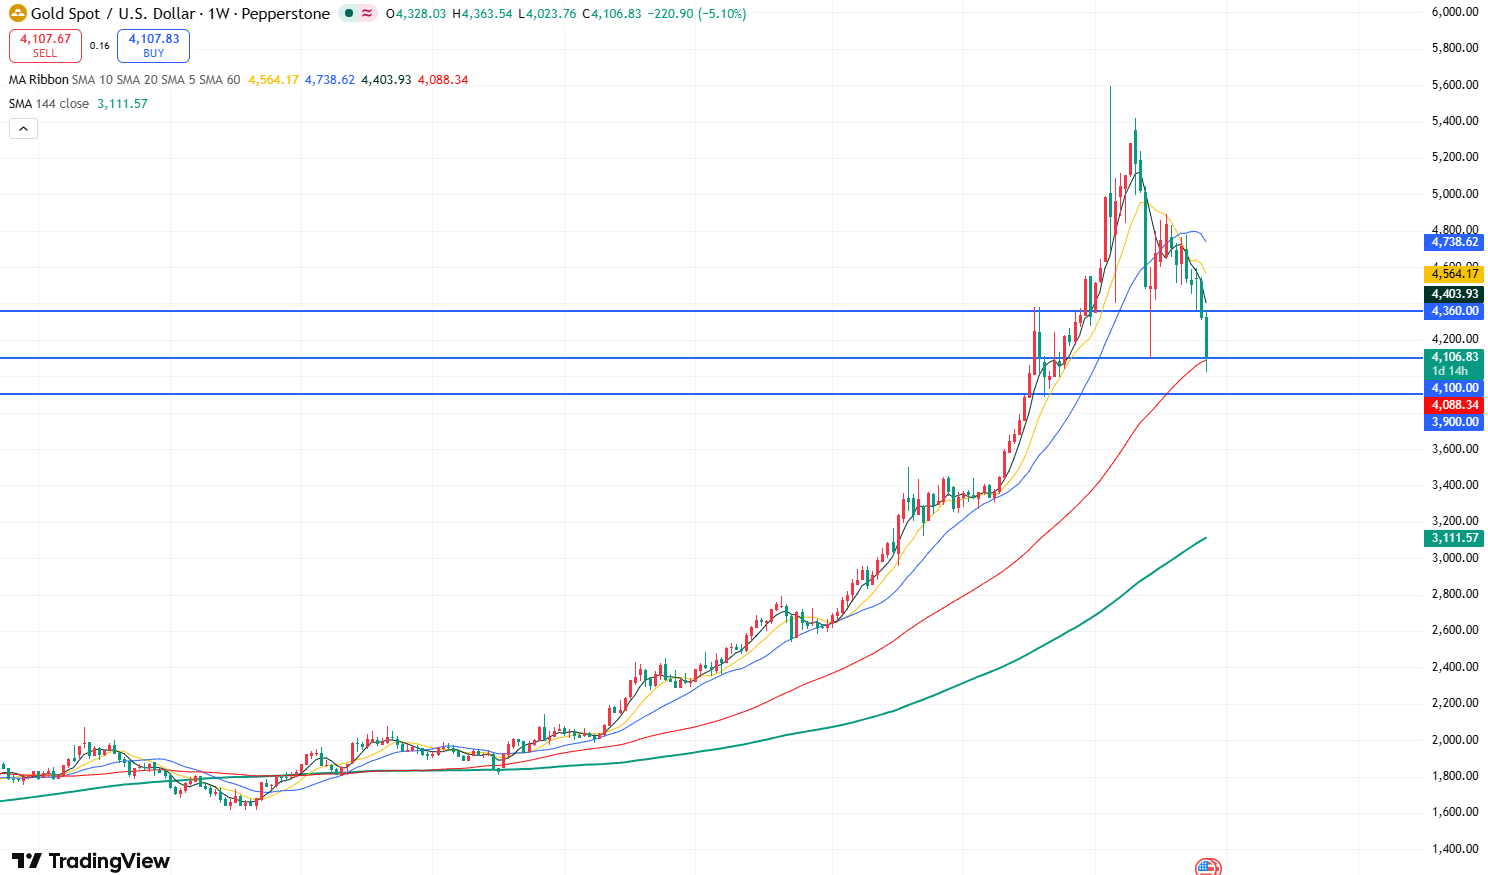
Gold price weekly chart, source: TradingView
From the weekly gold chart, particular attention should be paid to the $4,100 support level. As this position sits above the SMA60, it forms a confluence of support, weakening short-term bearish momentum.
Currently, gold prices have dropped as low as $4,023.76. If this week's closing price fails to settle above $4,100 or even breaks below the SMA60, it would signal a continuation of the downtrend, potentially breaking below $4,000 and falling further toward the $3,900 support level.
Recommended Articles


