
Ripple Price Forecast: XRP trades on shaky ground as downside risks emerge
- XRP declines to $3.00 as major crypto assets trim midweek gains on Friday.
- The SuperTrend and the RSI technical indicators signal bearish continuation.
- The MACD and Ichimoku Cloud indicators maintain a subtle bullish outlook.
Ripple (XRP) posts losses on Friday, but remains above the $3.00 level, reflecting a decline in retail interest in the broader cryptocurrency market following a minor mid-week uptrend to $3.14 triggered by the United States (US) Federal Reserve’s (Fed) dovish outlook for the fourth quarter.
The central bank signalled the need to revive the cooling labor market, projecting two more rate cuts before year-end in addition to Wednesday’s 25-basis-point interest rate cut.
The dovish gesture revived risk appetite for crypto and other riskier assets. However, the uptrend has been cut short amid a sudden increase in volatility ahead of the weekend.
XRP wobbles as Open Interest steadies
The XRP derivatives market exhibits a steady uptrend in futures Open Interest (OI), supporting positive sentiment and potentially driving demand for the cross-border money remittance token.
According to CoinGlass data, OI, referring to the notional value of outstanding futures contracts, averaged at $8.96 billion on Friday, up from $7.37 billion posted on September 7.
XRP Futures Open Interest | Source: CoinGlass
The uptrend in OI suggests that traders are increasingly opening new short positions, with new, fresh capital into the market amplifying downside risks. The subsequent drop in the price of XRP suggests bearish conviction and the potential for the downtrend to continue in the short term.
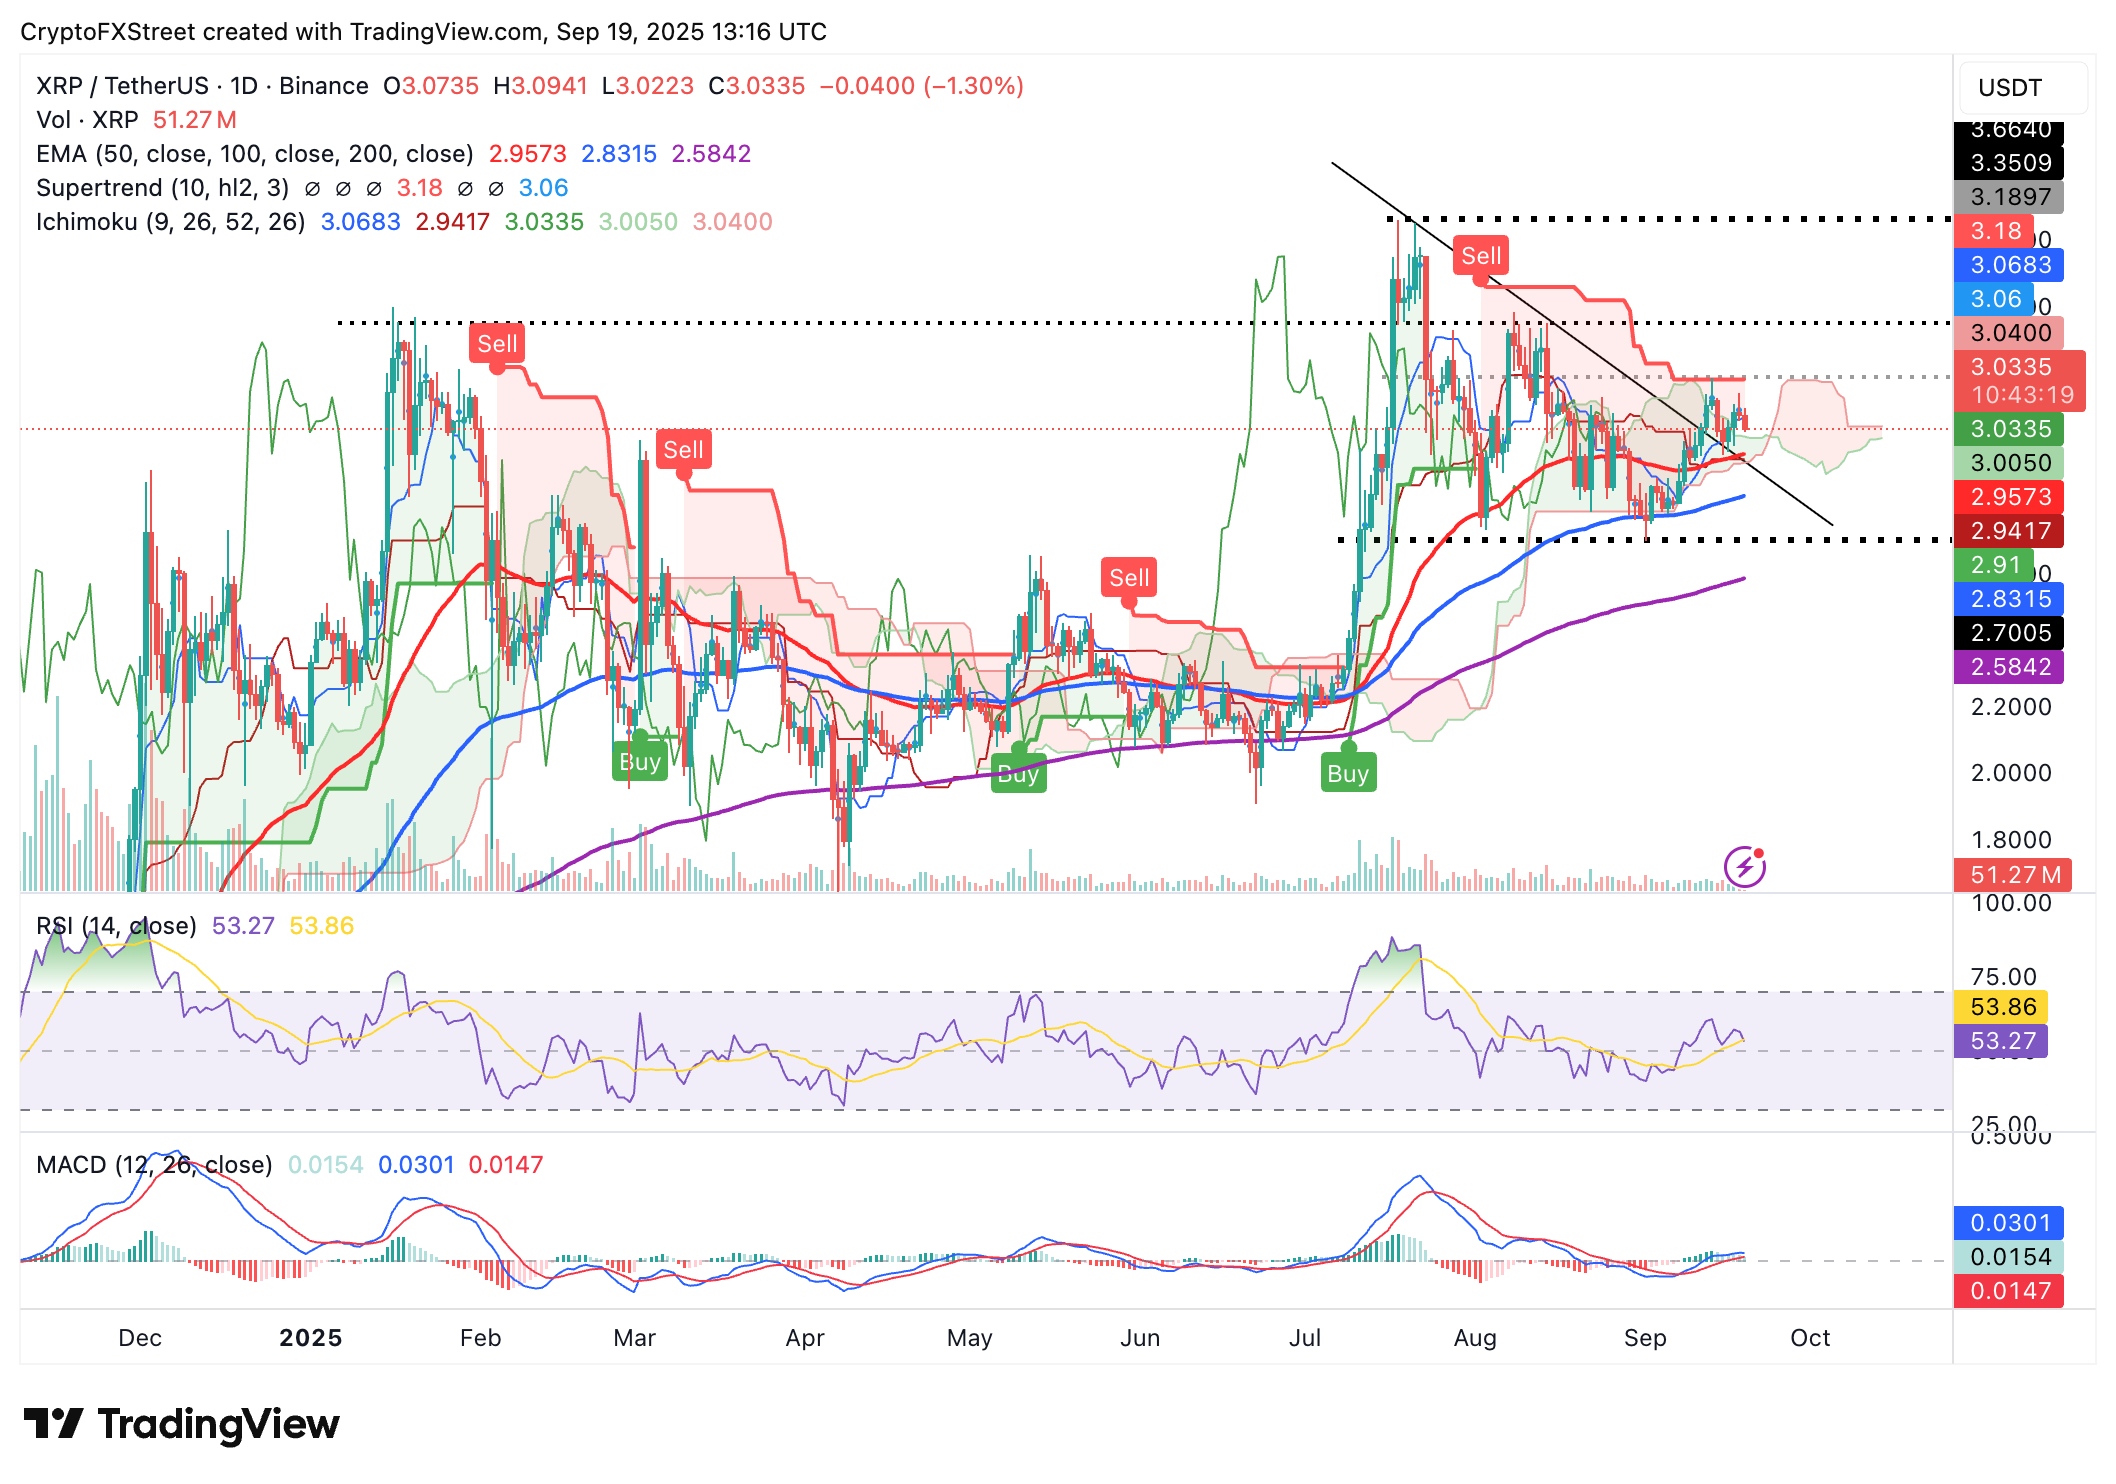
Technical outlook: XRP faces increased downside risks near $3.00
XRP falls toward the short-term $3.00 support at the time of writing on Friday, reflecting fresh risk-off sentiment in the broader cryptocurrency market. A correction in the Relative Strength Index (RSI) to 52 after topping out at 57 on Wednesday implies fading bullish momentum. A continued drop into the bearish region below the midline would affirm the growing bearish sentiment and increase the chances of XRP sliding below the $3.00 support.
The SuperTrend indicator, positioned above the XRP price on the daily chart, displays a sell signal, suggesting that investors reduce their exposure or focus on increasing short positions. As a measure of market volatility, the SuperTrend serves as a dynamic resistance. Therefore, downside risks could persist as long as the SuperTrend remains above the XRP price.

XRP/USDT daily chart
A break below the $3.00 short-term support could see traders shift their attention to the 50-day Exponential Moving Average (EMA) at $2.95 and the 100-day EMA at $2.83.
Still, the Moving Average Convergence Divergence (MACD) indicator reinforces a subtle bullish grip, maintaining a buy signal since September 8. If traders heed the signal and increase their exposure, an immediate rebound from the $3.00 support could ensue. A recovery from here would boost the chances of XRP testing resistance at $3.35 and the record high of $3.66.
The Ichimoku Cloud on the same daily chart holds below the XRP price, mirroring strong support and a bullish outlook. If XRP continues to hold above the Ichimoku Cloud, serving as a dynamic support, it suggests a bullish trend structure despite the current price drop. This means that XRP’s bullish potential is intact as the Cloud signals there is room for growth.
Ripple FAQs
Ripple is a payments company that specializes in cross-border remittance. The company does this by leveraging blockchain technology. RippleNet is a network used for payments transfer created by Ripple Labs Inc. and is open to financial institutions worldwide. The company also leverages the XRP token.
XRP is the native token of the decentralized blockchain XRPLedger. The token is used by Ripple Labs to facilitate transactions on the XRPLedger, helping financial institutions transfer value in a borderless manner. XRP therefore facilitates trustless and instant payments on the XRPLedger chain, helping financial firms save on the cost of transacting worldwide.
XRPLedger is based on a distributed ledger technology and the blockchain using XRP to power transactions. The ledger is different from other blockchains as it has a built-in inflammatory protocol that helps fight spam and distributed denial-of-service (DDOS) attacks. The XRPL is maintained by a peer-to-peer network known as the global XRP Ledger community.
XRP uses the interledger standard. This is a blockchain protocol that aids payments across different networks. For instance, XRP’s blockchain can connect the ledgers of two or more banks. This effectively removes intermediaries and the need for centralization in the system. XRP acts as the native token of the XRPLedger blockchain engineered by Jed McCaleb, Arthur Britto and David Schwartz.
บทความแนะนำ


