
Coinbase asset roadmap adds Ethena, ENA targets $0.34 breakout before listing
- Ethena records its fourth consecutive positive day, signaling increased bullish momentum.
- Coinbase announces the addition of Ethena to the asset roadmap, making it tradable on the platform soon.
- Ethena's technical and derivatives data suggest a bullish outlook supporting a potential breakout of $0.34.
Ethena (ENA) inches higher by over 5% at press time on Tuesday after the announcement of Coinbase adding Ethena to the asset roadmap for future listing. With bullish sentiment on the rise amid increased listing chances on Coinbase, ENA’s technical outlook and lifted derivatives data flash a breakout rally possibility.
Coinbase shares Ethena token listing plans
In a recent X post, the US cryptocurrency exchange Coinbase has announced plans to list the Decentralized Finance (DeFi) token Ethena by adding it to the asset roadmap. The exchange has added another ERC-20 token, QCAD (QCAD).

The contract address for Ethena (ENA) is 0x57e114B691Db790C35207b2e685D4A43181e6061. By joining the listing, the chances of Ethena trading to begin on Coinbase have significantly increased and boosted the bullish sentiment of ENA holders.
Ethena’s open interest spikes amid boosted sentiment
CoinGlass’ data shows the ENA derivatives Open Interest (OI) rising to $427 million, a 9.45% surge within 24 hours. An inflow in the derivatives market fuels the surge in OI and typically relates to increased buying activity.
Alongside the rising capital, the OI-weighted funding rate turns positive and stabilizes at 0.0060%. An increase in buying activity in futures could drive the derivatives price above the spot price; to align the prices, funding rates are paid by bulls to short-position traders.
Typically, a short liquidation surge is observed amid heightened optimistic sentiments. The 24-hour liquidations data show $879K worth of bearish positions wiped out, compared to $355K of bullish positions.
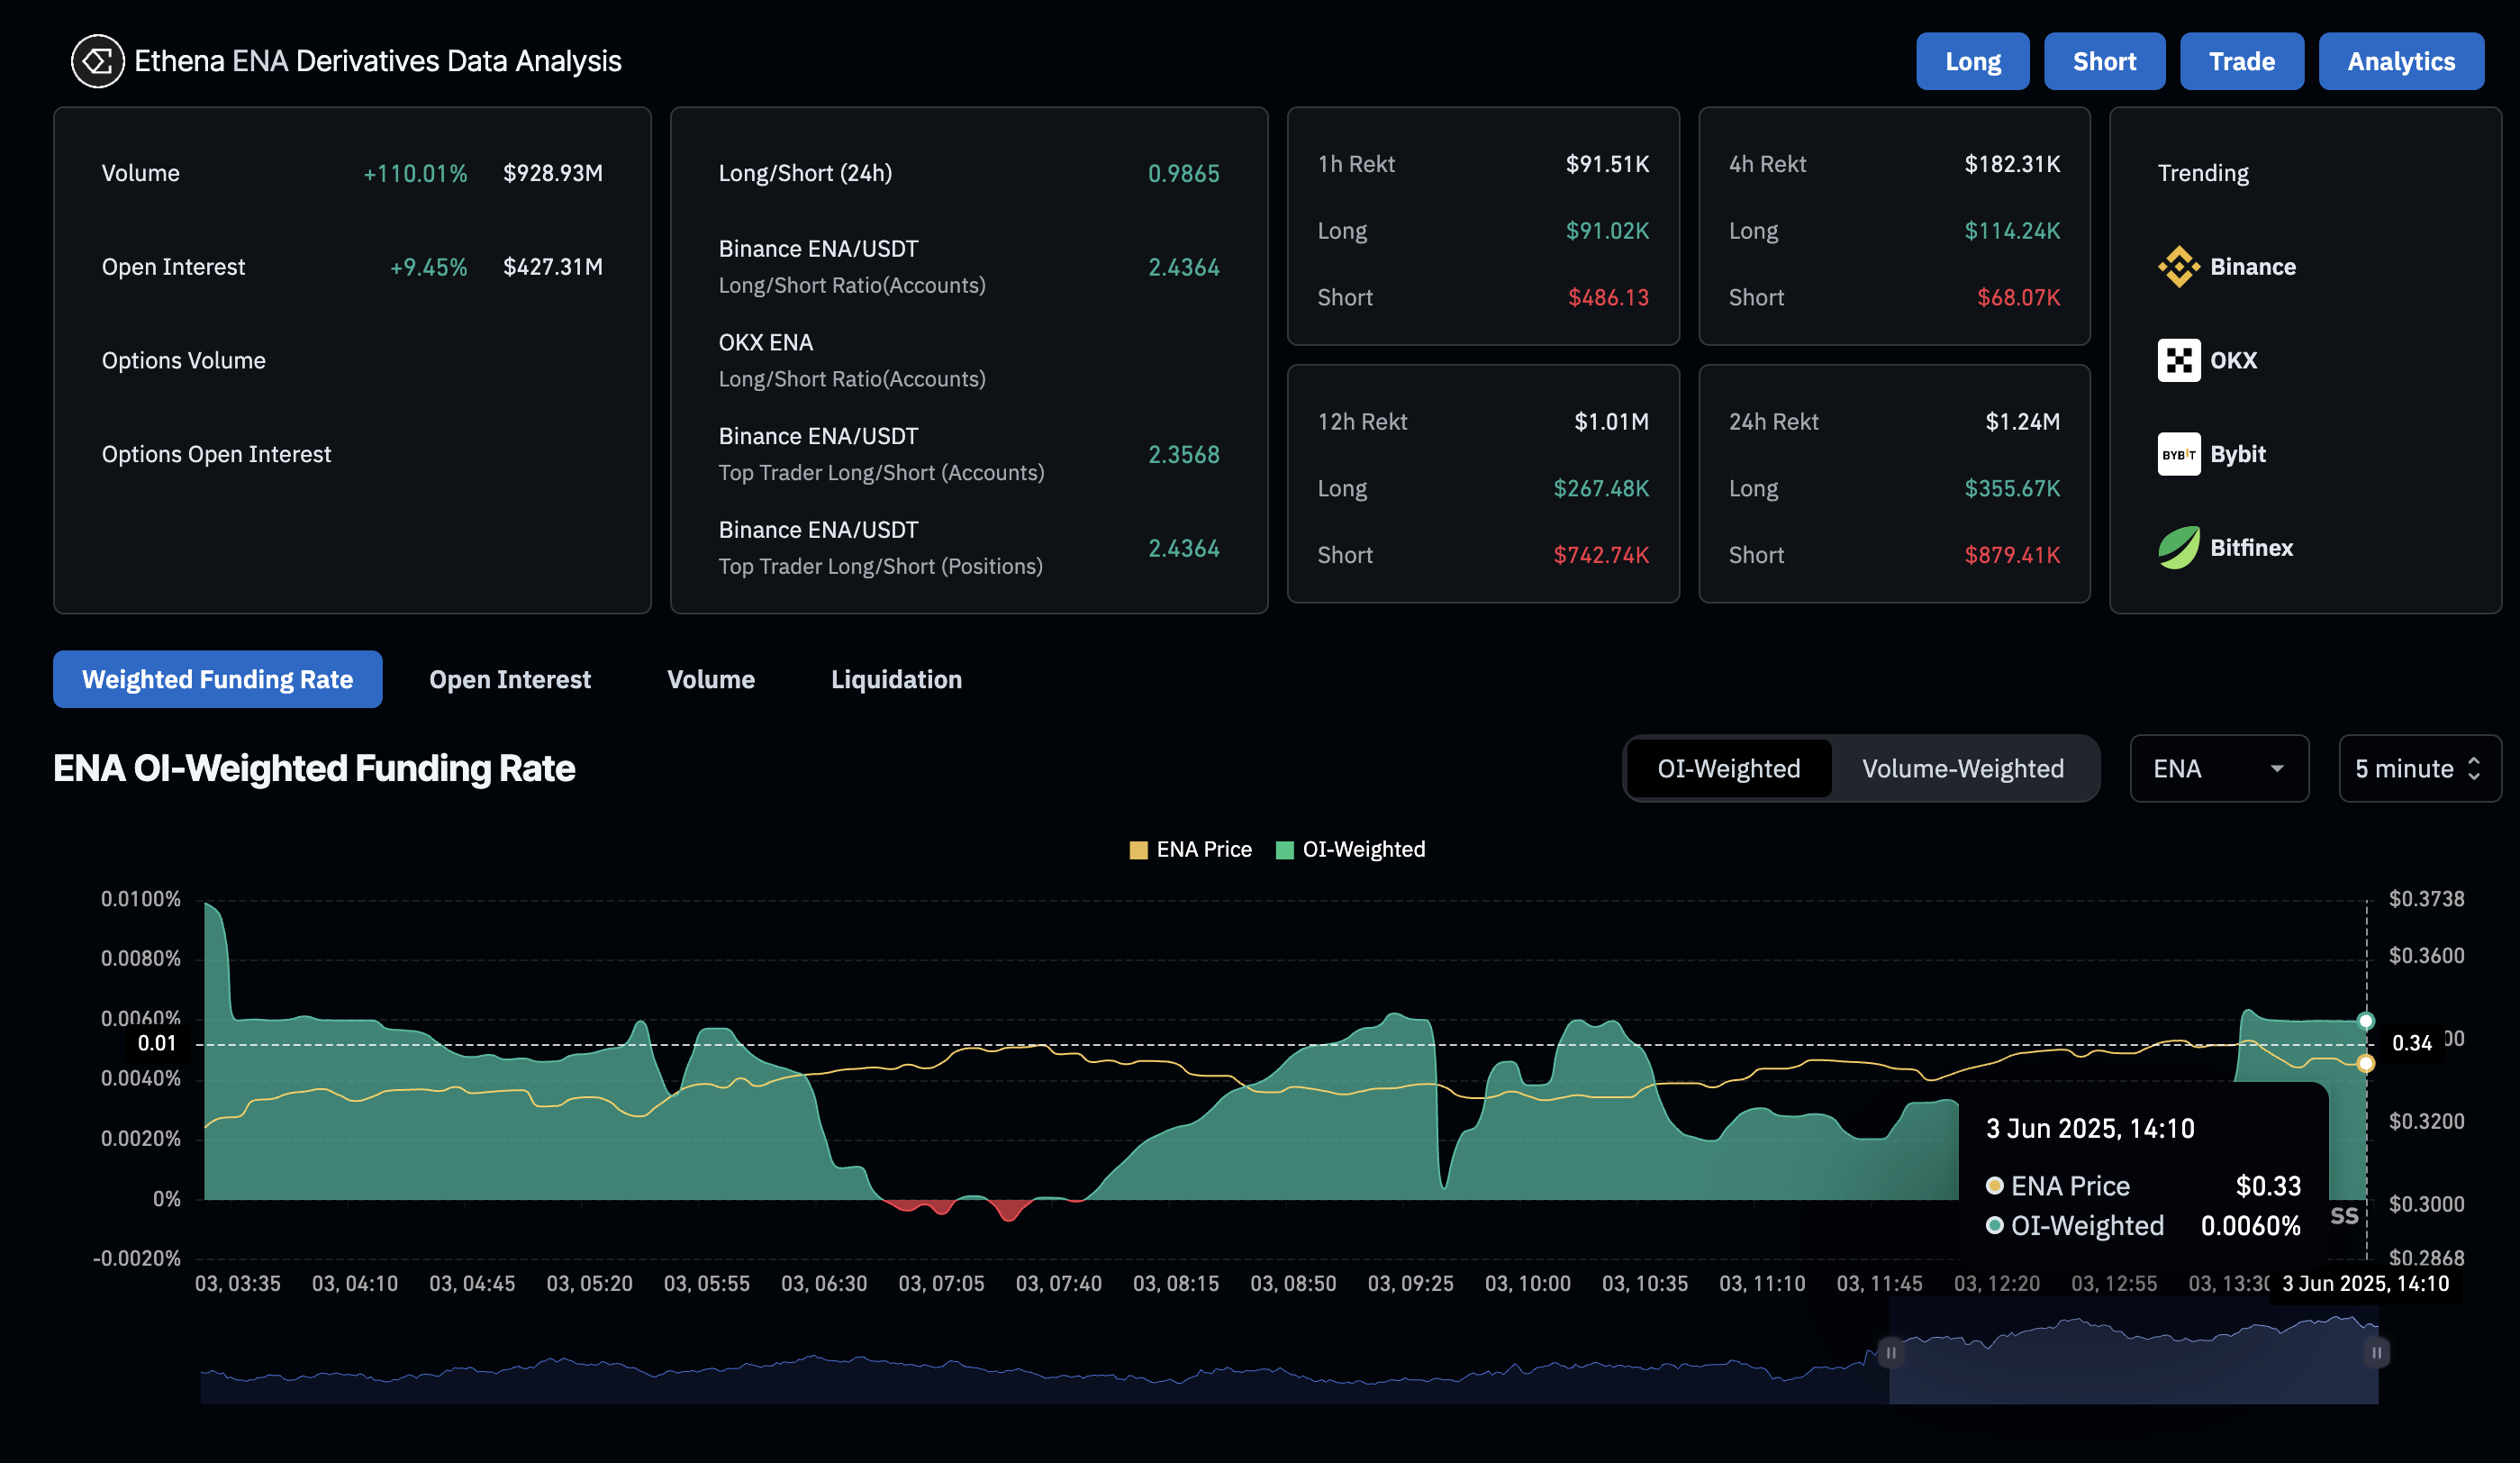
Ethena derivatives data. Source: Coinglass
ENA nears key resistance at $0.3446
After a 17% drop last week, Ethena shows a bullish reversal at play, accounting for nearly a 10% surge so far this week. At the time of writing, Ethena trades at $0.3426, printing its fourth consecutive bullish candle on the 4-hour chart following the Coinbase announcement.
ENA moves above the 50-period Exponential Moving Average (EMA) at $0.3402 and challenges the 50% Fibonacci retracement level at $0.3446, drawn between May’s low at $0.2563 and high at $0.4633.
Sideline traders can find a bullish entry point with a clean push in Ethena, with the closing price above $0.3446. The immediate resistance level lies at the $0.4037 peak formed on May 27, followed by the 30-day high at $0.4633.
Amid the breakout chances, the momentum indicators trigger a bullish signal. The Moving Average Convergence/Divergence (MACD) and its signal line skyrocket in the negative territory, nearing the center line. With the average lines nearing the positive territory and a fresh wave of green histogram bars, the indicator reflects a surge in bullish momentum.
Further up, the Relative Strength Index (RSI) shoots to 59, crossing above the halfway line and signaling a significant rise in buying pressure.
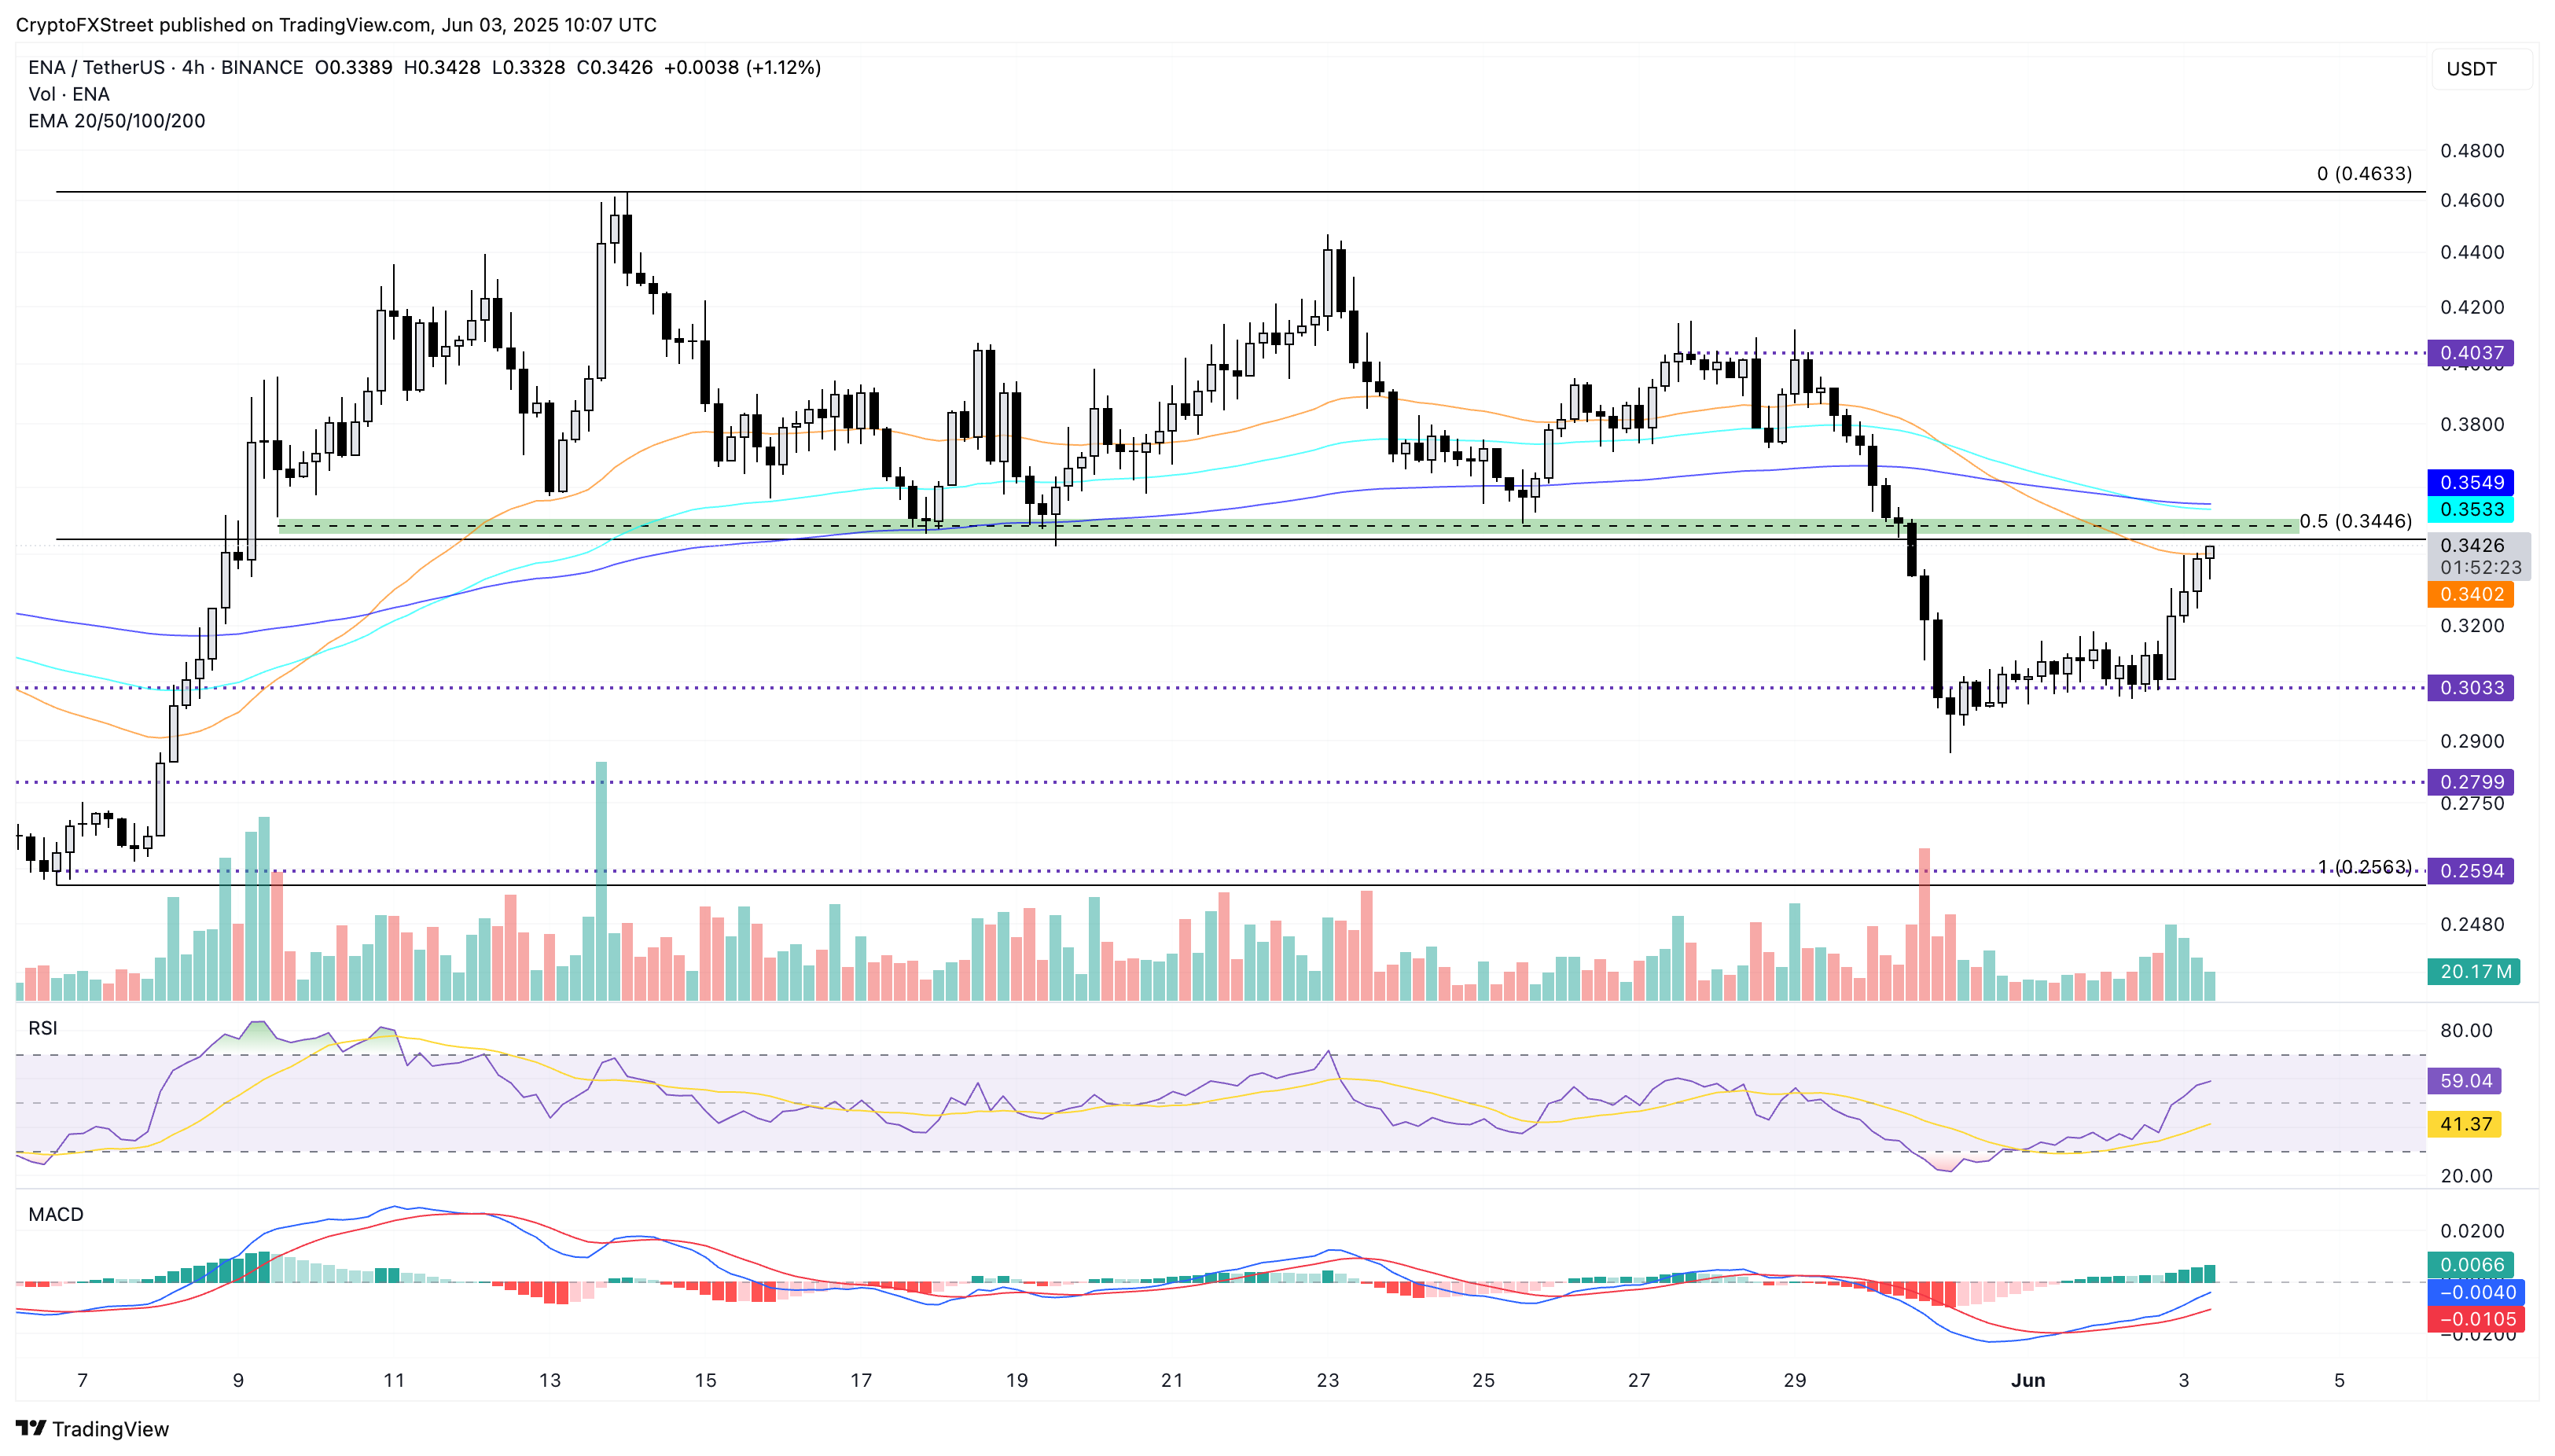
ENA/USDT 4-hour price chart. Source: Tradingview
Conversely, a flip from the $0.3446 resistance could result in a decline to the $0.3033 support floor.
บทความแนะนำ


