BNB Price Forecast: BNB recovery receives boost as trading volume hits $11.35 billion, highest yearly level

แหล่งที่มา Fxstreet
  • BNB price extends its recovery, trading around $670 on Tuesday after rebounding from a key level.
  • On-chain data paints a bullish picture as BNB’s ecosystem trading volume and stablecoin activity are increasing.
  • The technical outlook indicates a bullish breakout, targeting a higher leg.

BNB (BNB) is extending its recovery, trading around $670 on Tuesday after rebounding from a key level over the weekend. On-chain data and technical outlook suggest a rally ahead as BNB breaks above the symmetrical triangle pattern, with ecosystem trading volume and stablecoin activity surging.

BNB trading volume and stablecoin reach record levels

Token terminal data indicate that the BNB ecosystem’s trading volume (the aggregate trading volume generated by all exchange applications on the chain) reached a new yearly high of $11.35 billion on Sunday and has been steadily rising since early May. This volume rise indicates a surge in traders’ interest and liquidity in the BNB chain, boosting its bullish outlook.

BNB Ecosystem trading volume chart. Source: Token terminal

BNB Ecosystem trading volume chart. Source: Token terminal

BNB’s stablecoin supply has been actively rising and reached $10.2 billion, the highest year-to-date (YTD) level last week, according to Atermis terminal data. Such stablecoin activity and value increase on the BNB project indicate a bullish outlook, as it boosts network usage and can attract more users to the ecosystem, driven by Decentralized Finance (DeFi), meme coins, and payment use cases.
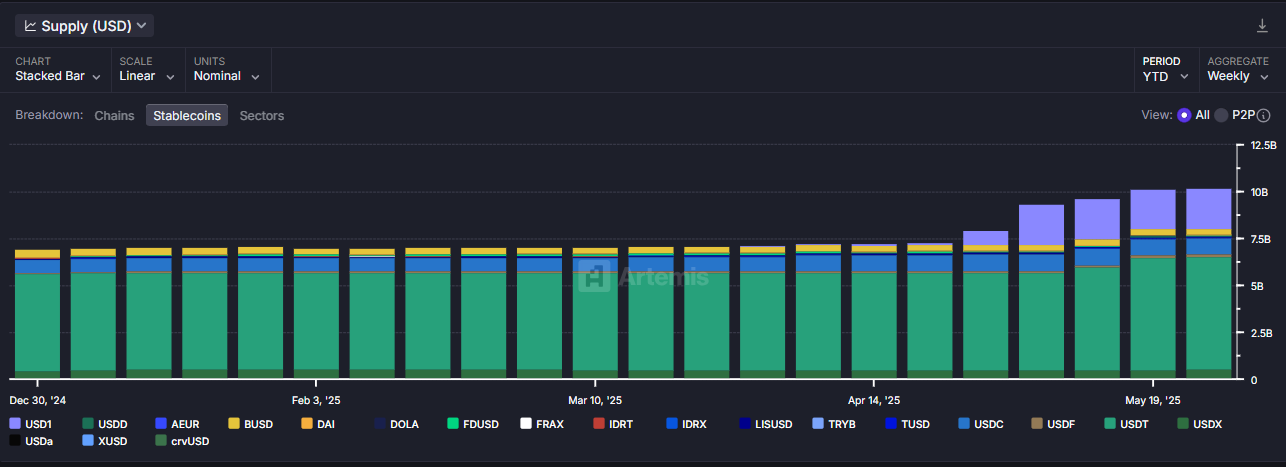
BNB stablecoin supply chart. Source: Atermis terminal

BNB stablecoin supply chart. Source: Atermis terminal

BNB Price Forecast: BNB bulls target levels above $700

BNB’s price broke above a symmetrical triangle on May 8, a technical pattern formed by connecting multiple highs and lows with two converging trendlines (from January to early May) and rallied more than 10%. However, it has been consolidating between the $638 and $696 ranges for more than 21 days. At the time of writing on Tuesday, it trades inside this range at around $668.

If BNB closes above the upper range of consolidation at $696, it could extend the rally to reach the technical target of the symmetrical triangle at $839.14 (obtained by measuring the distance between the first daily high and the first daily low and adding it to the breakout point). This is a theoretical target, and traders could realize some profits around the weekly level of $709.29 and at the Feburary 13 high of $732.

The Relative Strength Index (RSI) on the daily chart reads 55 and points upward after rebounding from its neutral level of 50, indicating bullish momentum is gaining traction.
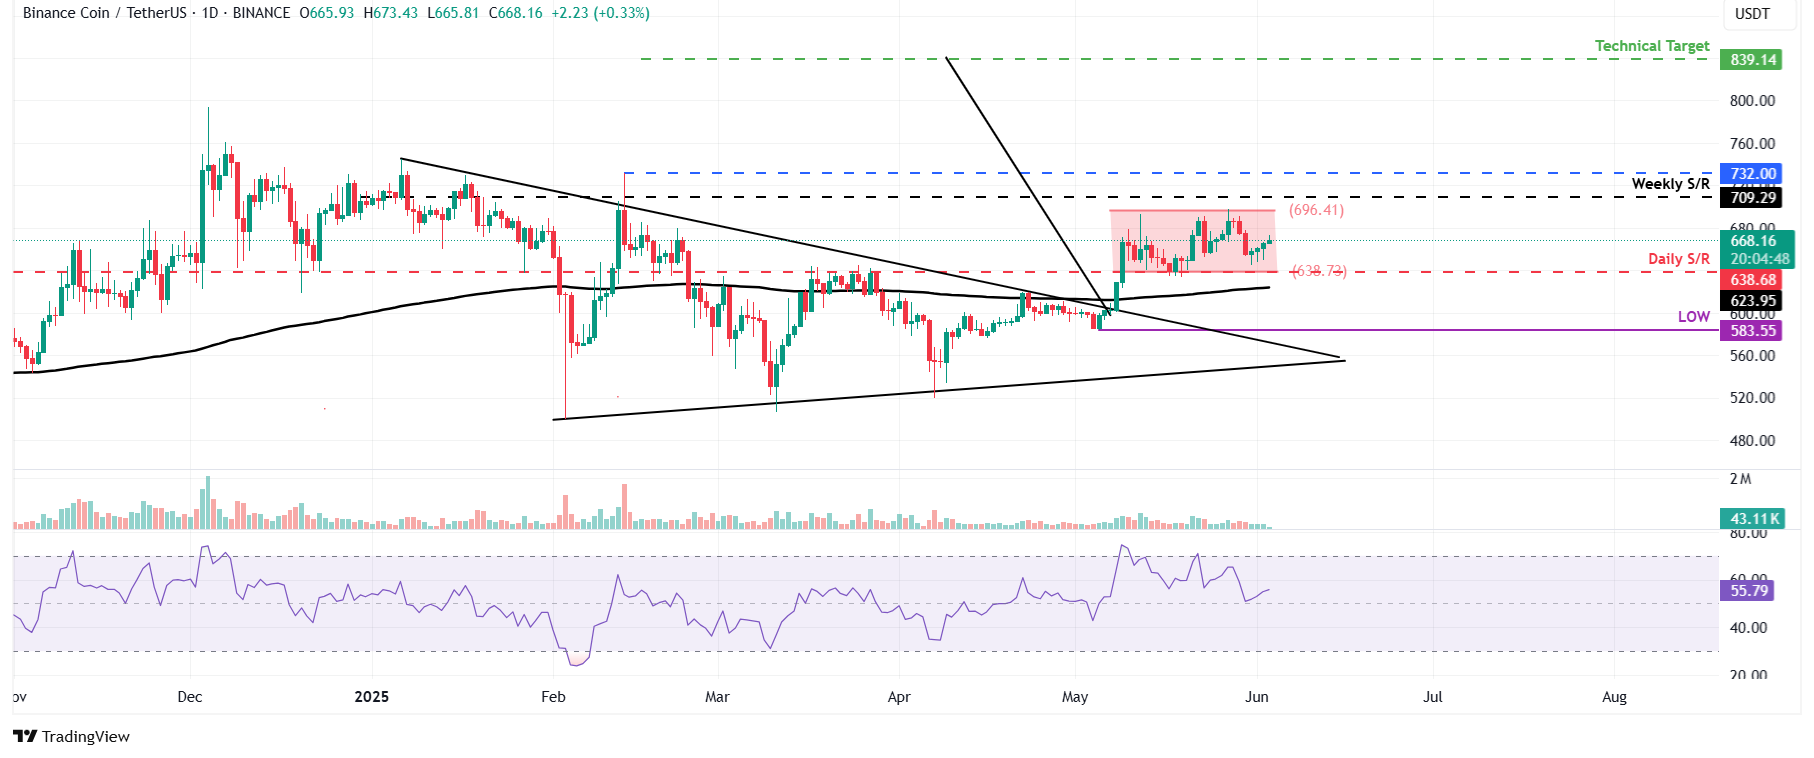
BNB/USDT daily chart

BNB/USDT daily chart

However, if BNB faces a correction, it could extend the decline to retest its lower range of consolidation at $638, which coincides with the daily support level.

ข้อจำกัดความรับผิดชอบ: เพื่อการอ้างอิงเท่านั้น ผลการดำเนินงานในอดีตไม่ได้บ่งบอกถึงผลลัพธ์ในอนาคต
placeholder
การคาดการณ์ราคา GBP/JPY: ดูเหมือนว่าจะพร้อมที่จะสร้างโมเมนตัมต่อไปเหนือระดับ 195.00คู่สกุลเงิน GBP/JPY ปรับตัวขึ้นต่อจากการรีบาวด์ที่ดีในวันก่อนหน้าจากบริเวณ 192.75-192.70 หรือจุดต่ำสุดในรอบกว่าหนึ่งสัปดาห์ และได้รับแรงผลักดันเชิงบวกเป็นวันที่สองติดต่อกันในวันพุธ
ผู้เขียน  FXStreet
12 ชั่วโมงที่แล้ว
คู่สกุลเงิน GBP/JPY ปรับตัวขึ้นต่อจากการรีบาวด์ที่ดีในวันก่อนหน้าจากบริเวณ 192.75-192.70 หรือจุดต่ำสุดในรอบกว่าหนึ่งสัปดาห์ และได้รับแรงผลักดันเชิงบวกเป็นวันที่สองติดต่อกันในวันพุธ
placeholder
การคาดการณ์ราคาทองคำเงิน: ขาขึ้นของ XAGUSD มีความได้เปรียบใกล้ระดับกลางที่ $34.00s ซึ่งต่ำกว่าจุดสูงสุด YTD เล็กน้อยโลหะเงิน (XAG/USD) ดิ้นรนเพื่อใช้ประโยชน์จากการดีดตัวขึ้นช่วงข้ามคืนจากระดับต่ำกว่า 34.00 ดอลลาร์ และแกว่งตัวในกรอบการซื้อขายแคบ ๆ ในช่วงเซสชั่นเอเชียในวันพุธ
ผู้เขียน  FXStreet
13 ชั่วโมงที่แล้ว
โลหะเงิน (XAG/USD) ดิ้นรนเพื่อใช้ประโยชน์จากการดีดตัวขึ้นช่วงข้ามคืนจากระดับต่ำกว่า 34.00 ดอลลาร์ และแกว่งตัวในกรอบการซื้อขายแคบ ๆ ในช่วงเซสชั่นเอเชียในวันพุธ
placeholder
WTI ขยายตัวขึ้นเหนือระดับ 62.50 ดอลลาร์ ความเสี่ยงทางภูมิศาสตร์การเมืองและความกังวลเกี่ยวกับอุปทานน้ำมันดิบเวสต์เทกซัสอินเตอร์มีเดียต (WTI) เกณฑ์มาตรฐานน้ำมันดิบของสหรัฐฯ ซื้อขายอยู่ที่ประมาณ 62.80 ดอลลาร์ในช่วงเวลาการซื้อขายของเอเชียในวันอังคาร ราคาของ WTI ปรับตัวขึ้นต่อไปสู่ระดับสูงสุดในรอบสองสัปดาห์ท่ามกลางความตึงเครียดทางภูมิรัฐศาสตร์ที่ยังคงมีอยู่และค่าเงินดอลลาร์สหรัฐ (USD) ที่อ่อนค่าลง
ผู้เขียน  FXStreet
19 ชั่วโมงที่แล้ว
น้ำมันดิบเวสต์เทกซัสอินเตอร์มีเดียต (WTI) เกณฑ์มาตรฐานน้ำมันดิบของสหรัฐฯ ซื้อขายอยู่ที่ประมาณ 62.80 ดอลลาร์ในช่วงเวลาการซื้อขายของเอเชียในวันอังคาร ราคาของ WTI ปรับตัวขึ้นต่อไปสู่ระดับสูงสุดในรอบสองสัปดาห์ท่ามกลางความตึงเครียดทางภูมิรัฐศาสตร์ที่ยังคงมีอยู่และค่าเงินดอลลาร์สหรัฐ (USD) ที่อ่อนค่าลง
placeholder
EUR/USD ปรับตัวลดลงสู่ระดับกลาง 1.1300; มองไปที่ดัชนีราคาสินค้าใช้จ่ายส่วนบุคคลของสหรัฐฯ เพื่อหาแรงกระตุ้นใหม่คู่ EUR/USD ดิ้นรนเพื่อใช้ประโยชน์จากการดีดตัวขึ้นที่แข็งแกร่งในวันก่อนหน้าจากบริเวณ 1.1200 หรือระดับต่ำสุดในรอบหนึ่งสัปดาห์ครึ่ง และซื้อขายด้วยแนวโน้มเชิงลบเล็กน้อยในช่วงเซสชั่นเอเชียของวันศุกร์
ผู้เขียน  FXStreet
5 เดือน 30 วัน ศุกร์
คู่ EUR/USD ดิ้นรนเพื่อใช้ประโยชน์จากการดีดตัวขึ้นที่แข็งแกร่งในวันก่อนหน้าจากบริเวณ 1.1200 หรือระดับต่ำสุดในรอบหนึ่งสัปดาห์ครึ่ง และซื้อขายด้วยแนวโน้มเชิงลบเล็กน้อยในช่วงเซสชั่นเอเชียของวันศุกร์
placeholder
การคาดการณ์ราคาเงิน: XAG/USD ฟื้นตัวที่ $33.00 จากข้อมูลการจ้างงานของสหรัฐที่อ่อนแอซึ่งเพิ่มความต้องการสินทรัพย์ปลอดภัยราคาโลหะเงินปรับตัวขึ้นมากกว่า 1% ในวันพฤหัสบดี ขึ้นไปเหนือระดับ 33.00 ดอลลาร์ เนื่องจากความต้องการโลหะที่เป็นที่หลบภัยเพิ่มขึ้นหลังจากการเปิดเผยข้อมูลการจ้างงานที่อ่อนแอของสหรัฐฯ ณ เวลานี้ XAG/USD ซื้อขายอยู่ที่ 33.31 ดอลลาร์
ผู้เขียน  FXStreet
5 เดือน 30 วัน ศุกร์
ราคาโลหะเงินปรับตัวขึ้นมากกว่า 1% ในวันพฤหัสบดี ขึ้นไปเหนือระดับ 33.00 ดอลลาร์ เนื่องจากความต้องการโลหะที่เป็นที่หลบภัยเพิ่มขึ้นหลังจากการเปิดเผยข้อมูลการจ้างงานที่อ่อนแอของสหรัฐฯ ณ เวลานี้ XAG/USD ซื้อขายอยู่ที่ 33.31 ดอลลาร์
ตราสารที่เกี่ยวข้อง
goTop
quote