
Bitcoin hovers above $108,000, but analysts warn against the next BTC drop
- Bitcoin hovers above $108,000 on Wednesday, holding steady above support.
- Analysts at Bitunix warn traders against the next drop in Bitcoin price, suggesting a crash under support could usher large volume liquidations.
- Bitcoin could re-test its all-time high and enter price discovery once the recovery is complete.
- Key on-chain indicator suggests Bitcoin cycle top not yet in, as profit-taking remains subdued.
Bitcoin (BTC) hovers above key support at $108,000. Analysts at Bitunix warn that a price crash could occur, citing the potential for a liquidity sweep below this level following last week's large-scale liquidations in BTC derivatives markets.
Three reasons why Bitcoin traders should be wary of drop under $108,000 support
Bitcoin closed under the $108,000 support last Saturday. Since then, BTC has consistently closed above the key support level. CoinGlass data shows a slew of liquidations, over $158 million in long positions were liquidated last Friday.
While Bitcoin recovered from the decline under support, analysts at Bitunix warn traders against opening long positions between the $109,000 to $112,000 zone. Analysts told FXStreet in a written note:
“Short-term attention should be paid to the effect of support at $108,500–$109,000, and it is not recommended to chase higher. We advise observing whether the $110,800–$112,000 pressure band is effectively broken before considering further positions. A drop below $108,000 could trigger a new round of liquidations. Traders are advised to exercise strict risk control as the market could weaken again if capital inflows do not resume.”
Institutional capital flows to Bitcoin have slowed down in the last few weeks. Data from Farside Investors shows that capital inflow to spot Bitcoin ETFs has slowed down since May 22.

Bitcoin ETF Flows | Source: Farside Investors
While Strategy and other corporate players buy Bitcoin for their treasury, institutional capital flows to spot Bitcoin ETFs, considered indicative of institutional interest, are slowing down.
Xapo Bank’s head of investment, Gadi Chait, believes that major players in the market are convinced of Bitcoin’s long-term value. Chait told FXStreet:
“Bitcoin has spent the past week catching its breath just below its all-time high, trading around $109,000 as powerful forces pull the market in different directions. On one side, institutional investors continue pouring money into Bitcoin ETFs and corporate treasuries. Yet, geopolitical tensions and policy uncertainty create significant background noise, keeping some investors cautious. This aggressive buying on any price dip shows that major players remain convinced of Bitcoin's long-term value.
Similarly, the Trump administration continues signalling strong support for Bitcoin. President Trump's media company plans to raise $2.5 billion to build a corporate Bitcoin treasury. This extraordinary endorsement from the highest levels of government underscores just how mainstream Bitcoin has become.”
On-chain indicator shows Bitcoin cycle top is away
The Bitcoin Net Realized Profit/Loss indicator on BGeometrics shows that a positive reading corresponds to a large number of investors taking profits on their Bitcoin holdings. Typically, the largest profit realization spikes correspond to the end phase of Bitcoin’s market cycle.
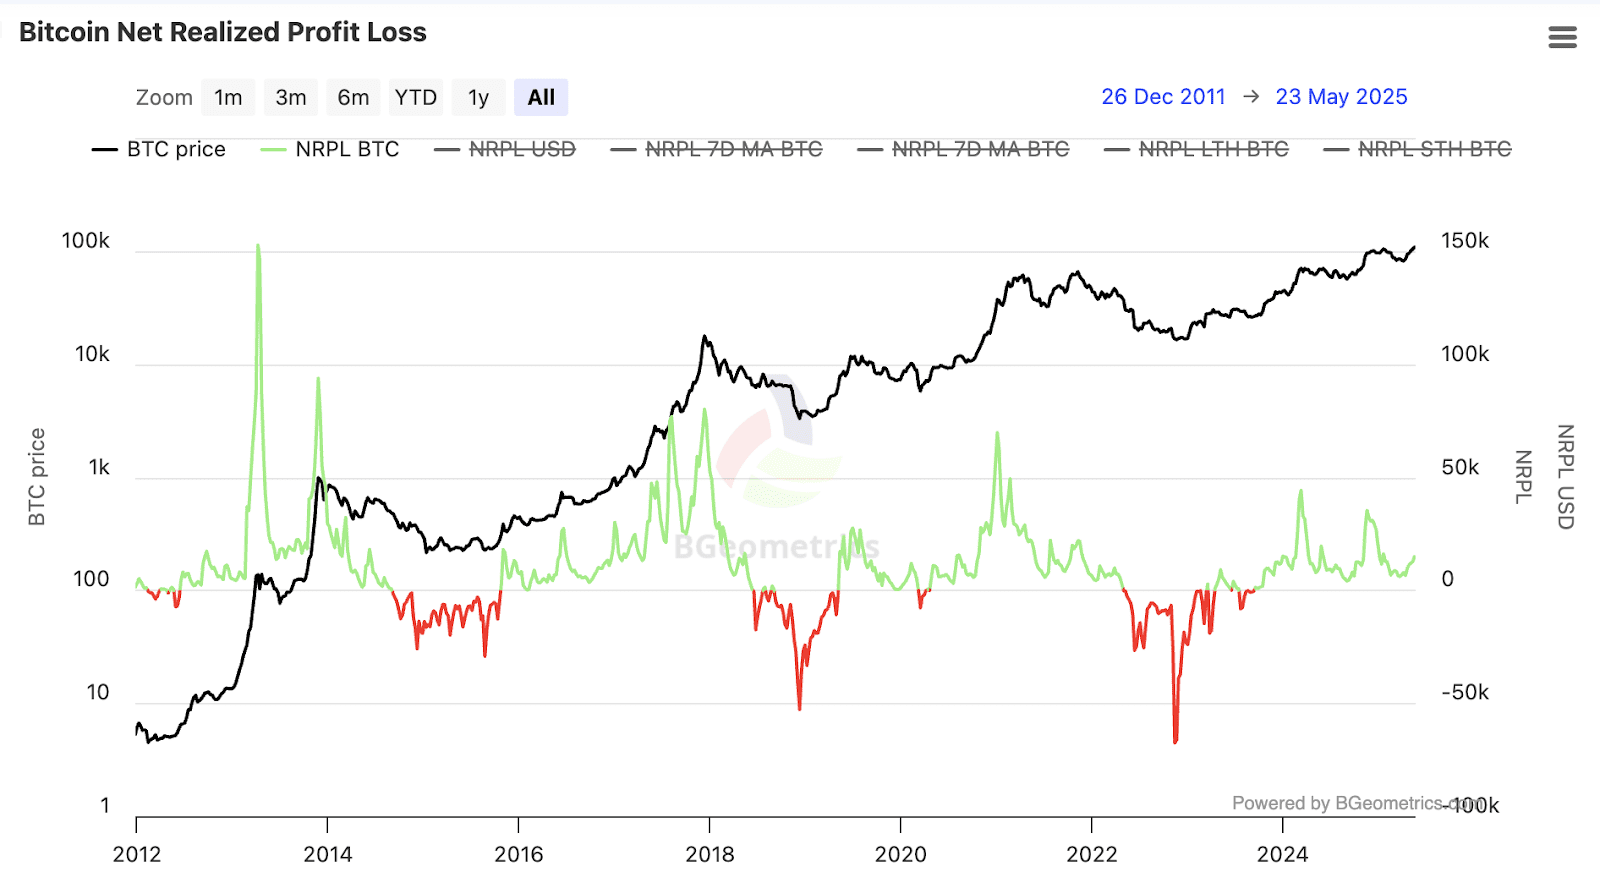
Bitcoin Net Realized Profit/Loss | Source: BGeometrics
The current reading of the metric shows small positive spikes, meaning traders are realizing gains but at a relatively low volume compared to previous cycle tops in 2018, 2021 and 2022.
Could Bitcoin re-test its all-time high?
Bitcoin is currently trading less than 3% away from its all-time high. If Bitcoin sees a daily candlestick close above this level could pave the way toward the 127.2% Fibonacci retracement level, measured from the April 7 low of $74,508 to the all-time high of $111,980.
BTC would need a 12% rally to reach the 127.2% Fibonacci projection at $122,172. On the downside, $108,000 is a key support level for Bitcoin. The Fair Value Gap between $97,732 and $102,315 is another key support zone on the daily price chart.
The Moving Average Convergence Divergence (MACD) indicator shows an underlying negative momentum in Bitcoin’s price trend and Relative Strength Index (RSI) reads 65, sloping upwards.
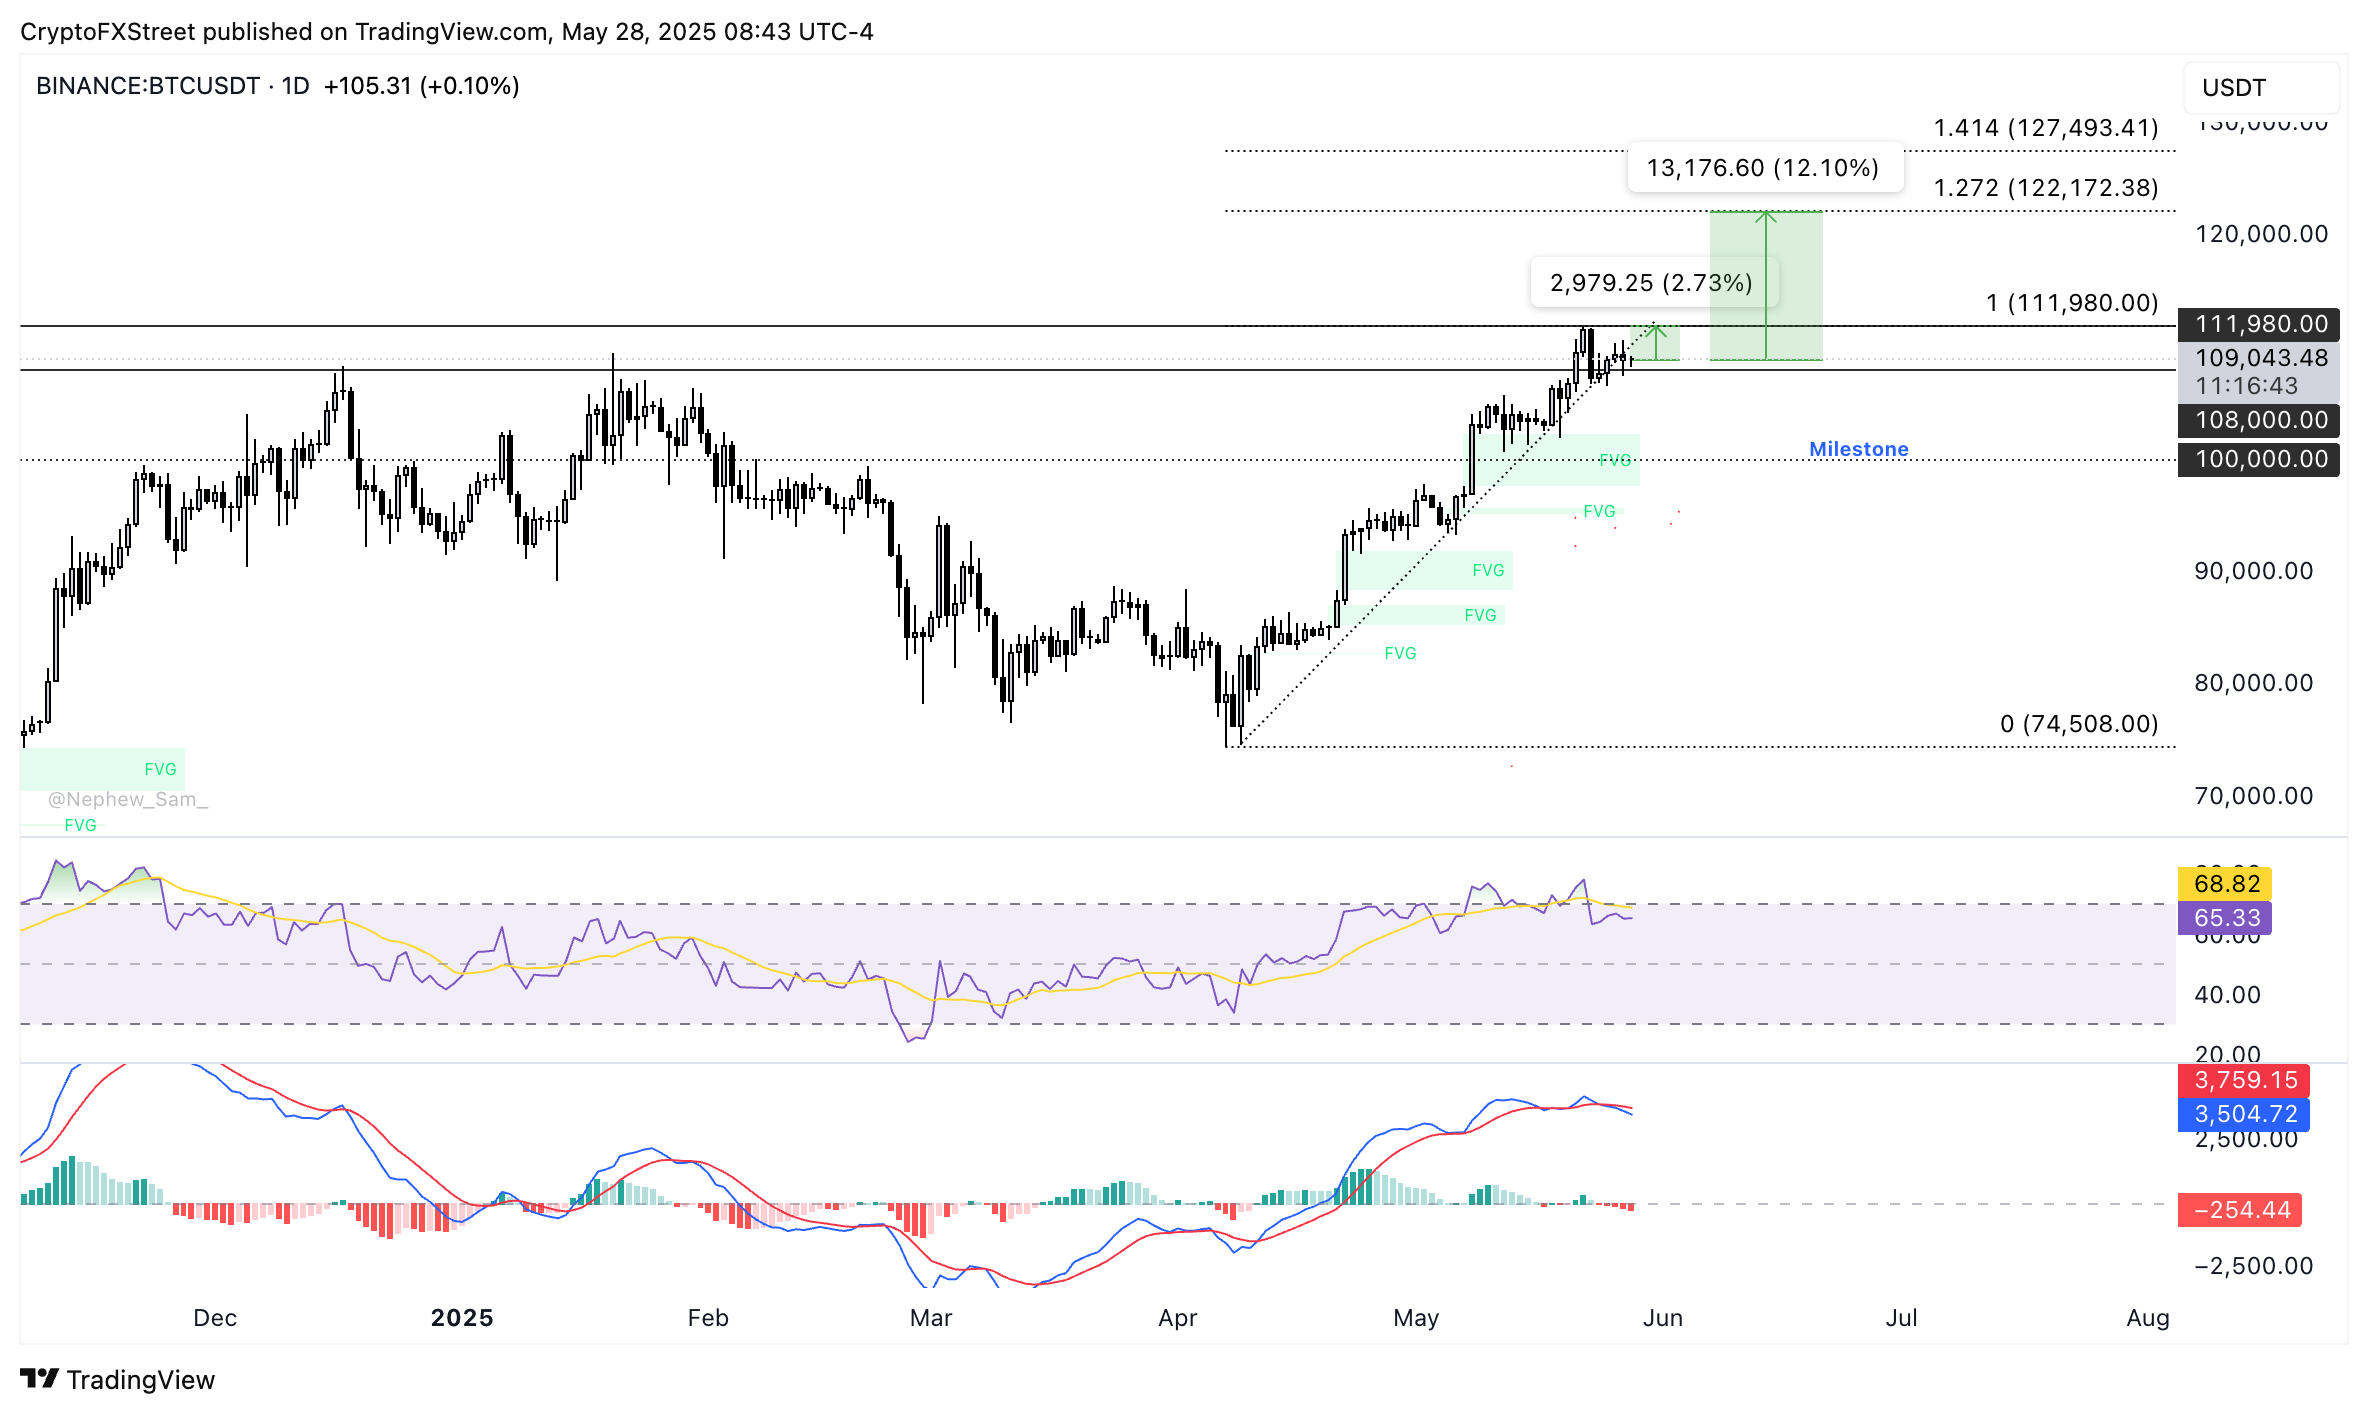
BTC/USDT daily price chart | Source: TradingView
Over 98% of wallet addresses holding Bitcoin are currently profitable as BTC trades above $108,000, according to IntoTheBlock data.
บทความแนะนำ


