Monero Price Forecast: XMR declines as on-chain metrics signal overheating and renewed selling pressure

แหล่งที่มา Fxstreet
  • Monero price fell by 8% on Wednesday, following an 11% decline over the last two days.
  • On-chain data paint a bearish picture as XMR Spot CVD shows sell-side dominance and retail activity overheating.
  • The technical outlook suggests a continuation of the correction targeting the $302.4 mark.

Monero (XMR) fell by more than 8% on Wednesday, following a sharp decline over the last two days. On-chain data supports the bearish thesis, as XMR’s Spot CVD indicates sell-side dominance and overheating conditions among retail investors. The technical outlook suggests weakness and continuation of correction.

Monero’s on-chain metrics show a bearish bias 

CryptoQuant data, as shown in the graph below, highlights selling pressure on Monero. The Taker CVD (Cumulative Volume Delta) for XMR has been red and has increased since early May. This indicator measures the cumulative difference between market buy and sell volumes over three months. When 90-day CVD is positive (green) and increasing, it suggests the Taker Buy Dominant Phase, while a negative (red) and decreasing value indicates the Taker Sell Dominant Phase.

XMR Spot Taker CVD chart. Source: CryptoQuant

XMR Spot Taker CVD chart. Source: CryptoQuant

Another bearish outlook is CryptoQuant’s Futures Retail Activity Through Trading Frequency Surge data, which shows the overheating conditions. This metric measures the activity level of retail investors in XMR based on their trading frequency. High retail activity indicates that retail traders are flooding into the market, often chasing price movements, which can signal local tops.

XMR Futures Retail Activity Through Trading Frequency Surge Source: CryptoQuant

XMR Futures Retail Activity Through Trading Frequency Surge Source: CryptoQuant

XMR summary chart. Source: CryptoQuant

XMR summary chart. Source: CryptoQuant

Monero Price Forecast: XMR bears take control 

Monero price has rallied by more than 55% since early May. A correction generally follows after such a massive rally. At the start of this week on Monday, XMR faced a pullback of more than 11% until the next day. At the time of writing on Wednesday, it continues to trade down by 8% at around $338.73

If XMR continues its correction, it could extend the decline to retest its 50% price retracement at $303.61, drawn from the April low of $185.93 to the May high of $420.08.

The Relative Strength Index (RSI) on the daily chart reads 49, sharply rejecting its overbought level of 70, and slips below its neutral value of 50, indicating strong bearish momentum. The Moving Average Convergence Divergence (MACD) also showed a bearish crossover, further supporting the bearish conditions.
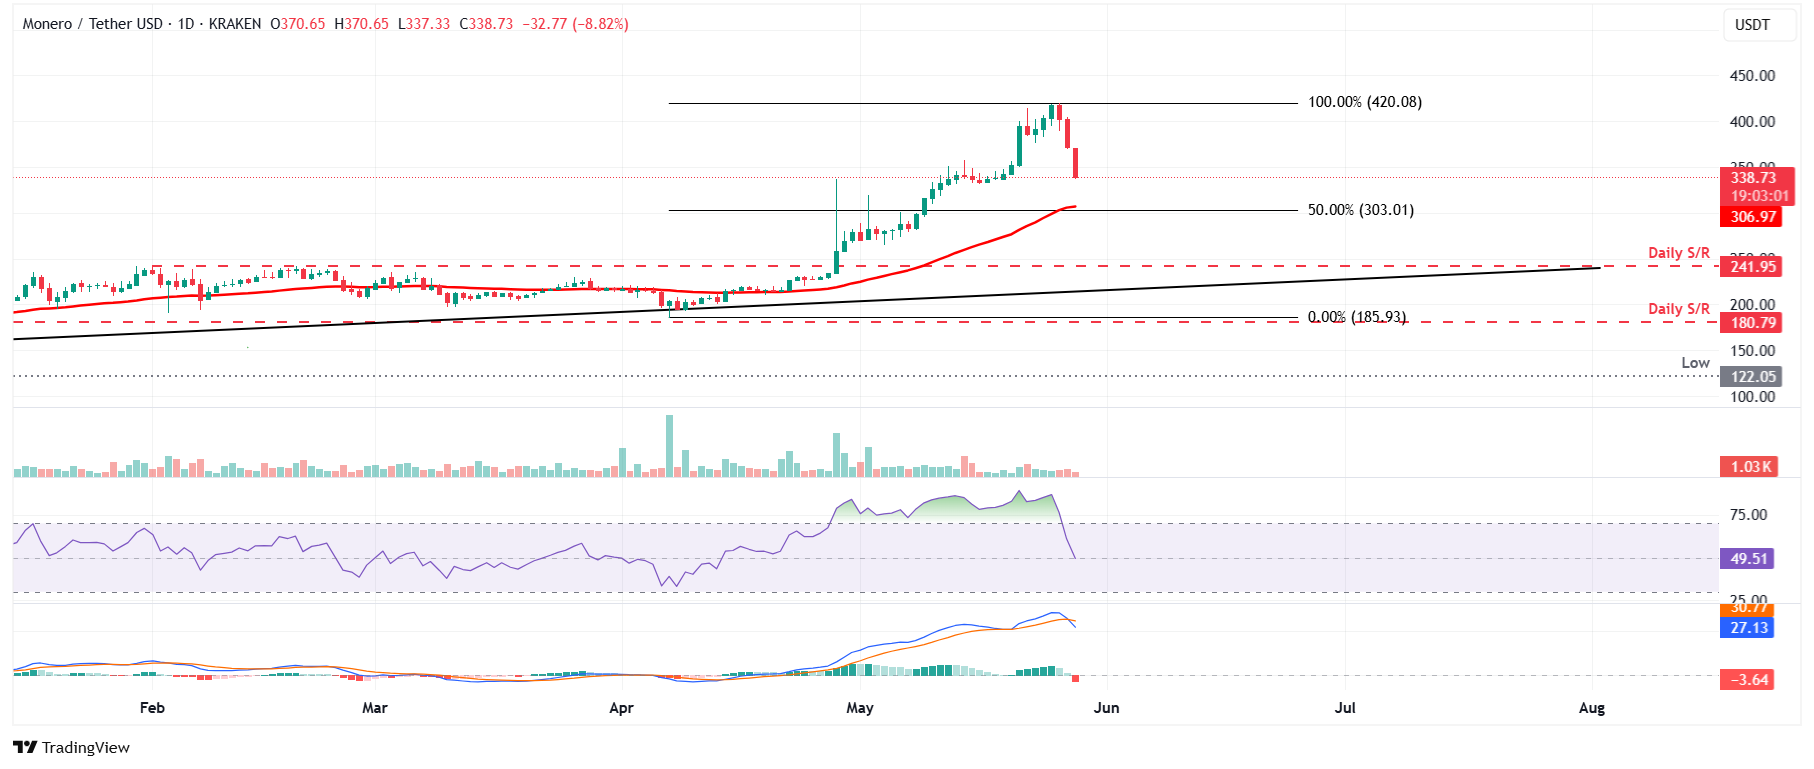
XMR/USDT daily chart

XMR/USDT daily chart

However, if XMR recovers, it could extend the recovery to retest its recent high of $420.

ข้อจำกัดความรับผิดชอบ: เพื่อการอ้างอิงเท่านั้น ผลการดำเนินงานในอดีตไม่ได้บ่งบอกถึงผลลัพธ์ในอนาคต
placeholder
EUR/USD แข็งค่าขึ้นเหนือ 1.1400 หลังทรัมป์เลื่อนการเก็บภาษี 50% ต่อสหภาพยุโรปไปเป็นวันที่ 9 กรกฎาคมในช่วงเช้าของตลาดลงทุนยุโรปวันจันทร์ คู่ EURUSD ปรับตัวขึ้นใกล้ระดับ 1.1415 เงินยูโร (EUR) แข็งค่าขึ้นเมื่อเทียบกับเงินดอลลาร์สหรัฐ (USD) เนื่องจากประธานาธิบดีสหรัฐฯ โดนัลด์ ทรัมป์ ขยายกำหนดเวลาสำหรับภาษี 50% ของสหภาพยุโรปออกไปจนถึงวันที่ 9 กรกฎาคม
ผู้เขียน  FXStreet
5 เดือน 26 วัน จันทร์
ในช่วงเช้าของตลาดลงทุนยุโรปวันจันทร์ คู่ EURUSD ปรับตัวขึ้นใกล้ระดับ 1.1415 เงินยูโร (EUR) แข็งค่าขึ้นเมื่อเทียบกับเงินดอลลาร์สหรัฐ (USD) เนื่องจากประธานาธิบดีสหรัฐฯ โดนัลด์ ทรัมป์ ขยายกำหนดเวลาสำหรับภาษี 50% ของสหภาพยุโรปออกไปจนถึงวันที่ 9 กรกฎาคม
placeholder
การคาดการณ์ราคาเงิน: XAG/USD ยังคงขาดทุนต่ำกว่า $33.50 เนื่องจากความต้องการที่หลบภัยลดลงราคาโลหะเงิน (XAG/USD) ปรับตัวลดลงหลังจากที่เคยปรับตัวขึ้นในสองเซสชันก่อนหน้า โดยซื้อขายอยู่ที่ประมาณ 33.40 ดอลลาร์ต่อออนซ์ในช่วงเช้าของวันอังคารในเอเชีย
ผู้เขียน  FXStreet
21 ชั่วโมงที่แล้ว
ราคาโลหะเงิน (XAG/USD) ปรับตัวลดลงหลังจากที่เคยปรับตัวขึ้นในสองเซสชันก่อนหน้า โดยซื้อขายอยู่ที่ประมาณ 33.40 ดอลลาร์ต่อออนซ์ในช่วงเช้าของวันอังคารในเอเชีย
placeholder
AUD/USD ถอยตัวก่อนการเปิดเผย CPI ของออสเตรเลียและรายงานการประชุม FOMC ของสหรัฐฯเงินดอลลาร์ออสเตรเลีย (AUD) กำลังเผชิญกับแรงกดดันครั้งใหม่เมื่อเทียบกับเงินดอลลาร์สหรัฐ (USD) ในวันอังคาร ขณะที่เงินดอลลาร์กลับมาฟื้นตัวทั่วทั้งตลาดหลังจากข้อมูลเศรษฐกิจสหรัฐที่หลากหลายและการฟื้นตัวของสภาพคล่องในตลาด
ผู้เขียน  FXStreet
เมื่อวาน 01: 51
เงินดอลลาร์ออสเตรเลีย (AUD) กำลังเผชิญกับแรงกดดันครั้งใหม่เมื่อเทียบกับเงินดอลลาร์สหรัฐ (USD) ในวันอังคาร ขณะที่เงินดอลลาร์กลับมาฟื้นตัวทั่วทั้งตลาดหลังจากข้อมูลเศรษฐกิจสหรัฐที่หลากหลายและการฟื้นตัวของสภาพคล่องในตลาด
placeholder
ราคาทองคำดูเหมือนจะเปราะบางต่ำกว่า $3,300 ท่ามกลางความแข็งแกร่งของดอลลาร์สหรัฐที่ค่อนข้างจำกัดราคาทองคำ (XAU/USD) ดิ้นรนเพื่อใช้ประโยชน์จากการปรับตัวขึ้นเล็กน้อยในช่วงตลาดลงทุนเอเชีย และขณะนี้ซื้อขายอยู่ต่ำกว่าระดับ $3,300 ใกล้กับจุดต่ำสุดรายสัปดาห์ที่แตะเมื่อวันก่อน
ผู้เขียน  FXStreet
23 ชั่วโมงที่แล้ว
ราคาทองคำ (XAU/USD) ดิ้นรนเพื่อใช้ประโยชน์จากการปรับตัวขึ้นเล็กน้อยในช่วงตลาดลงทุนเอเชีย และขณะนี้ซื้อขายอยู่ต่ำกว่าระดับ $3,300 ใกล้กับจุดต่ำสุดรายสัปดาห์ที่แตะเมื่อวันก่อน
placeholder
ราคาน้ำมัน WTI เพิ่มขึ้นเหนือ $62.00 ขณะที่ OPEC+ รักษาโควตาน้ำมันน้ำมันดิบเวสต์เทกซัสอินเตอร์มีเดียต (WTI) ซึ่งเป็นเกณฑ์มาตรฐานน้ำมันดิบของสหรัฐฯ ซื้อขายอยู่ที่ประมาณ 62.15 ดอลลาร์ในช่วงเวลาการซื้อขายของเอเชียในวันพฤหัสบดี ราคา WTI ขยับสูงขึ้นจากความกังวลเกี่ยวกับอุปทานหลังจาก OPEC+ ตกลงที่จะคงนโยบายการผลิตไว้ไม่เปลี่ยนแปลง
ผู้เขียน  FXStreet
3 ชั่วโมงที่แล้ว
น้ำมันดิบเวสต์เทกซัสอินเตอร์มีเดียต (WTI) ซึ่งเป็นเกณฑ์มาตรฐานน้ำมันดิบของสหรัฐฯ ซื้อขายอยู่ที่ประมาณ 62.15 ดอลลาร์ในช่วงเวลาการซื้อขายของเอเชียในวันพฤหัสบดี ราคา WTI ขยับสูงขึ้นจากความกังวลเกี่ยวกับอุปทานหลังจาก OPEC+ ตกลงที่จะคงนโยบายการผลิตไว้ไม่เปลี่ยนแปลง
goTop
quote