


WEN, JUP: Two altcoins are driving Solana price recovery
- Solana price is making a comeback with a V-shaped recovery rally in the works.
- WEN token airdrop and its association with Jupiter DEX’s JUP token provide tailwinds for Solana.
- SOL could extend the climb 15% into the supply zone amid rising momentum and resurfacing bulls.
- The bullish thesis will be invalidated if the L1 token breaks and closes below $89.02 support.
Solana (SOL) price is making a comeback, indicated by a developing V-shaped recovery after a 25% fall that began on January 18. However, this move north hinges on hype around two altcoins built atop the Solana blockchain, making it critical for traders to exercise caution.
Also Read: SOL price could find inflection here as Solana Saga phone presale orders reach 40,000
Solana price recovers on the wings of these two altcoins
Solana (SOL) price is up 25% since bottoming out at $79.00, the intraday low of the January 23 trading session. The surge comes on the back of the Wen (WEN) airdrop, planned to reach a million wallet addresses. Reports indicate that the WEN airdrop has completed claiming event with no more emissions expected and over 25% of the total supply to be locked away forever.
The WEN token made its way into the Solana blockchain on January 26, with the Wen Foundation debuting a community coin alongside a new NFT standard - WNS 0.0. For the duration of Wen's upbringing, the network emitted WEN to the community via the claim function. Now, there are no more emissions and over 1/4 of the total supply will be burned forever.
In hindsight, considering the WEN token was launched on Solana-based decentralized exchange Jupiter, the airdrop mechanism was strategic. It was not only intended to expand the ecosystem but also to bolster the performance of Jupiter DEX, and its native token, JUP.
The one million wallet address that merited the airdrop selection criteria must have passed these thresholds:
- Used Jupiter in the last 6 months
- Are Solana Saga phone owners
- Own top Solana-based NFT collections
In the latest, the Jupiter’s JUP token has secured a listing on Bitfinex, marking the fourth centralized exchange to list the altcoin, including Bybit, XT.com and Bilaxy. The token is expected for trading on Bitfinex beginning January 31.
Hype around the JUP listing and WEN airdrop has provided tailwinds for the Solana price with both tokens associated with the SOL blockchain.
Solana price outlook
Amid hype around the WEN and JUP tokens, Solana price continues to push north, steered by rising momentum indicated by the climbing Relative Strength Index (RSI). The bulls are also resurfacing, evidenced by the histogram bars of the Awesome Oscillator (AO) flashing green as they edge toward positive territory.
A closer look at the Moving Average Convergence Divergence (MACD) also reveals a bullish crossover, which happened when the MACD crossed above the signal line (orange band).
Increased buying pressure above current levels could see the Solana price extend north into the supply zone between $107.92 and $121.19. To confirm the continuation of the intermediate trend, however, the Layer 1 (L1) token’s market value must record a candlestick close above the midline of the order block at $114.76.
In a highly bullish case, Solana price could extend the climb past the $126.36 range high, a move that would render the supply zone into a bullish breaker.
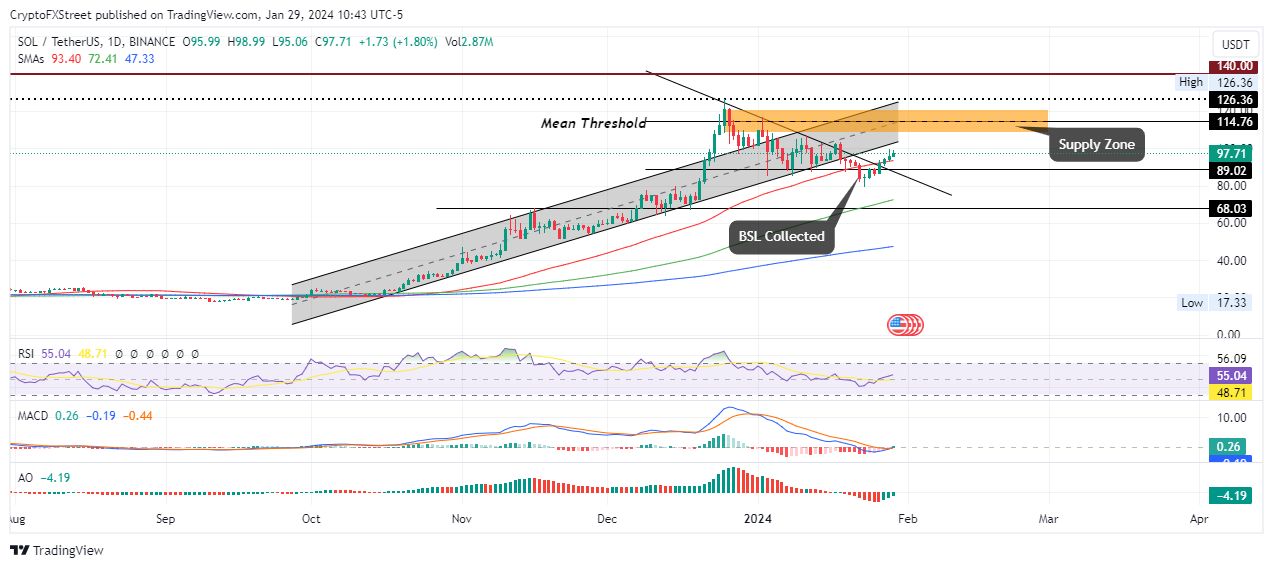
SOL/USDT 1-day chart
On the flipside, if traders book profits for the 25% gain made so far, the Solana price could pull south with the potential to lose all the ground covered. This could see SOL lose the support due to the 50-day Simple Moving Average (SMA) at $93.46, or lower, revisiting the $89.02 support level.
In a dire case, the dump could send Solana price all the way to the 100-day SMA at $72.44 before a possible retest of the $68.03 buyer congestion level, 32% below current levels.
Also Read:Unibot boosts token value with Solana ecosystem draw
บทความแนะนำ


