


Crypto Today: Bitcoin, Ethereum, XRP regain strength as US Treasury doubles down on buybacks
- Bitcoin edges higher toward $80,000 as market participants await the US Treasury announcement on the scale of additional long-end buybacks.
- Ethereum reclaims $2,500 as the path of least resistance stays upward, supported by uptrending moving averages.
- XRP extends gains for a second straight day, underpinned by a bullish RSI and robust support at the 200-day EMA.
Bitcoin (BTC) is trending higher alongside other major cryptocurrencies on Wednesday. Ethereum (ETH) has reclaimed $2,500 as short-term support, raising the odds that the uptrend will gain momentum. Meanwhile, Ripple (XRP) shows signs of recovery, trading near $1.44 while supported by key moving averages.
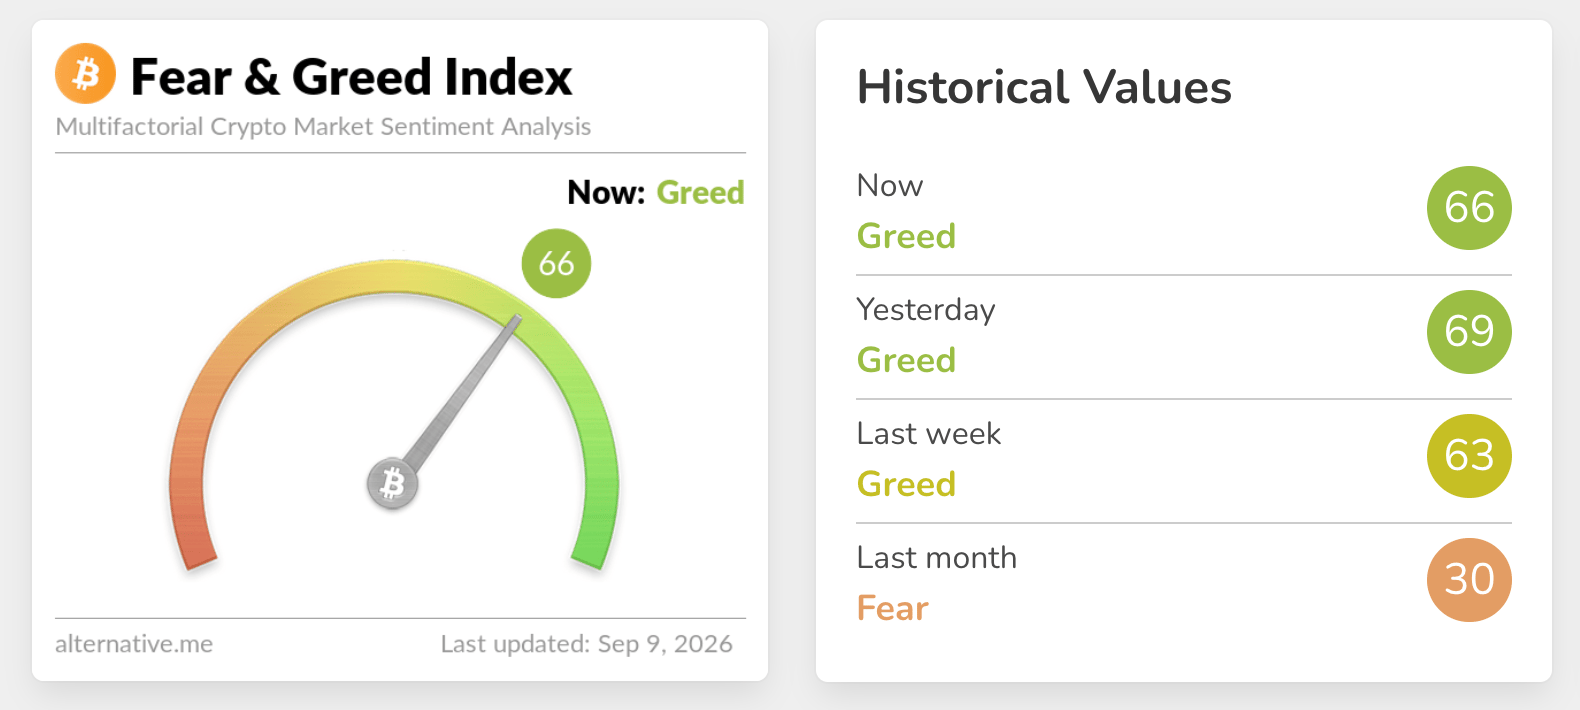
Appetite for risk assets remains elevated, with the crypto Fear & Greed Index at 66 in the Greed territory on Wednesday, down marginally from 69 the day before. If sustained, risk-on sentiment would continue to boost demand for digital assets, providing a much-needed tailwind to support bullish momentum.
US Treasury to announce extent of buyback scale
The United States (US) Treasury is set to announce the scale of its long-dated buyback amid its commitment to at least double the maximum amount it can purchase, as stated in an August release.
At prevailing auction volumes, the Treasury is set to issue approximately $924 billion in nominal 10-30-year securities annually, with allocations of about $480 billion in 10-year notes, $168 billion in 20-year bonds, and $276 billion in 30-year bonds.
When the change was announced last month, markets responded positively with Bitcoin rallying above $80,000. Altcoins, including Ethereum and XRP, also reacted with sharp price increases, shifting the trend from bearish toward neutral and bullish.
The announcement on the buyback scale later on Wednesday could trigger a resumption of gains, reinforcing the bullish grip as investors adopt a risk-on stance. However, traders should temper expectations, as the recent rally could be overextended, reducing the odds of a similar rally to August.
Technical analysis: Bitcoin advances toward $80,000
Bitcoin trades at $79,480, extending its advance well above the main Exponential Moving Averages (EMA) and keeping a constructive near-term bias. Momentum remains mixed, with the Relative Strength Index (RSI) at 62 still in positive territory while the Moving Average Convergence Divergence (MACD) stays negative with a weak line reading, suggesting upside pressure persists but may be losing some traction after the recent surge.
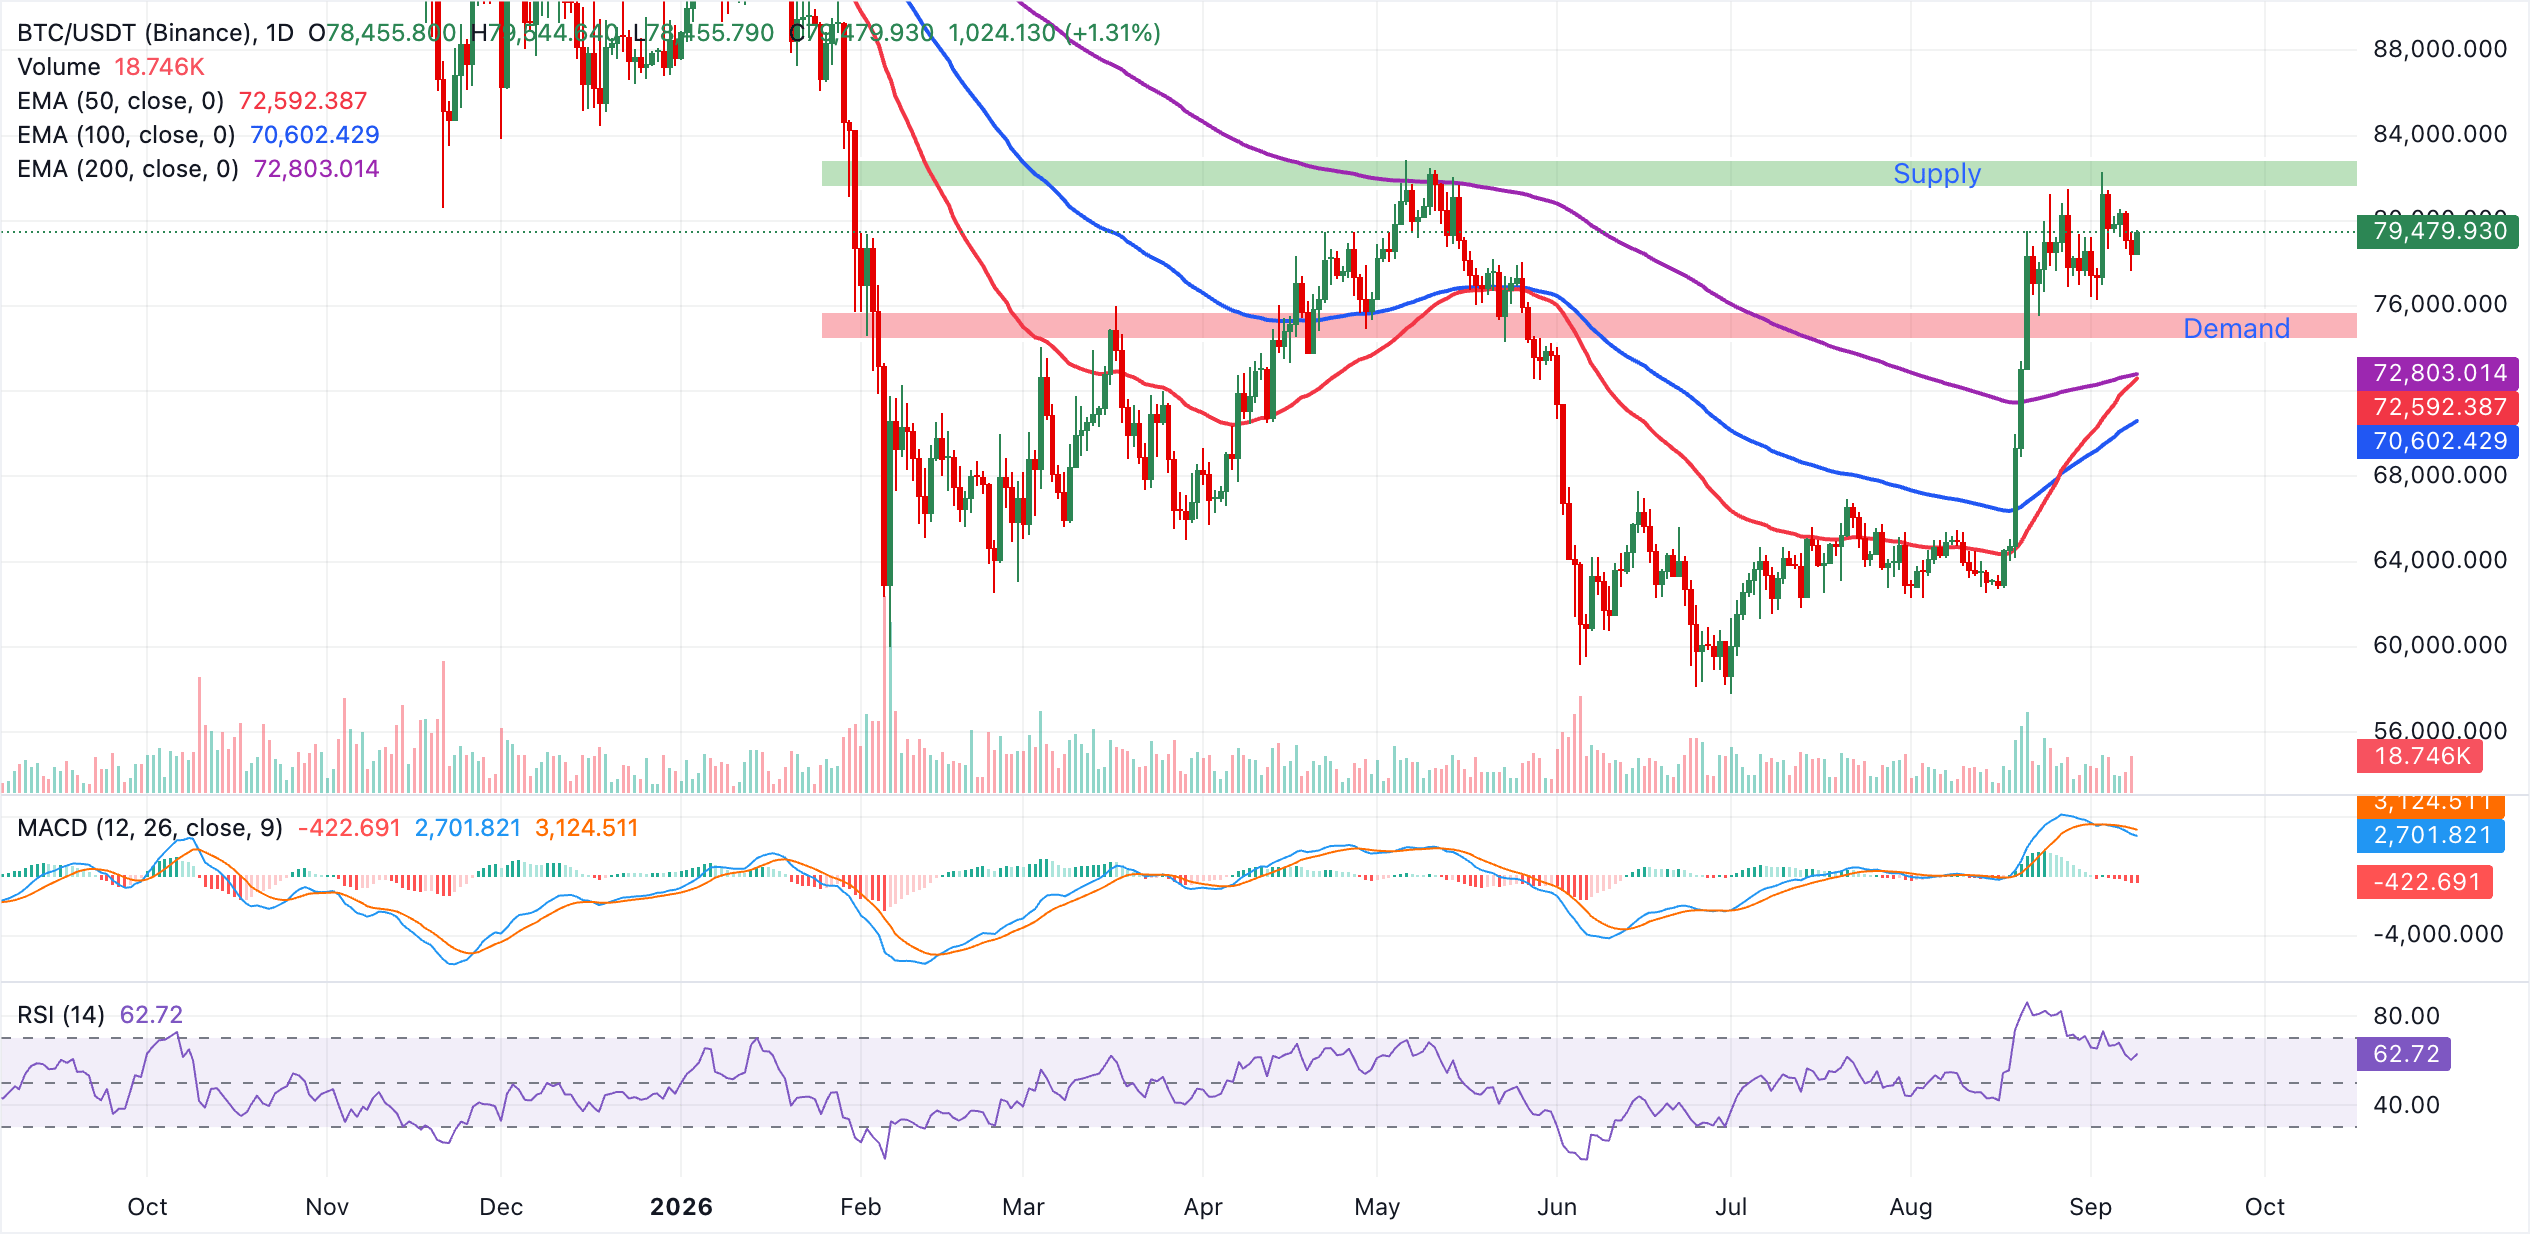
Immediate support is defined by the current pivot area around $79,480, ahead of a dense EMA cluster that starts with the 200-day EMA at $72,803 and the nearby 50-day EMA at $72,592, followed lower by the 100-day EMA at $70,602.
A corrective pullback toward this moving-average band would likely be viewed as a test of underlying demand rather than a structural breakdown as long as price holds above the 200-day EMA, while the absence of any overhead technical levels in the current dataset leaves upside exploration dependent mainly on momentum dynamics and market flows rather than clearly mapped resistance.
Altcoins technical outlook: Ethereum and XRP build recovery momentum
Ethereum trades at $2,518, extending its advance well above the key EMAs. Meanwhile, price holds decisively above the 50-day EMA at $2,216, the 100-day EMA at $2,110, and the 200-day EMA at $2,180, which collectively underpin a bullish near-term bias despite recent consolidation.
The RSI at 65 sits in positive territory without yet signaling overbought extremes, suggesting that buyers retain control, while the MACD indicator remains negative, hinting that upside momentum is constructive but not aggressive.
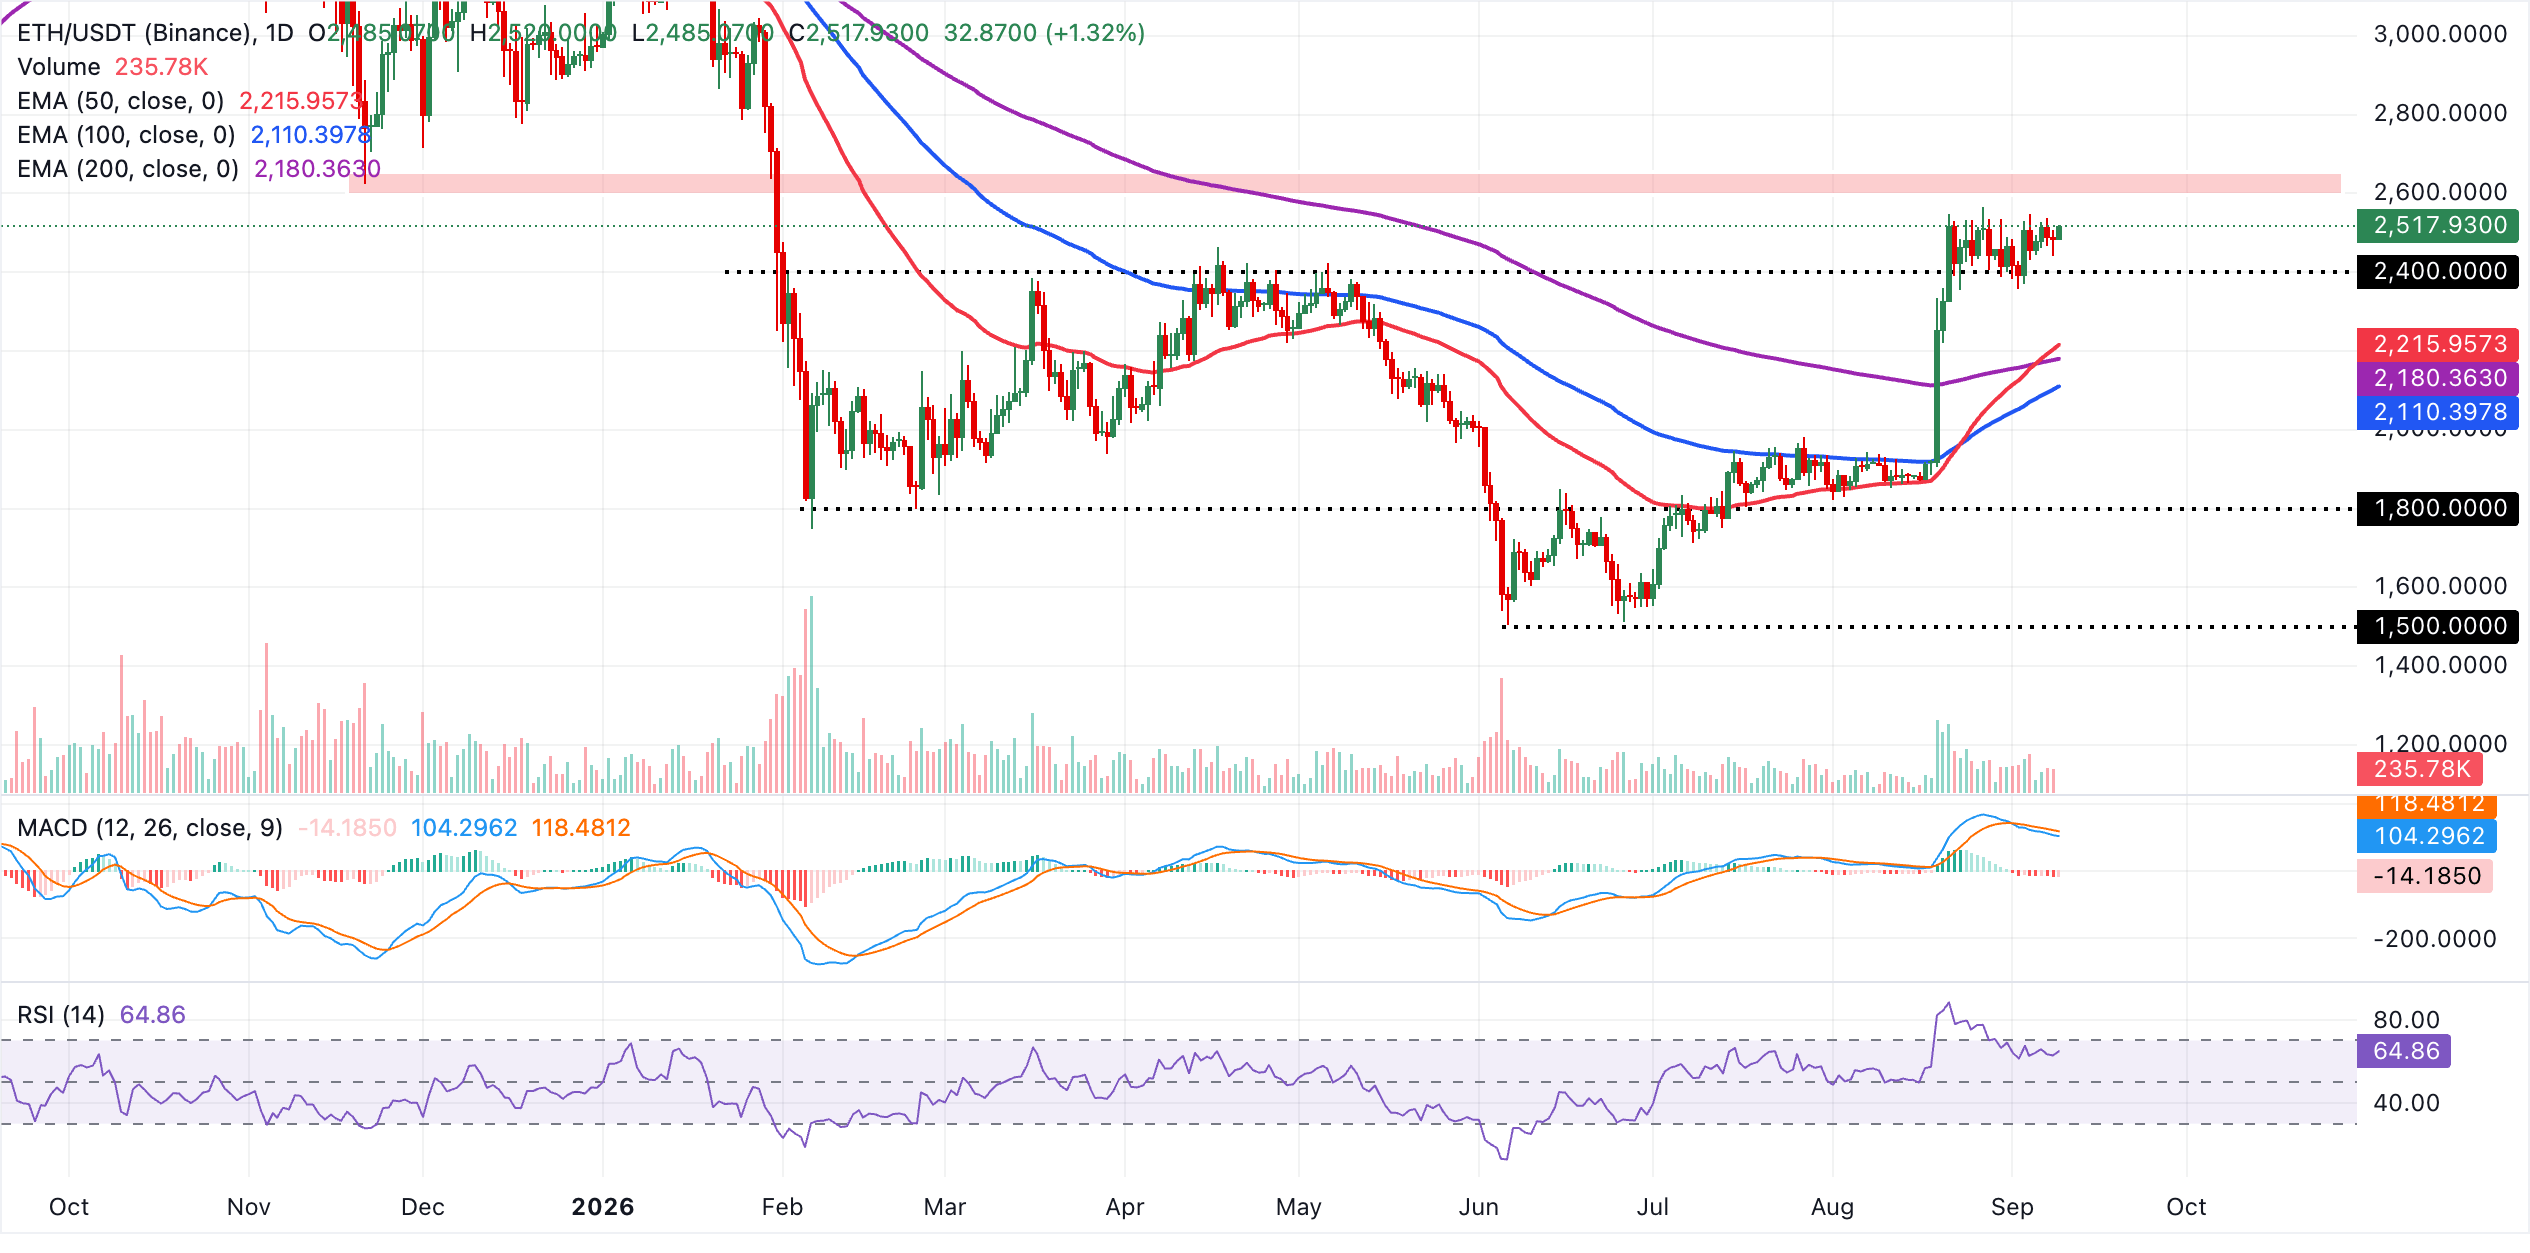
Initial support is seen at the current price area around $2,518, where short-term demand has been absorbing pullbacks. Below that, the 50-day EMA at $2,216 forms the next key floor, followed by the 200-day EMA at $2,180 and the 100-day EMA at $2,110, which together define a broad structural support zone that would need to be broken to threaten the prevailing bullish outlook.
As for XRP, the token trades near $1.44, holding a constructive bullish bias as price remains well above the 50-day and 100-day EMAs at 1.2663 and $1.24. The pair has extended its advance after the recent breakout, although the 200-day EMA at $1.36, now left behind as support turned to resistance, highlights how far price has stretched in the latest leg.
The RSI at 62 stays in positive territory without yet signaling overbought conditions, while the MACD indicator turns lower below the zero line, hinting that upside momentum may be losing some steam after the sharp rally.
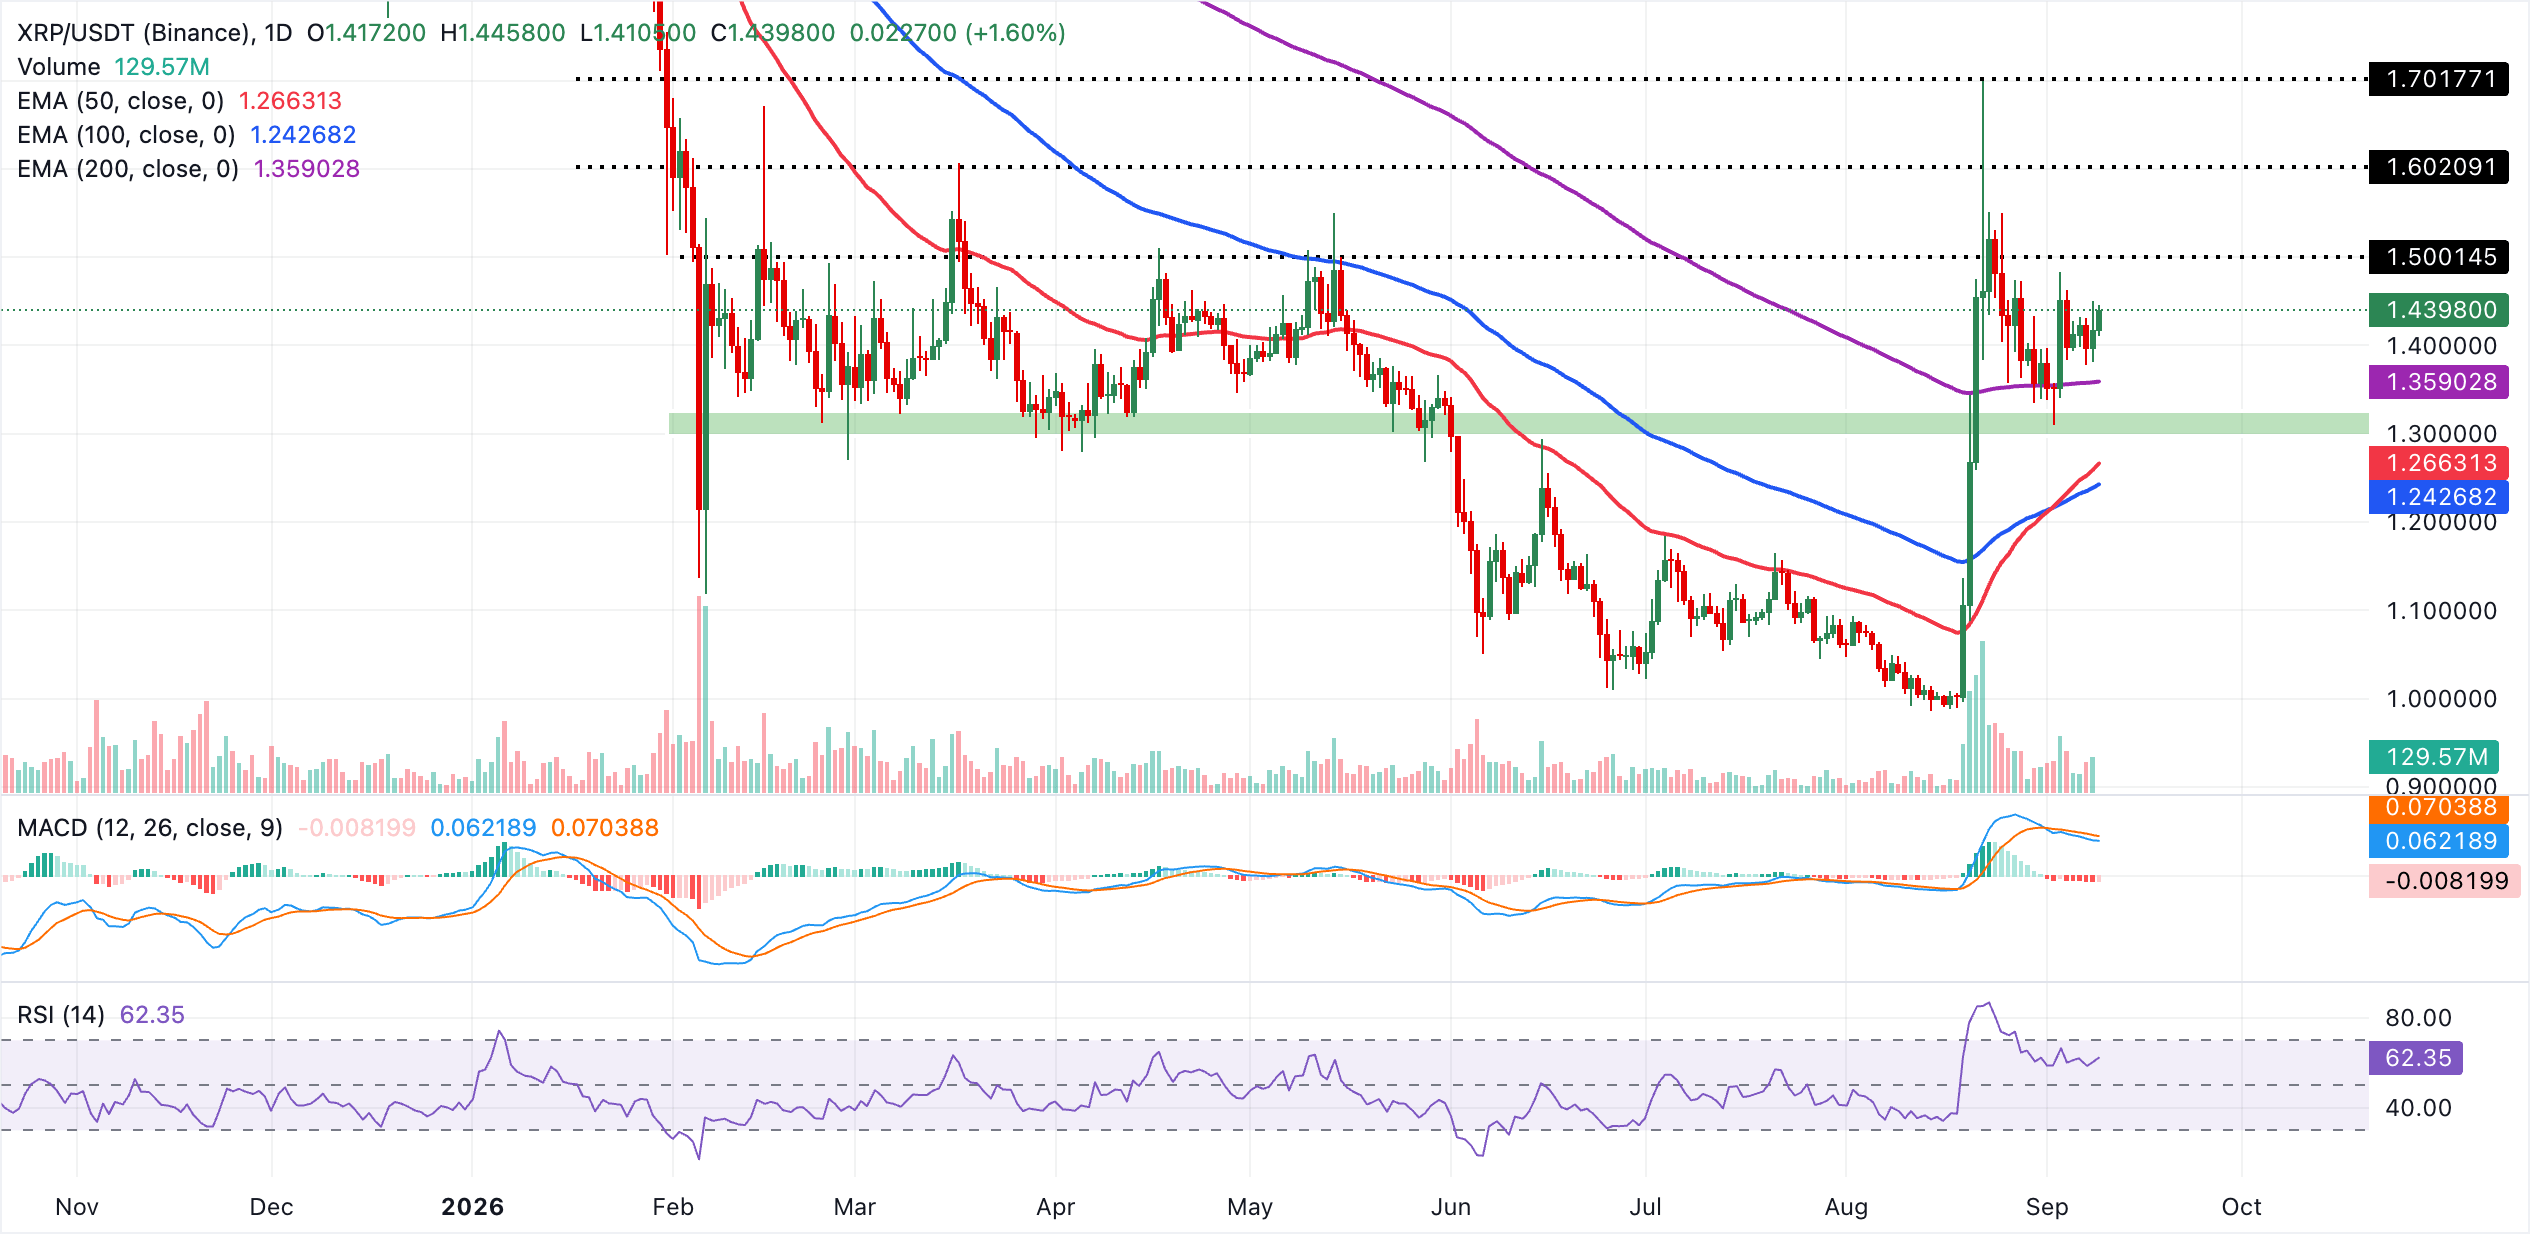
On the downside, initial support is aligned with the 50-day EMA at $1.27, with the 100-day EMA at $1.24 reinforcing a broader demand area on deeper pullbacks. On the topside, the next key resistance is at psychological levels of $1.50, $1.60, and $1.70, respectively. Breaking above these key levels would reinforce the bullish grip and raise the odds of a recovery above $2.00.
(The technical analysis of this story was written with the help of an AI tool. Know more.)
Cryptocurrency prices FAQs
Token launches influence demand and adoption among market participants. Listings on crypto exchanges deepen the liquidity for an asset and add new participants to an asset’s network. This is typically bullish for a digital asset.
A hack is an event in which an attacker captures a large volume of the asset from a DeFi bridge or hot wallet of an exchange or any other crypto platform via exploits, bugs or other methods. The exploiter then transfers these tokens out of the exchange platforms to ultimately sell or swap the assets for other cryptocurrencies or stablecoins. Such events often involve an en masse panic triggering a sell-off in the affected assets.
Macroeconomic events like the US Federal Reserve’s decision on interest rates influence crypto assets mainly through the direct impact they have on the US Dollar. An increase in interest rate typically negatively influences Bitcoin and altcoin prices, and vice versa. If the US Dollar index declines, risk assets and associated leverage for trading gets cheaper, in turn driving crypto prices higher.
Halvings are typically considered bullish events as they slash the block reward in half for miners, constricting the supply of the asset. At consistent demand if the supply reduces, the asset’s price climbs.
บทความแนะนำ


