

BRETT price prediction 2026-2032: IS BRETT a good investment?
Key Takeaway:
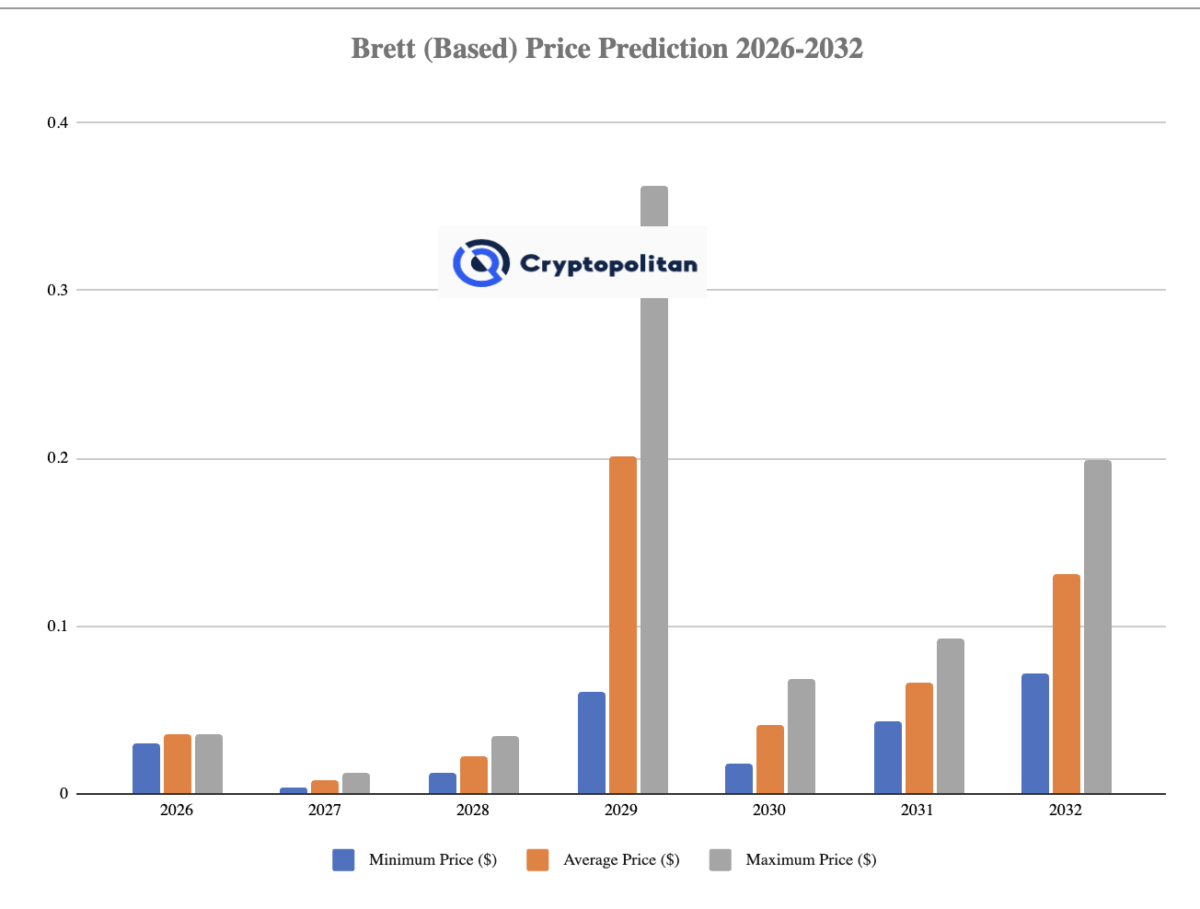
- BRETT’s 2026 projection suggests a peak value of $0.0357
- By 2029, BRETT’s prediction indicates a maximum price of $0.3623
- By 2032, BRETT is expected to trade between $0.0712 and $0.1984
BRETT, or Based Brett, is a meme cryptocurrency launched in February 2024 on the Base blockchain, an Ethereum Layer 2 solution.
Inspired by the character Brett from Matt Furie’s “Boys’ Club” comic series, BRETT aims to engage users through humor and community interaction. It has quickly gained popularity, boasting a market cap exceeding $1 billion and a total supply of 10 billion tokens, with a fixed supply ensuring scarcity.
BRETT operates on a renounced contract, meaning the creator cannot alter its supply or functionality, fostering a decentralized governance model driven by community engagement.
The token does not impose transaction fees, making it attractive for trading and long-term holding. Its cultural significance and partnerships in decentralized finance enhance its utility and value in the crypto space.
Overview
| Cryptocurrency | Brett (Based) |
| Token | BRETT |
| Price | $0.008471 |
| Market Cap | $84.71M |
| Trading Volume (24-hour) | $25.22 |
| Circulating supply | $9.99B BRETT |
| All-time High | $0.235 on Dec 01, 2024 |
| All-time Low | $0.01945 on Mar 19, 2024 |
| 24-h High | $0.00859 |
| 24-h Low | $0.007911 |
BRETT price prediction: Technical analysis
| Metric | Value |
| Price prediction | $ 0.006347 (-25.15%) |
| Volatility (30-day variation) | 7.32% (High) |
| 50-day SMA | $ 0.006906 |
| 14-Day RSI | 66.70 (Neutral) |
| 200-day SMA | $ 0.01305 |
| Sentiment | Neutral |
| Fear and Greed Index | 47 (Neutral) |
| Green days | 16/30 (53%) |
BRETT price analysis
BRETT/USD 1-day chart
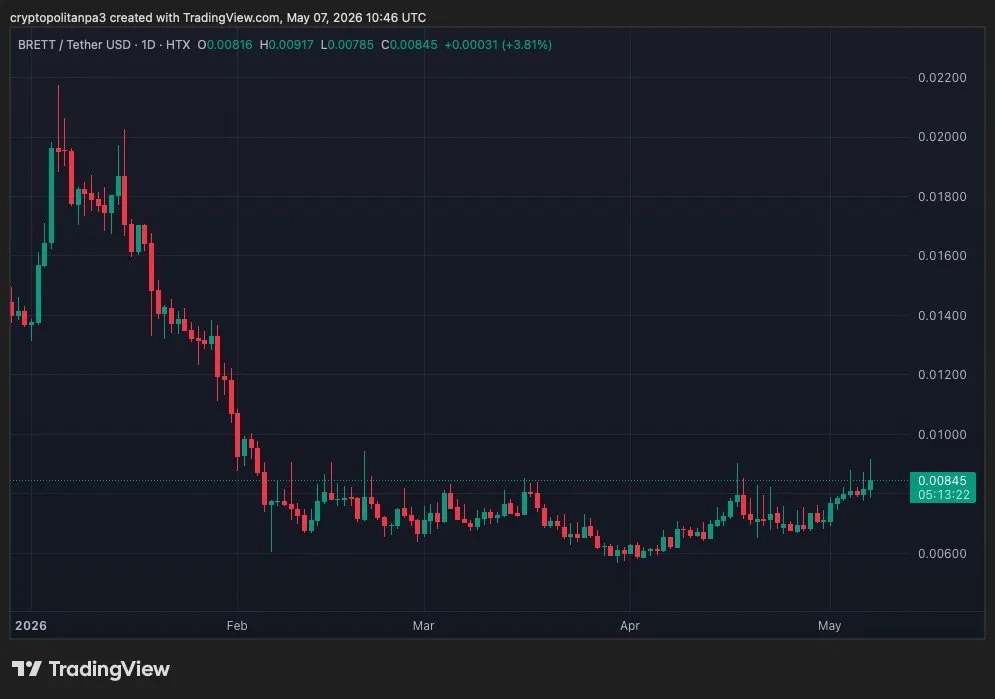
BRETTUSDchart by TradingView
Brett trades at $0.007556, up 4.47%, with the daily chart showing a gradually improving structure after months of devastation. Price peaked at $0.0220 in early January before a brutal 65% collapse to a February low of $0.0063. Since then, a slow base has been forming in a tight $0.0062–$0.0085 range. The RSI at 58.91 has crossed decisively above its signal line at 53.28 — the strongest RSI reading since January and the first genuine bullish momentum signal in months. Support at $0.0068–$0.0072. Resistance at $0.0078–$0.0085. A break above $0.0085 targets $0.0095–$0.0100. Structure is cautiously improving for the first time since the January collapse.
BRETT/USD 4-hour chart
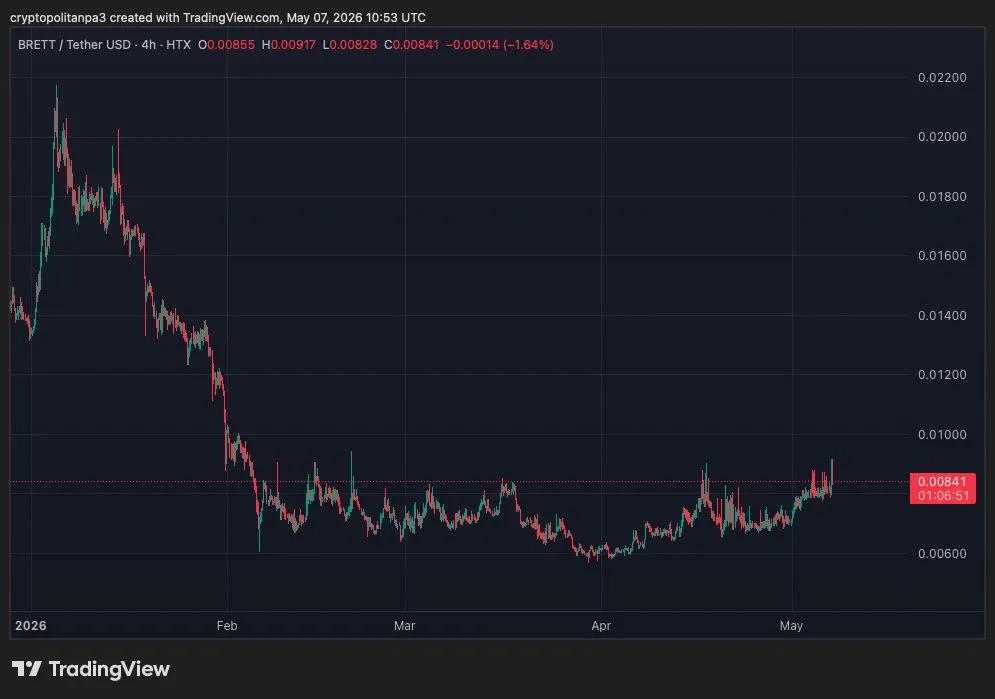
Brett trades at $0.007570, up 2.90%, with the 4H chart showing a mixed but slightly improving picture. Price collapsed from $0.0220 in January to a February low of $0.0063 before spending months grinding in a near-flat $0.0063–$0.0085 range. The MACD shows a modest bullish crossover with histogram at 0.000050 — weak but positive signal. Notably, Balance of Power at 0.75 is the most bullish reading visible across any token analyzed recently — buyers are strongly dominating individual candles right now. Support at $0.0068–$0.0072. Resistance at $0.0078–$0.0085. A break above $0.0085 targets $0.0095+. Momentum is cautiously improving with buyers taking control.
BRETT technical Indicators: Levels and action
Daily simple moving average (SMA)
| Period | Value ($) | Action |
| SMA 3 | 0.008026 | BUY |
| SMA 5 | 0.008008 | BUY |
| SMA 10 | 0.007630 | BUY |
| SMA 21 | 0.007379 | BUY |
| SMA 50 | 0.006906 | BUY |
| SMA 100 | 0.007471 | BUY |
| SMA 200 | SELL |
Daily exponential moving average (EMA)
| Period | Value ($) | Action |
| EMA 3 | 0.008066 | BUY |
| EMA 5 | 0.007955 | BUY |
| EMA 10 | 0.007723 | BUY |
| EMA 21 | 0.007436 | BUY |
| EMA 50 | 0.007379 | BUY |
| EMA 100 | 0.009076 | BUY |
| EMA 200 | 0.01509 | SELL |
What can you expect from BRETT price analysis next?
Based on the current structure across both the daily and 4-hour charts, BRETT is at its most interesting technical position since the February selloff. The gradual formation of higher lows since April suggests smart money is quietly accumulating at these levels. The immediate battle is around the $0.00850 to $0.00900 resistance zone, which has rejected price multiple times. A decisive break above $0.00917 with strong volume would confirm a trend shift and open the path toward $0.01000 and $0.01200. However, if bulls fail to hold $0.00780, a deeper pullback toward $0.00700 and $0.00620 becomes likely. The broader crypto market recovery and Bitcoin’s strength remain the key external catalysts to watch closely.
Why is BRETT up today?
BRETT’s gains today are primarily macro-driven rather than token-specific. The total crypto market cap rose over 3.63% with aggregate derivatives open interest jumping nearly 15%, indicating renewed capital flowing back into the broader market and lifting high-beta assets like BRETT alongside it. Positive meme coin sector rotation is also playing a role, with several older Solana meme tokens posting explosive gains and creating a supportive backdrop that spills over into Base ecosystem tokens like BRETT. BRETT’s strong holder base of over 900,000 wallets and wide supply distribution, where top holders control just 0.3% of supply, reinforce its staying power during these risk-on market conditions.
Is BRETT a good investment?
BRETT cryptocurrency, a meme coin on the Base blockchain, has gained popularity due to its community-driven nature and fixed supply, which enhances scarcity. While it shows growth potential, especially through DeFi integrations, its value is highly speculative and influenced by market trends. Investors are strongly advised to exercise caution and conduct their research.
Will BRETT reach $1?
Based on the analysis’s critical prediction, it is unlikely to reach this milestone before 2030.
Will BRETT reach $5?
BRETT’s near-term goal of reaching $5 seems unlikely. Current predictions suggest it may peak at around $0.1088 by 2030, influenced by crypto market trends and community support.
Is Brett listed on Binance?
Brett Coin (BRETT) is currently not listed for trading on Binance. Although it remains available on other exchanges like Bybit, Gate.io, and KuCoin.
Does BRETT have a good long-term future?
BRETT is projected to range from $0.012 by 2027 to $0.068 by 2030, depending on market conditions and the adoption of the Base network. Its growth is expected to be influenced by cryptocurrency market trends and regulatory developments.
Recent news/ updates on BRETT
Based, Brett announced its launch as a MocaProof verifier in January 2026, with a $2,000 reward program for eligible $BRETT holders while adding $BRETT payments to the AIR Shop to expand real-world crypto usage.
Since then, BRETT’s sentiment remained at “Extreme Fear” throughout February–April 2026, with the token down 83% from its all-time high and trading near multi-month lows. No major partnerships, listings, or protocol updates were reported during this period.
BRETT price prediction May 2026
In 2026, Brett’s value is projected to average $0.0148. The price is anticipated to fluctuate between a low of $ 0.0054831 and a high of $ 0.0255.
| Price Prediction | Potential Low ($) | Average Price ($) | Potential High ($) |
| May 2026 | $0.0054831 | $0.0148 | 0.0255 |
BRETT price prediction 2026
The price of Brett (Based) is expected to reach a minimum of $0.0303 in 2026, a maximum of $0.0419, and an average trading price of $0.0357. This forecast is influenced by the token’s expanding Base network ecosystem, growing retail investor participation, and rising meme coin market activity, all of which support gradual value appreciation despite potential volatility in crypto sentiment.
| Price Prediction | Potential Low ($) | Average Price ($) | Potential High ($) |
| 2026 | $0.0303 | $0.0357 | $0.0419 |
BRETT price prediction 2027– 2032
| Year | Potential Low ($) | Average Price ($) | Potential High ($) |
| 2027 | $0.0039138 | $0.0076741 | $0.012 |
| 2028 | $0.0122 | $0.0224 | $0.034 |
| 2029 | $0.0604 | $0.2013 | $0.3623 |
| 2030 | $0.0183 | $0.0415 | $0.068 |
| 2031 | $0.0429 | $0.066 | $0.0924 |
| 2032 | $0.0712 | $0.1306 | $0.1984 |
BRETT price prediction 2027
The price of Brett (Based) is predicted to reach a minimum of $0.0039138 in 2027, a maximum of $0.012, and an average trading price of $0.0076741. This forecast is influenced by the token’s expanding Base network ecosystem, growing retail investor participation, and rising meme coin market activity, all of which support gradual value appreciation despite potential volatility in broader crypto sentiment.
BRETT coin price prediction 2028
The price of Brett (Based) is expected to reach a minimum of $0.0122 in 2028, a maximum of $0.034, and an average trading price of $0.0224. This expected rise is linked to Brett’s strengthening community base, increasing visibility within the Base ecosystem, and expanding liquidity from new exchange listings, which together foster consistent demand and upward market momentum.
BRETT price prediction 2029
The Brett (Based) price is forecast to reach a minimum of $0.0604 in 2029. According to analysts, the BRETT price could reach a maximum of $0.3623, with an average forecast of $0.2013. This projection stems from Brett’s growing cultural relevance in the meme coin sector, stronger Base ecosystem adoption, and increasing participation from retail traders, while overall market maturity supports more stable and sustainable price growth.
BRETT coin price prediction 2030
According to analysts, in 2030, the price of Brett (Based) is forecast to range from a minimum of $0.0183 to a maximum of $0.068, with an average trading value of $0.0415.
BRETT price prediction 2031
According to analysts, in 2031, the price of Brett (Based) is expected to range from a minimum of $0.0429 to a maximum of $0.0924, with an average trading price of $0.066. This growth forecast is fueled by Brett’s expanding influence as a leading meme token on the Base network, increasing retail participation, and broader market recovery cycles, which together strengthen liquidity, visibility, and long-term investor sentiment.
BRETT coin price prediction 2032
In 2032, Brett (Based) is expected to trade between $0.0712 and $0.1984, with an average price of $0.1306.
BRETT market price prediction: Analysts’ BRETT price forecast
| Firm Name | 2026 | 2027 |
| Coincodex | $ 0.01625 | $ 0.009534 |
| DigitalCoinPrice | $0.00879 | $0.00874 |
Cryptopolitan’s BRETT price prediction
At Cryptopolitan, we maintain a positive outlook on BRETT’s future price based on market trends and sentiment. By the end of 2026, BRETT could achieve a maximum price of $0.02856. By 2027, BRETT is expected to decline and trade at a maximum price of $0.0096.
BRETT historic price sentiment
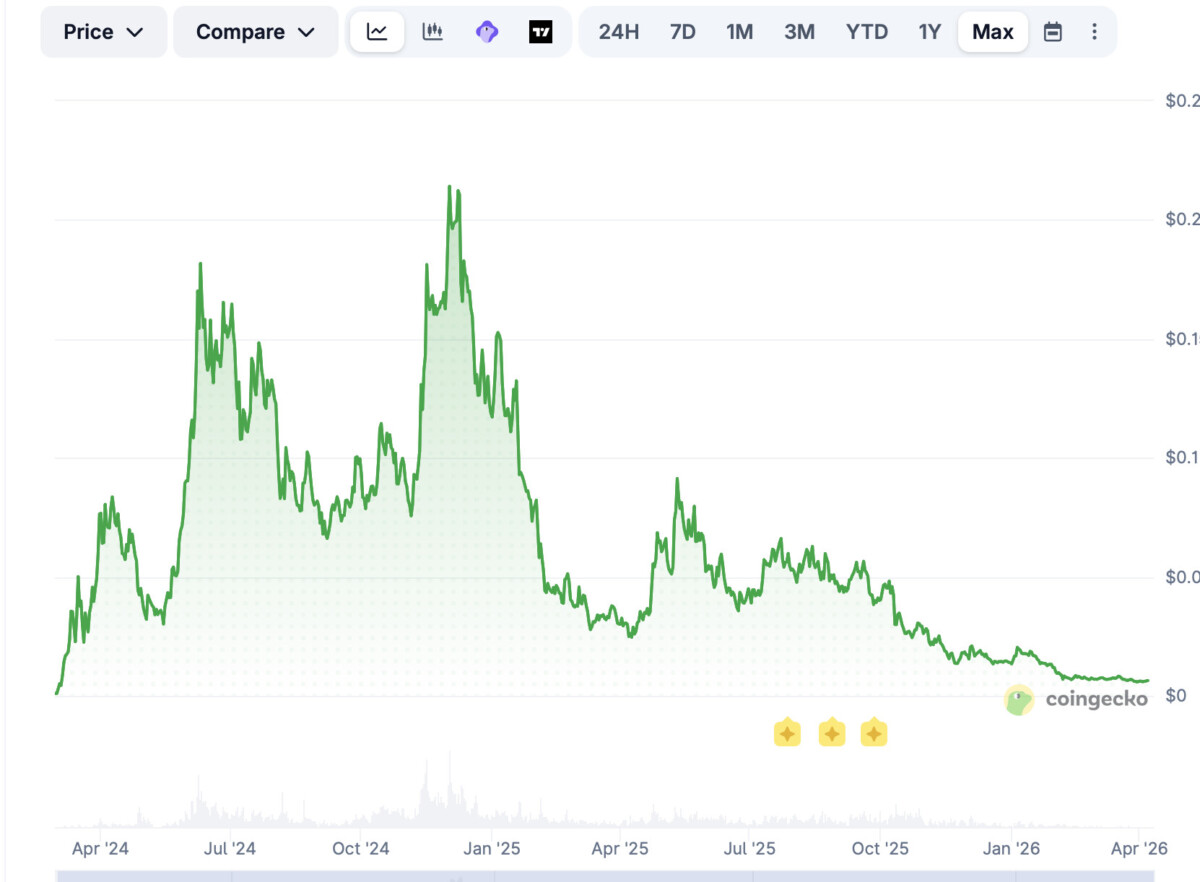
- Brett launched in July 2023 at $0.0001, surging to $0.1939 by June 2024, driven by meme coin mania and Base ecosystem growth, before stabilizing between $0.10–$0.15 through late 2024.
- January 2025 saw a dramatic spike to $0.825 before a brutal collapse — by March 2025, the price had crashed to $0.030, wiping out over 96% of the value from the January peak.
- Throughout mid-2025, BRETT attempted recovery bounces between $0.042 and $0.063 but consistently failed to sustain momentum, drifting lower to close August near $0.046.
- September through November 2025 brought continued weakness, with BRETT consolidating in a tight $0.038–$0.048 accumulation band as liquidity rotated away toward other meme coins.
- By early 2026, a brief January spike quickly reversed — price retraced back toward support by January 23 and continued grinding lower through mid-February 2026 as lower highs confirmed sustained bearish pressure.
- From mid-February 2026, BRETT traded near its all-time low of $0.00616, grinding sideways through early March around $0.0068 as broad crypto selling pressure and “Extreme Fear” sentiment kept the token heavily suppressed, down over 83% from its all-time high.
- Through late March into April 6, BRETT attempted a brief recovery toward $0.0085–0.0090 before fading back, ultimately closing the period around $0.0065, with the overall structure remaining deeply bearish — sellers defending every rally attempt with lower highs consistently forming throughout.
- BRETT entered April 6 trading around $0.0069, having suffered a steep decline from its all-time high, with the token stuck in a bearish consolidation phase as selling pressure dominated and the broader meme coin market remained subdued.
- By May 7, BRETT recovered to around $0.0080 to $0.0081, posting a 15.50% gain over the past seven days and outperforming the broader crypto market, supported by renewed Base network interest and a more favorable risk-on sentiment as Bitcoin pushed higher.
บทความแนะนำ


