

VeChain price prediction 2026-2032: What’s the growth potential of VET?
Key takeaways
- VeChain price projection suggests a peak price of $0.014002 by 2026.
- Traders can expect a minimum price of $0.016611 and a maximum price of $0.043724 by 2029.
- By 2032, VeChain’s price could potentially surge to $0.085557.
Despite occasional market volatility and significant regulatory uncertainties, VeChain demonstrates resilience and a strong value proposition, which is vital for the vechain ecosystem positioning itself as a leader in blockchain-based solutions for global supply chains, transparency, product authentication, and data management. VeChain aims to leverage blockchain technology to address global supply chain and sustainability challenges, emphasizing its real world impact. VeChainThor features a dual token system designed to align economic incentives with network usage and security, separating value accrual from operational utility. The blockchain platform is designed for enterprise clients and business processes, particularly in supply chains.
Overall, the prevailing sentiment within the VeChain community regarding the current market cap and the demand is one of optimism and confidence among investors, with stakeholders bullish on its long-term prospects and the transformative impact of blockchain technology. The VeChain team, led by Sunny Lu, brings deep expertise in blockchain and enterprise solutions. VeChain has formed strategic partnerships with major companies such as Walmart and BMW, validating its real-world use cases and expanding its global reach. VeChain’s market value is reinforced by a market capitalization of approximately €525.79 million and a trading volume of €12.77 million over the past 24 hours. Analysts identify VeChain’s focus on real-world use cases in sustainability and tracking as primary value drivers. As the VeChain network continues to expand its reach and enhance its offerings, questions surrounding its price movements and trajectory persist, reflecting current trends, inviting further analysis and exploration of its future potential.
VeChain overview
| Cryptocurrency | VeChain |
| Symbol | VET |
| Price | $0.007655(-0.01%) |
| Market Cap | $658.12 Million |
| Trading Volume (24-h) | $32.21 Million |
| Circulating Supply | 85.98 Billion VET |
| All-time High | $0.2782, Apr 17, 2021 |
| All-time Low | $0.001678, Mar 13, 2020 |
| 24-h High | $0.007956 |
| 24-h Low | $0.007542 |
VeChain price prediction: Technical analysis
| Market Sentiment | Bullish |
| 50-Day SMA | $0.00711 |
| 200-Day SMA | $0.0103 |
| Price Prediction | $0.00780 (+2%) |
| Fear & Greed Index | 10.72 (Extreme Fear) |
| Green Days | 19/30 (64%) |
| 14-Day RSI | 64.09 |
VeChain price analysis: VET falls to $0.007660
VeChain (VET) current price analysis for 7 May shows strong bullish movement across the last two days as the price climbed past $0.007500. However, VET faced strong rejection at the $0.007800 mark.
VeChain 1-day price chart: VET falls to $0.007660
VeChain (VET) price action shows a bullish week as the price rose from the lows of $0.007200 mark to the $0.007950 mark where it found resistance. Since then, the price has fallen to the $0.007660 mark.
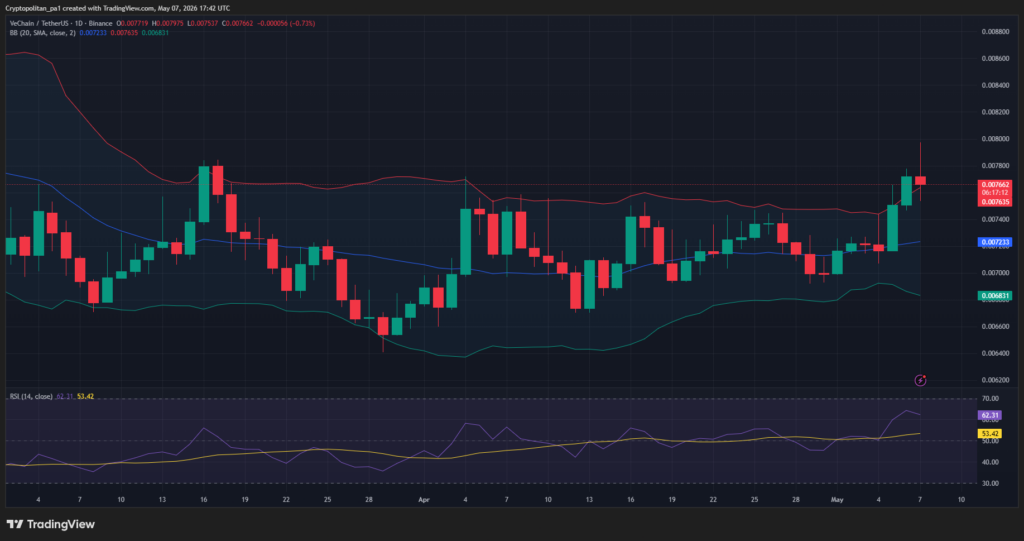
The Relative Strength Index (RSI) rises to 62.31, with the slope showing declining momentum as the price moves towards $0.007650. The indicator leaves low room for volatile movement in upwards direction. Meanwhile, the Bollinger Bands suggest low volatility, with the bands converging across the past few days.
VeChain 4-hour price chart: VET shows neutral momentum
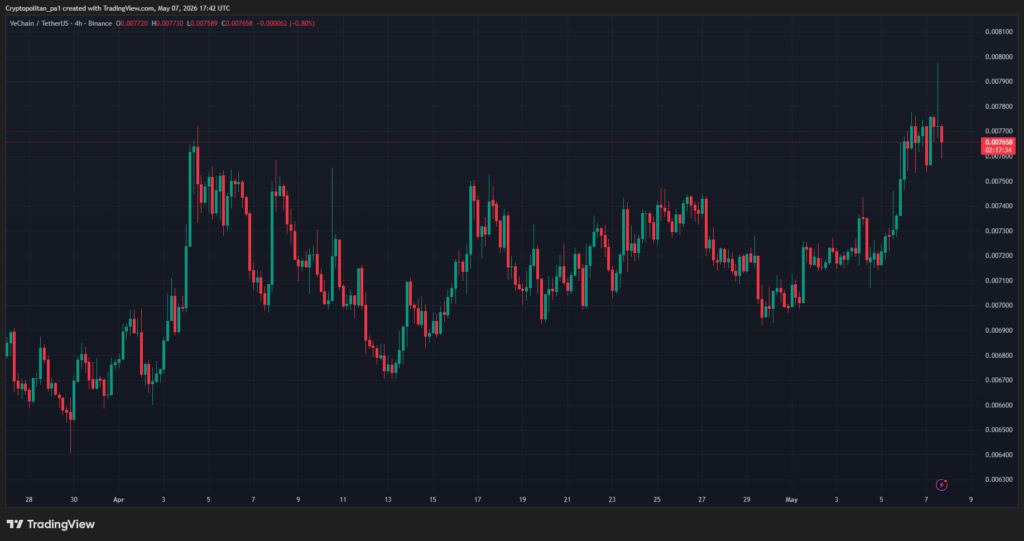
VeChain (VET) live price trades at $0.007655 on the 4-hour chart, showing consolidation as the price falls from the high of $0.007800 mark.
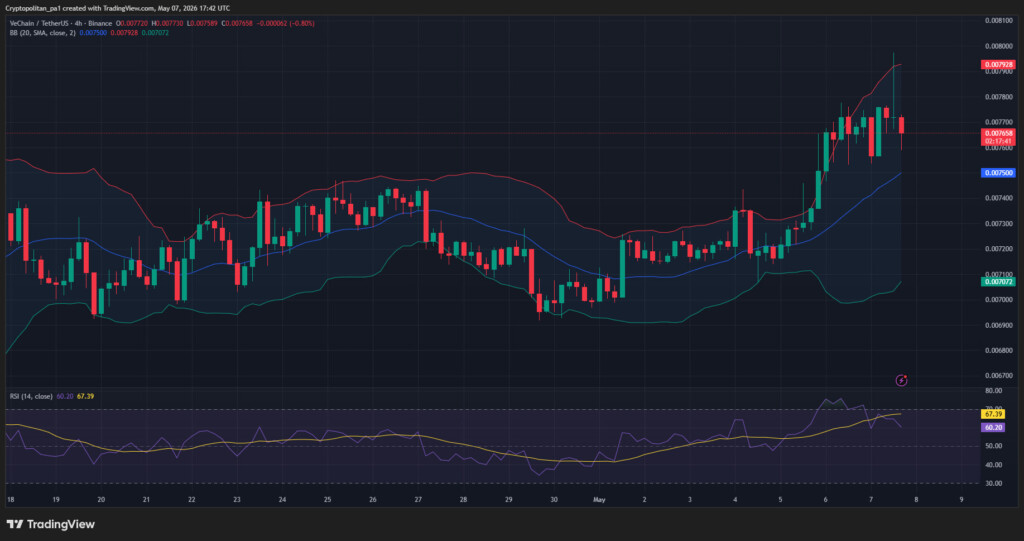
The Relative Strength Index (RSI) stands at 60.20, showing a slight bearish market sentiment as VET hovers around $0.007650. The Bollinger Bands are converging and show support and resistance levels at the $0.007072 and $0.007928 marks respectively.
VeChain technical indicators: Levels and action
Daily simple moving average (SMA)
| Period | Value | Action |
|---|---|---|
| SMA 3 | $0.007470 | BUY |
| SMA 5 | $0.007375 | BUY |
| SMA 10 | $0.007246 | BUY |
| SMA 21 | $0.007242 | BUY |
| SMA 50 | $0.007117 | BUY |
| SMA 100 | $0.007475 | BUY |
| SMA 200 | $0.01033 | SELL |
Daily exponential moving average (EMA)
| Period | Value | Action |
|---|---|---|
| EMA 3 | $0.007537 | BUY |
| EMA 5 | $0.007437 | BUY |
| EMA 10 | $0.007330 | BUY |
| EMA 21 | $0.007250 | BUY |
| EMA 50 | $0.007304 | BUY |
| EMA 100 | $0.008139 | SELL |
| EMA 200 | $0.01080 | SELL |
What to expect from VET price analysis?
Vechain price analysis showed a sharp rise across the past few days as the price rose from the $0.007200 mark. VET found resistance at the $0.007800 mark, causing a decline to the current $0.007650 mark.
Overall, Vechain suggests that the price may fall towards $0.007500 as it struggles to climb past the $0.007800 mark. However, if the bulls hold the $0.007650 level and establish support above $0.007700 mark, VET may retest the level. On the other hand, a drop below the level would mean a return to $0.007200 and lower support levels.
Is Vechain a good investment?
VeChain, as a notable blockchain project, stands out among crypto tokens in cryptocurrency because it focuses on supply chain management and enterprise solutions, which is not considered financial advice. VeChain operates on a dual-token model with two tokens: VET and VTHO. VET tokens are used for staking and governance, while VTHO is used to pay for transaction fees and smart contract execution. Users expend VET to participate in the network, and writing data to the blockchain is managed through VTHO, separating the cost of data submission from the value of VET. Smart contracts play a crucial role in automating business processes and enhancing trust, increasing transparency and efficiency in global trade.
With partnerships with major companies and a strong emphasis on real-world applications, many believe VeChain is a good buy due to its significant growth potential. Its innovative use cases and practical implementations appeal to businesses seeking operational improvements, making it an attractive option for informed investors.
However, it is advised to do your own research and conduct experts opinion before investing in the volatile market.
Why is VET down?
VeChain (VET) price shows that the bulls found resistance at $0.007800 level causing a breakdown to the current $0.007650 mark.
Will VeChain recover?
VeChain has experienced a notable selloff in the last thirty days, with the price falling from near the $0.03 mark to its highest price of the period to the current $0.021 level. However, industry analysts suggest that this downturn in the financial markets may not be long-term, a sentiment shared by many VET holders. Most projections indicate that VeChain could regain strength as market conditions improve, with expectations for the asset to potentially close the year between the $0.035 and $0.05 price levels.
Will VeChain reach $0.05?
Analysts suggest VeChain could attain $0.05 by 2031, as the minimum price is projected to be $0.0434 and the average price at $0.0500, as per the VET price prediction 2031. with a potential peak of $0.0585.
Will VeChain reach $0.10?
VET is expected to trade above $0.10 by 2035.
Does VET have a good long-term future?
VET has a good long-term future due to its strong use cases, growing on chain activity, and active development team at the Vechain Foundation.
Recent news/opinion on Vechain
Vechain’s recently revealed its Roadmap for 2026 including key information regarding planned developments including full Ethereum compatibility.
VeChain price prediction May 2026
In May 2026, the price of VeChain is anticipated to reach a minimum of $0.00732. The VET price can be expected to peak at $0.00929, maintaining an average of $0.00795 by the end of the month.
| Month | Minimum Price ($) | Average Price ($) | Maximum Price ($) |
| May | 0.00732 | 0.00795 | 0.00929 |
VeChain price prediction 2026
In 2026, the price of the VeChain coin is anticipated to touch a minimum of $0.006575, reflecting the current VeChain sentiment. The VET price might peak at $0.014002, maintaining an average of $0.010288 by the end of the year.
| Year | Min. Price ($) | Average Price ($) | Maximum Price ($) |
| 2026 | 0.006575 | 0.010288 | 0.014002 |
VeChain price prediction 2027-2032
| Year | Min. Price ($) | Average Price ($) | Maximum Price ($) |
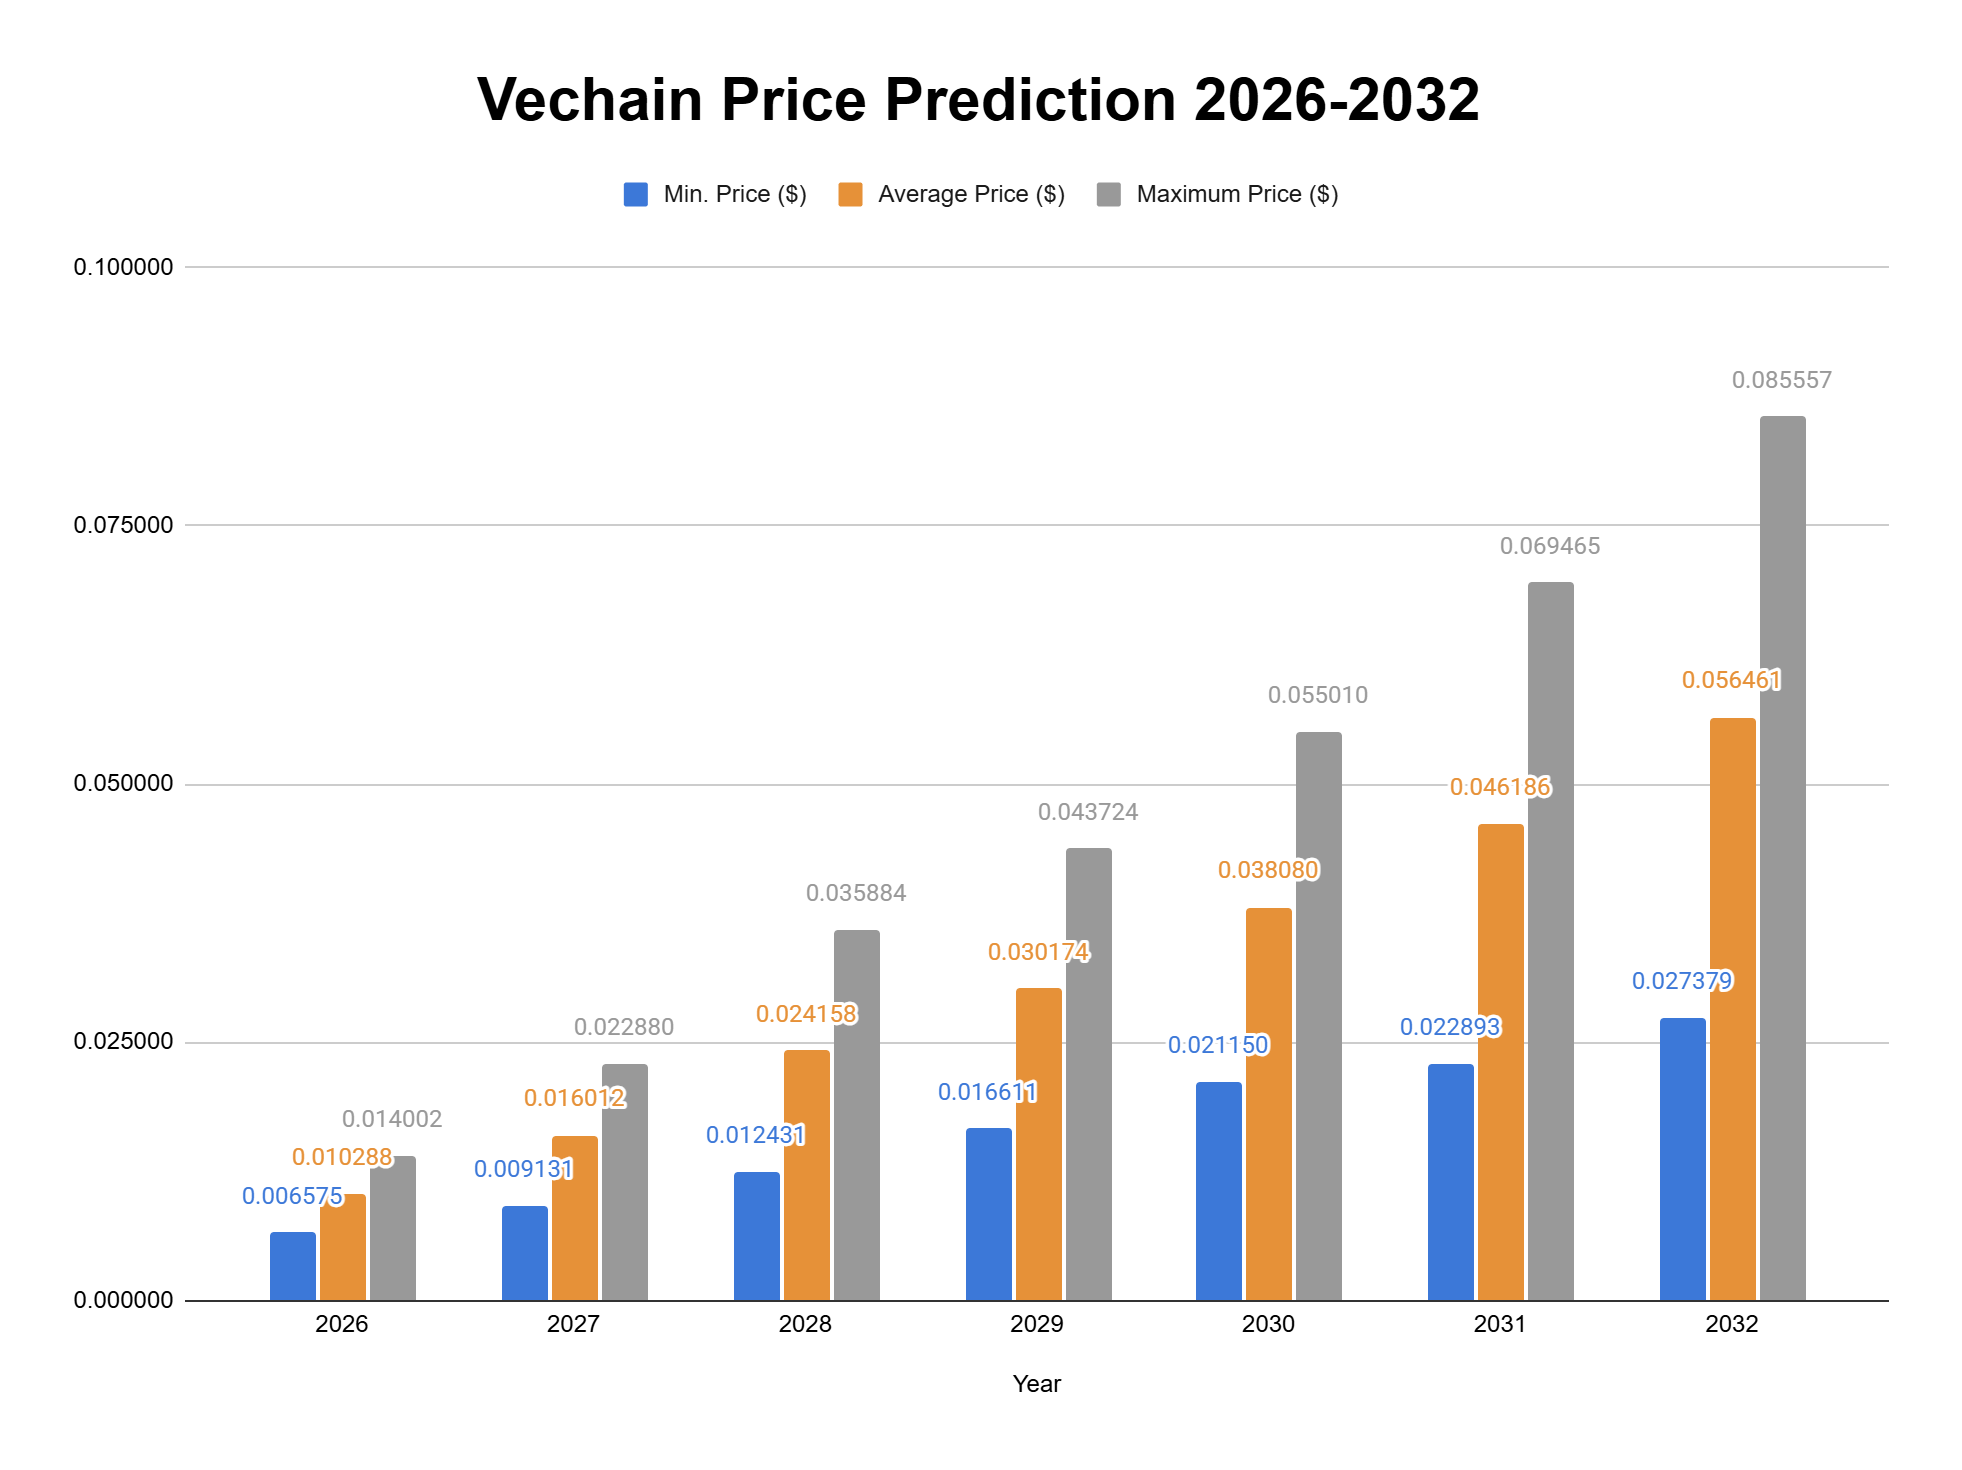
| 2026 | 0.006575 | 0.010288 | 0.014002 |
| 2027 | 0.009131 | 0.016012 | 0.022880 |
| 2028 | 0.012431 | 0.024158 | 0.035884 |
| 2029 | 0.016611 | 0.030174 | 0.043724 |
| 2030 | 0.021150 | 0.038080 | 0.055010 |
| 2031 | 0.022893 | 0.046186 | 0.069465 |
| 2032 | 0.027379 | 0.056461 | 0.085557 |
VeChain Price Prediction 2027
For 2027, VeChain (VET) is expected to reach a minimum price of $0.009131. It could potentially climb to a high of $0.022880, averaging around $0.016012.
VeChain Price Prediction 2028
By 2028, VeChain price prediction suggests VET could trade at a minimum value of $0.012431. It might surge to a high of $0.035884, with an average price of $0.024158.
VeChain Price Prediction 2029
VeChain price prediction estimates VET to trade at a minimum of $0.016611 in 2029. It might reach a maximum of $0.043724, with an average value of $0.030174.
VeChain Price Prediction 2030
In 2030, VeChain’s price will likely hit a floor of $0.021150. Based on analysis, it could peak at $0.055010, with an average closing price of $0.038080.
VeChain Price Prediction 2031
The VeChain price prediction for 2031 projects a minimum price of $0.022893, a maximum price of $0.069465, and an average trading price of $0.046186.
VeChain Price Prediction 2032
In 2032, VeChain forecast suggests VET could trade at minimum and maximum prices of $0.027379 and $0.085557, respectively. The price might maintain an average of $0.056461.
Vechain Price Forecast: By Analysts
| Firm | 2026 | 2027 |
| Coincodex | $0.01498 | $0.01274 |
| DigitalCoinPrice | $0.0208 | $0.0291 |
Cryptopolitan’s VeChain (VET) price prediction
Cryptopolitan’s market analysis predictions show that VeChain will achieve a high of $0.014002 in 2026. In 2028, it will range between $0.012431 and $0.035884, with an average of $0.024158. In 2032, it will range between $0.027379 and $0.085557, with an average of $0.056461. Note that these predictions are not investment advice. Seek independent professional consultation or do your own research.
VeChain historic price sentiment

- VeChain began in 2015 as a private consortium chain for blockchain applications. It transitioned to a public blockchain with the ERC-20 token VEN in 2017 and launched its mainnet as VET in 2018.
- In 2018, VeChain partnered with DHL to develop blockchain solutions for logistics but saw a significant price correction, stabilizing at lower levels.
- The price remained relatively stable in 2019 and 2020, with occasional spikes as VeChain continued developing technology and forming partnerships.
- In 2021, VeChain’s price surged to an all-time high of $0.20 in May but dropped to $0.070 by December.
- In 2022, VeChain attempted to recover but remained below $0.10, with continued volatility throughout the year and into early 2023.
- Towards the end of 2023, the price saw a slight uptick, stabilizing around $0.020 by early 2024.
- In 2024, VeChain’s price fluctuated, recovering to $0.025 by mid-March but dropping due to bearish trends, reaching a low of $0.019 by August.
- It traded around $0.021 in September but ended the month above the $0.024 mark. The price remained mostly stable in October, with the occasional bearish movement causing a decline from the $0.02400 level to start November at the $0.02100 price level.
- The asset closed November at a high level, with prices near the $0.04600 mark and a strong bullish outlook. However, the bulls only took the price higher in December, as the $0.0500 resistance was crushed swiftly.
- As of January 2025, VET traded around the $0.04300 mark as it started and closed the month around the same level.
- In February, the price fell towards the $0.03000 mark as bears took over, ending the month at $0.02800. In March, the net movement was low, but the volatility was very high, as the price fell to $0.02200 where it closed the month.
- In April the price saw an initial crash but observed sharp recovery ending the month above the $0.02600 mark. In May the price dwindled again ending the month around $0.0250. In June the price continued to struggle as it dropped to $0.0200 to end the month.
- July saw a sharp rise to the asset’s volatility with VET crossing the $0.02800 mark. However, the price could not be maintained and VET ended the month around the $0.02200 level. In September, the price saw high volatility reaching as high as $0.0260 but failed to stay at the level and ended the month below the $0.02200 mark.
- In October, the price declined further and ended the month below the $0.01500 mark as bears dominated the crypto markets during the later half of the month. in November, the downtrend continued with VET ending the month below the $0.0130 mark. In December, the price continued to move downwards ending the year at $$0.0122.
- In January, the trend continued with VET falling below the $0.0100 mark and ended the month below the $0.0080 level. In February the trend continued with the price ending the month below the $0.0070 mark. In March, the trend continued with VET closing the month at the $0.00677 mark.
- By the end of April. VET price hovered around $0.007.
บทความแนะนำ


