
Ripple Price Forecast: XRP bulls leak wounds as Ripple updates roadmap
- XRP pares intraday losses, holding above the 100-day EMA on Tuesday.
- Ripple advances institutional DeFi while targeting the launch of a lending protocol in the fourth quarter.
- Retail interest in XRP sharply declines, with the futures Open Interest down to $7.64 billion.
Ripple (XRP) is stabilizing above its $2.83 short-term support on Tuesday. This support comes after a sharp drop to $2.69 on Monday, which triggered massive liquidations.
Based on the near-term technical outlook, three outcomes are likely this week: sideways price action around $2.83, a steady rebound toward the $3.00 key level, or the continuation of the downtrend toward the $2.50 round-number support.
Ripple advances institutional DeFi
Ripple has updated its roadmap, focusing on top-tier institutional Decentralised Finance (DeFi), tokenization of real-world assets (RWAs), and the launch of a native lending protocol.
In Monday's release, Ripple stated that the XRP Ledger (XRPL) has grown to become a top-ten chain for RWAs, surpassing $1 billion in monthly stablecoin volume. At the same time, improvements on the XRPL have ensured support for stablecoin payments and collateral management.
Tokenization of RWAs stands out as the foundation for "real-world finance" with the XRPL expected to continually scale with a curated blend of features that balance innovation, compliance and reliability.
As for institutions, Ripple believes that "regulatory compliance is not an optional layer, it is the gateway to adoption." Key features of this layer include Decentralised Identifiers (DID), which ensure organisations can verify identities without relying on centralized intermediaries and credentials, allowing trusted issuers to comply with Know Your Customer (KYC) requirements. Other key features include permissioned domains, which are used to create user-controlled environments, and a permissioned DEX, which enables secondary markets for RWAs or FX.
Ripple is also working towards the launch of a native lending protocol called Credit On-Chain. The protocol will introduce pooled lending, supported by underwritten credit at the ledger level.
Credit-On Chain will enable short-term, uncollateralized loans, featuring preset amortization schedules. This product is designed for institutions using mature models, where underwriting and risk management remain off-chain.
"The lending protocol enables exactly that, pooling liquidity from a global base of smaller investors into institutional-sized loans while maintaining compliance. Borrowers gain access to more efficient, lower-cost funding. Lenders earn yield on otherwise idle assets," Ripple stated.
Meanwhile, retail interest in XRP has declined over the past few days, with the futures Open Interest (OI) dropping to $7.64 billion from $8.79 billion on Friday. The drop in OI, which represents the notional value of outstanding futures contracts, indicates a lack of conviction in XRP sustaining an uptrend in the short term. In other words, traders are increasingly closing their positions amid fears of an extended decline.
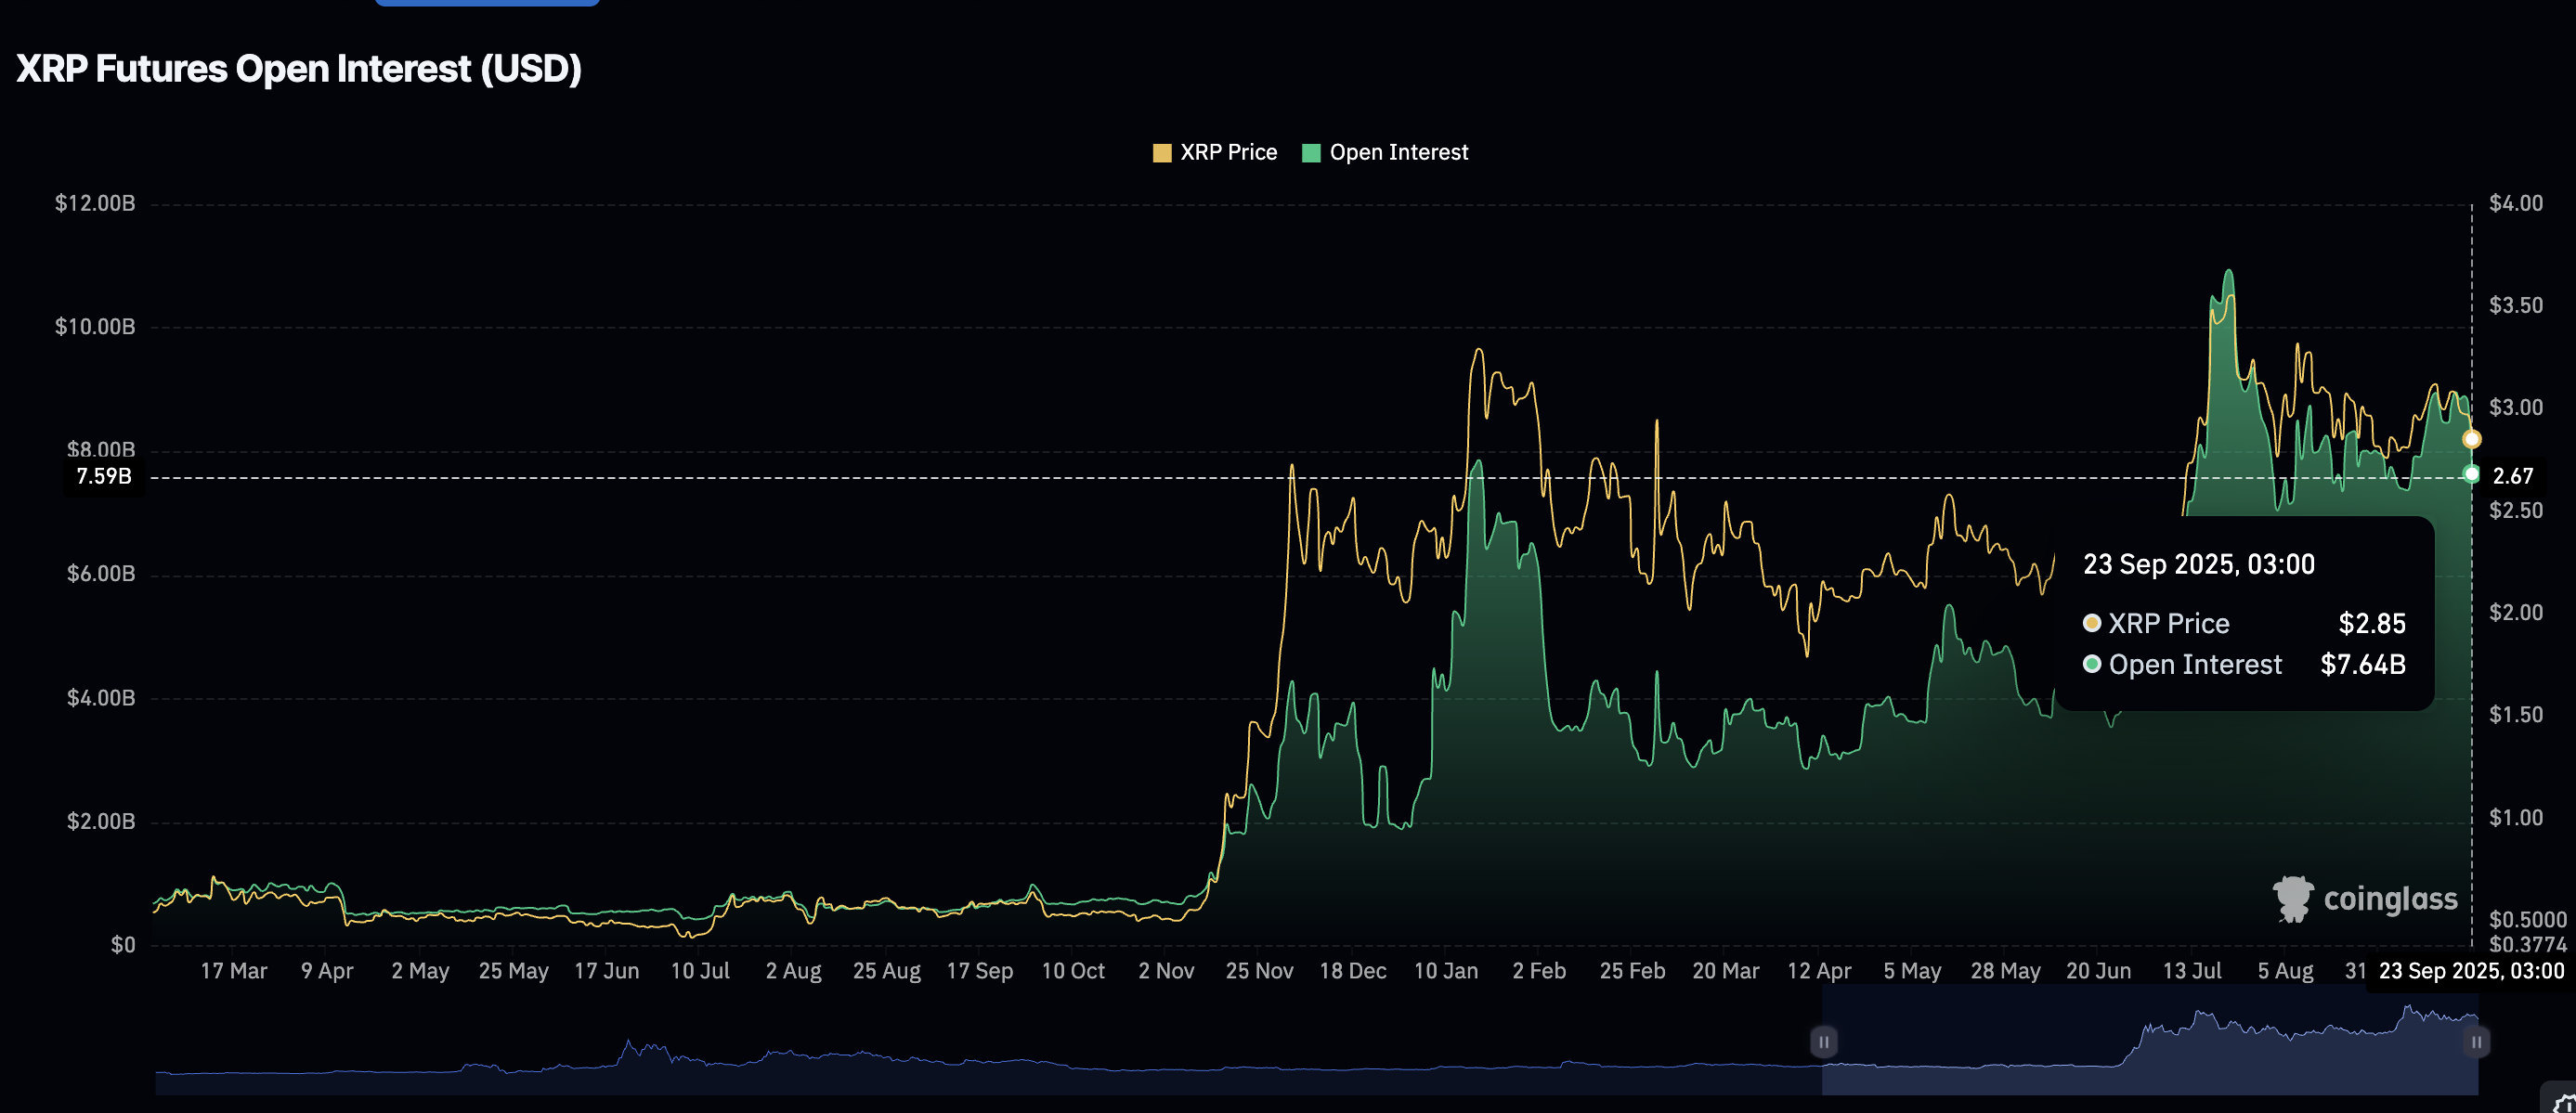
XRP Futures Open Interest | Source: CoinGlass
Technical outlook: Can XRP bulls renew uptrend?
XRP hovers above the 100-day Moving Average (EMA) at $2.83 at the time of writing on Tuesday, after a sharp decline to $2.69 the previous day. The Bulls are pushing to regain control, with the Relative Strength Index (RSI) reversing upward to 42.
A daily close above the 100-day EMA could help confirm the bullish grip and encourage risk-on sentiment. Price action above the 50-day EMA, currently holding at $2.94, could reinforce the bullish grip and bring the $3.00 level within reach.
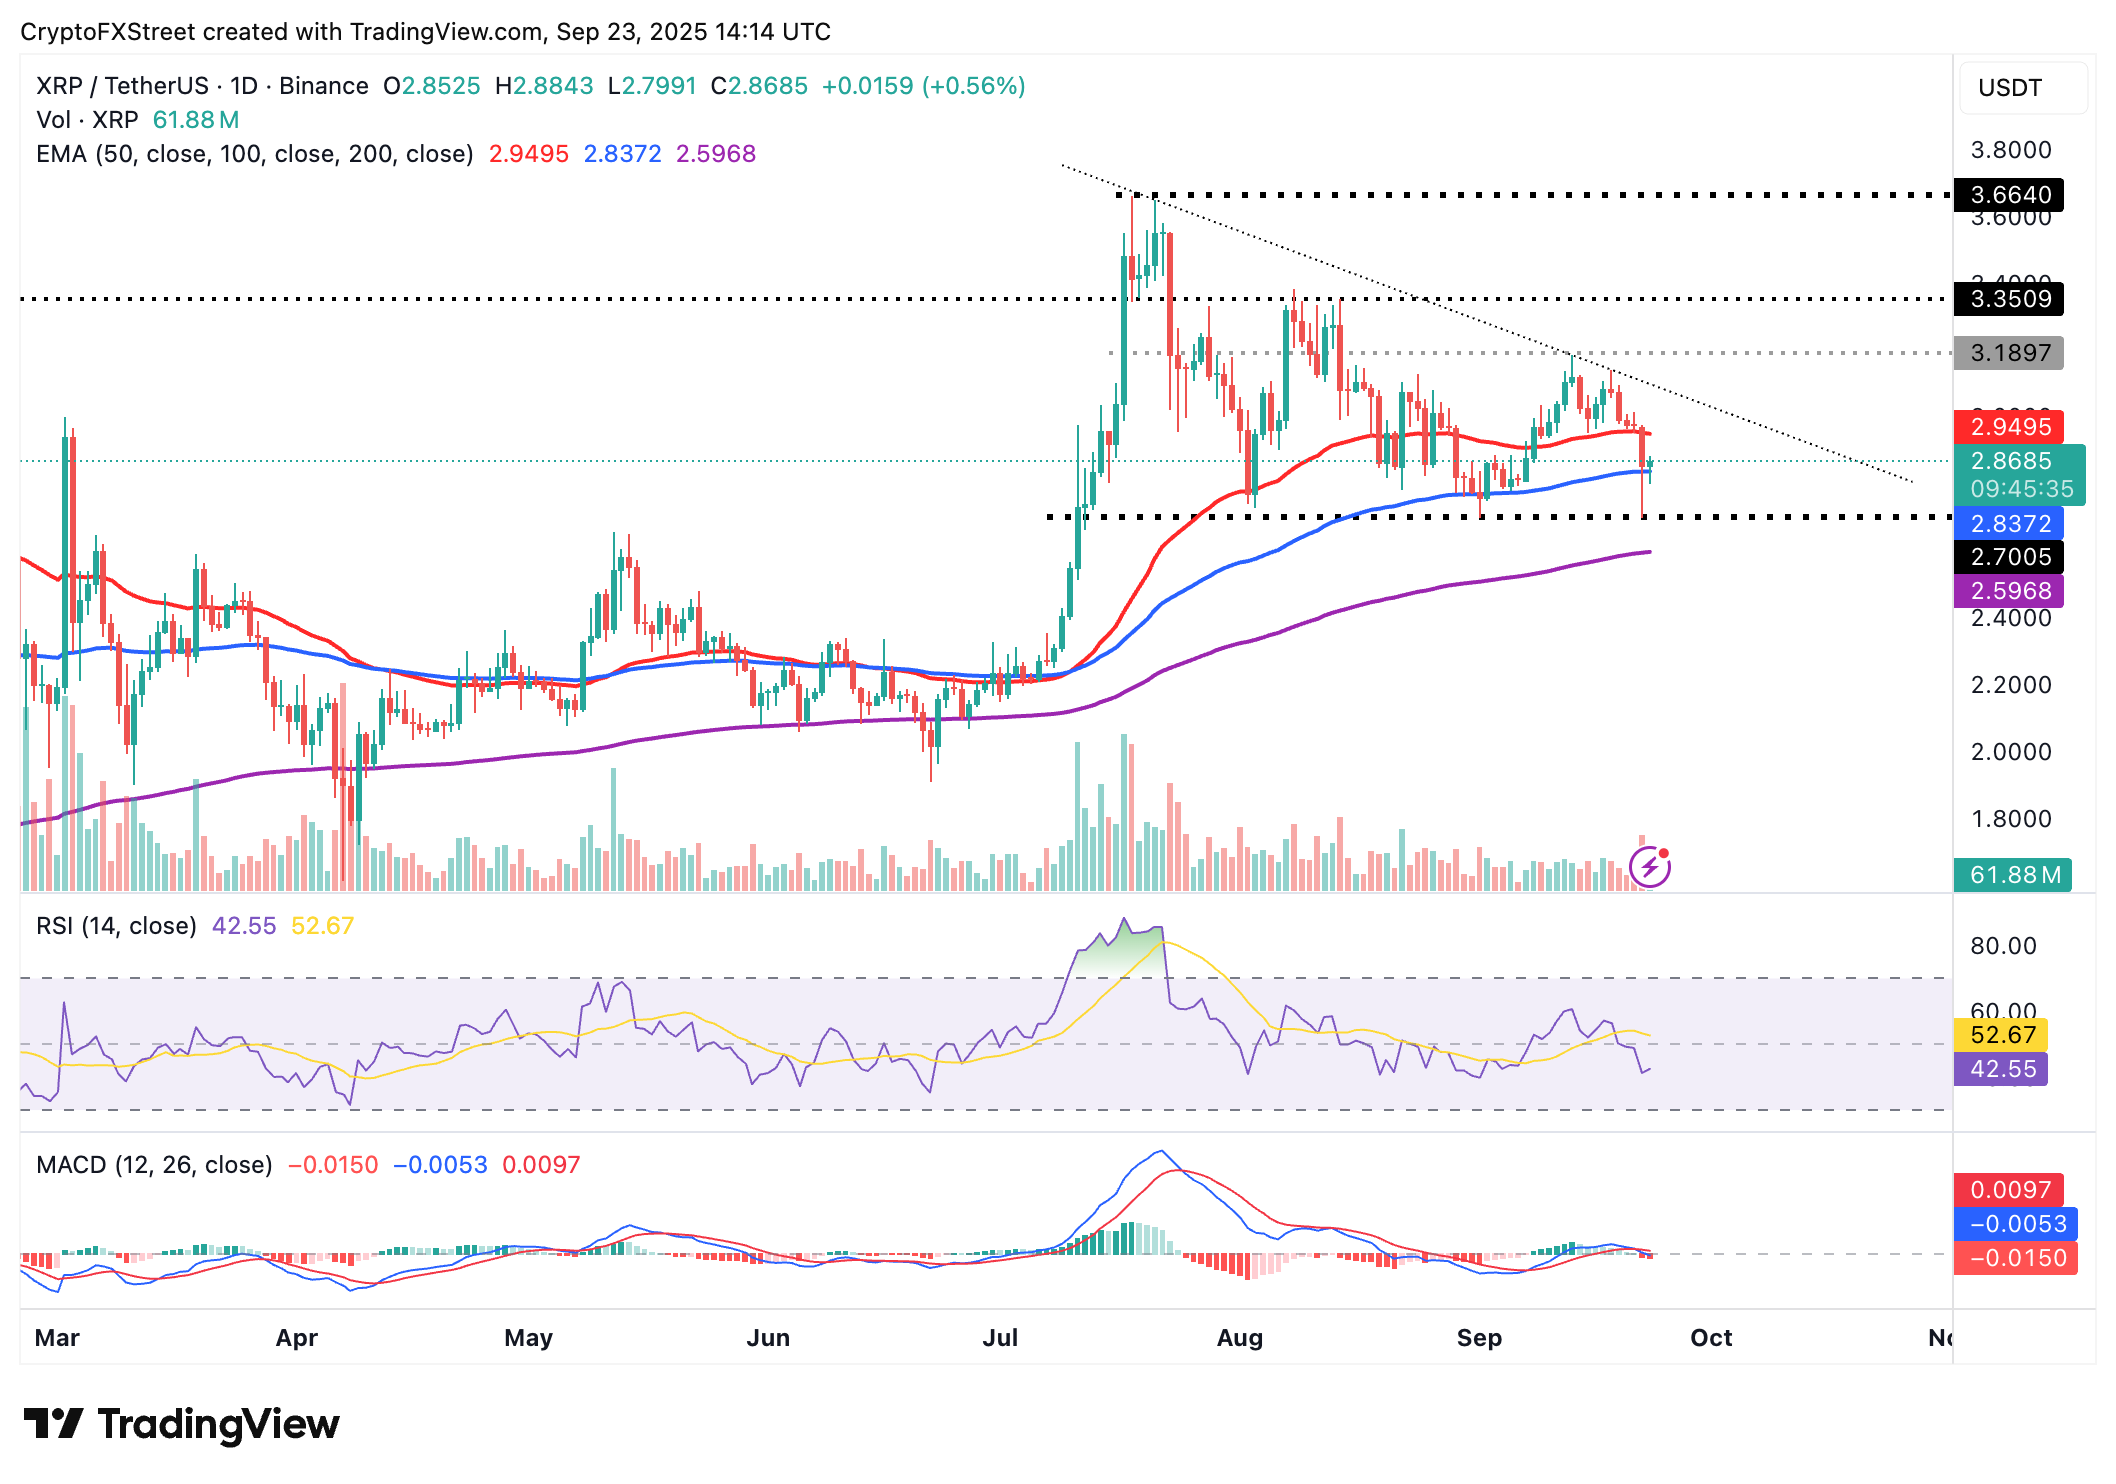
XRP/USDT daily chart
On the other hand, if bulls fail to maintain gains above the 100-day EMA, trading below it could shift attention to $2.70, a level last tested on September 22. Extended declines will likely test the 200-day EMA at $2.59.
Traders should also watch out for a potential buy signal from the Moving Average Convergence Divergence (MACD) indicator. This signal would occur when the blue line crosses above the red signal line, encouraging investors to increase their exposure. For now, the indicator has been displaying a sell signal since Monday.
Cryptocurrency metrics FAQs
The developer or creator of each cryptocurrency decides on the total number of tokens that can be minted or issued. Only a certain number of these assets can be minted by mining, staking or other mechanisms. This is defined by the algorithm of the underlying blockchain technology. On the other hand, circulating supply can also be decreased via actions such as burning tokens, or mistakenly sending assets to addresses of other incompatible blockchains.
Market capitalization is the result of multiplying the circulating supply of a certain asset by the asset’s current market value.
Trading volume refers to the total number of tokens for a specific asset that has been transacted or exchanged between buyers and sellers within set trading hours, for example, 24 hours. It is used to gauge market sentiment, this metric combines all volumes on centralized exchanges and decentralized exchanges. Increasing trading volume often denotes the demand for a certain asset as more people are buying and selling the cryptocurrency.
Funding rates are a concept designed to encourage traders to take positions and ensure perpetual contract prices match spot markets. It defines a mechanism by exchanges to ensure that future prices and index prices periodic payments regularly converge. When the funding rate is positive, the price of the perpetual contract is higher than the mark price. This means traders who are bullish and have opened long positions pay traders who are in short positions. On the other hand, a negative funding rate means perpetual prices are below the mark price, and hence traders with short positions pay traders who have opened long positions.
บทความแนะนำ


