
Crypto Today: Bitcoin, Ethereum pullback persists despite rising interest in spot ETFs
- Bitcoin slightly rebounds after a flash drop to $108,666, reflecting weak sentiment in the broader crypto market.
- Ethereum spot ETF inflows steady, buoyed by growing institutional demand.
- XRP wobbles below $3.00 pivotal level as long position traders lick their wounds.
Bitcoin’s (BTC) technical structure continues to deteriorate, worsened by weak market sentiment. The largest cryptocurrency by market capitalization saw a flash drop to $108,666 during the Asian session on Tuesday before rebounding to exchange hands above $110,000 at the time of writing.
The majority of altcoins, including Ethereum (ETH) and Ripple (XRP), remain upside-heavy, reflecting risk-off sentiment in the broader cryptocurrency market.
Despite Federal Reserve (Fed) Chairman Jerome Powell’s comments that alluded to interest rate cuts in September, the crypto market lacks short-term price catalysts to sustain the uptrend.
Data spotlight: Ethereum spot ETF inflows steady
Demand for Ethereum spot Exchange Traded Funds (ETFs) is back on track following the resumption of inflows on Thursday. According to SoSoValue data, ETH spot ETFs operating in the United States (US) recorded their third consecutive day of inflows after marking $444 million on Monday. Combined, the ETFs boast $12.9 billion in cumulative total net inflows with net assets averaging at $28.8 billion.
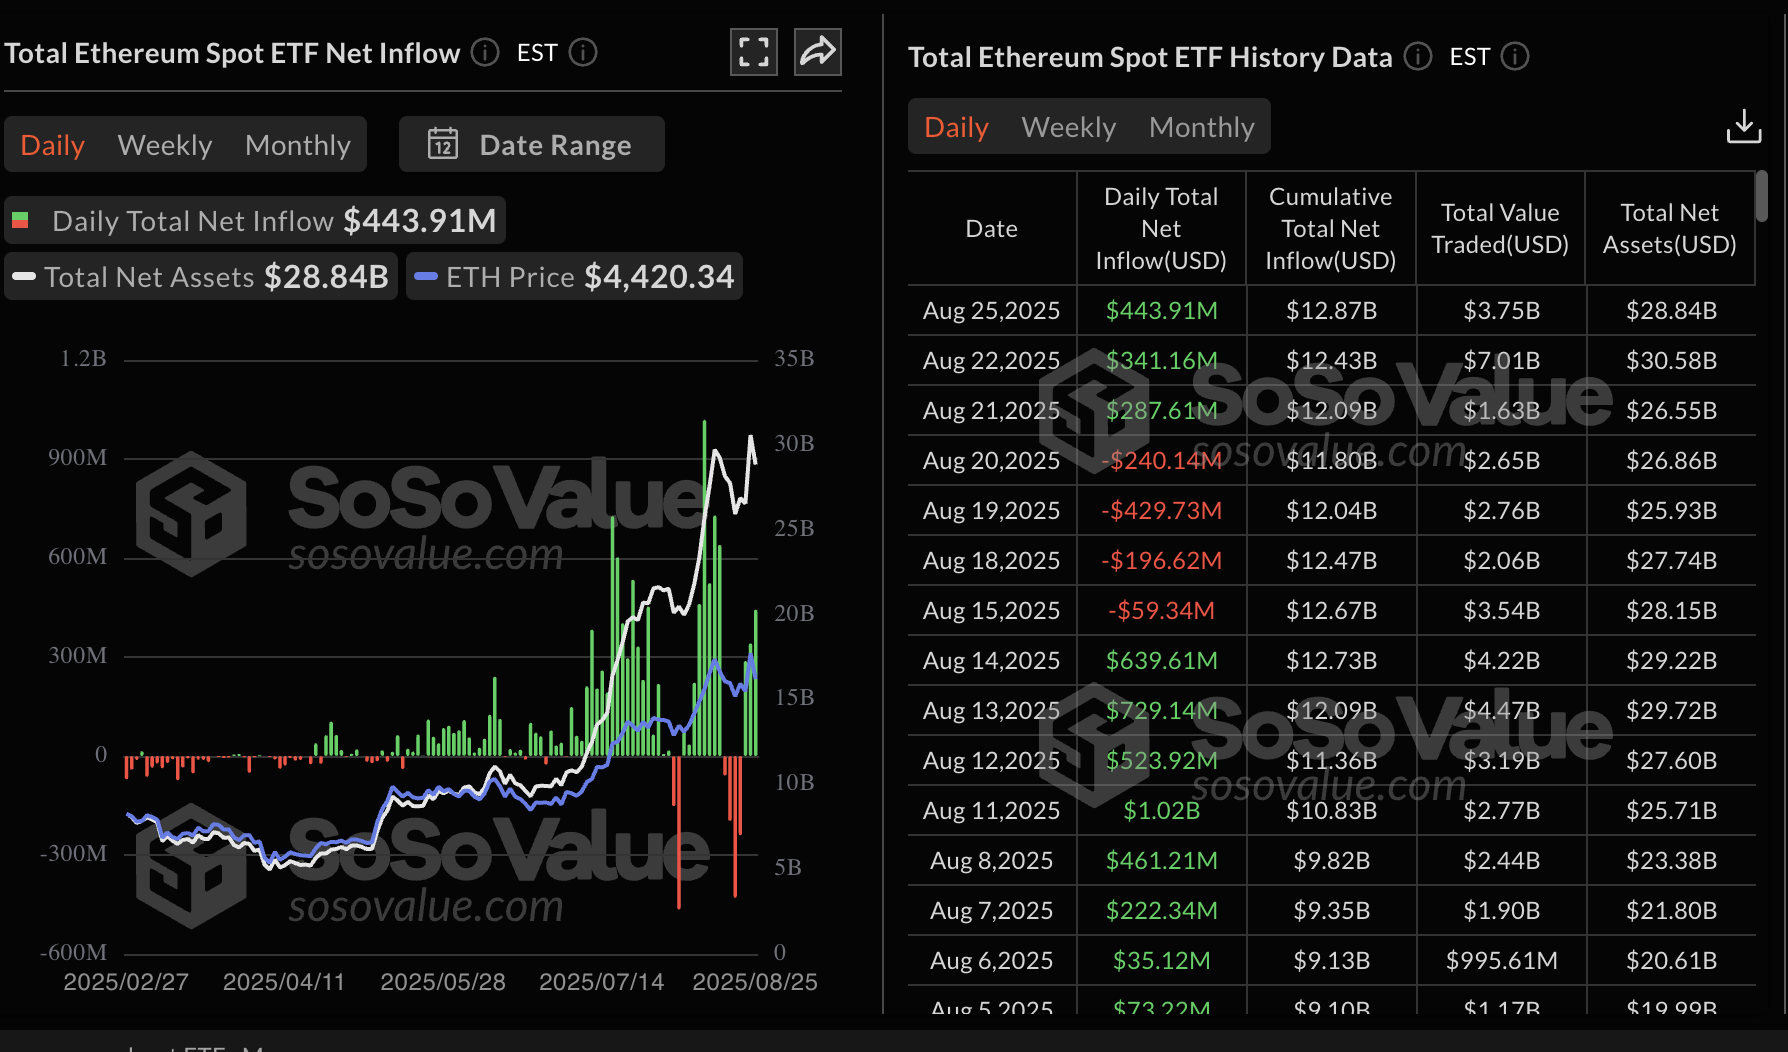
Ethereum spot ETF data | Source: SoSoValue
Investors are also increasingly rotating their capital from Bitcoin to Ethereum. According to Arkham on-chain data, a whale recently sold 23,968 BTC on Hyperliquid to buy Ethereum. The whale is said to have once held 94,000 BTC around the peak of the 2017 bull run.
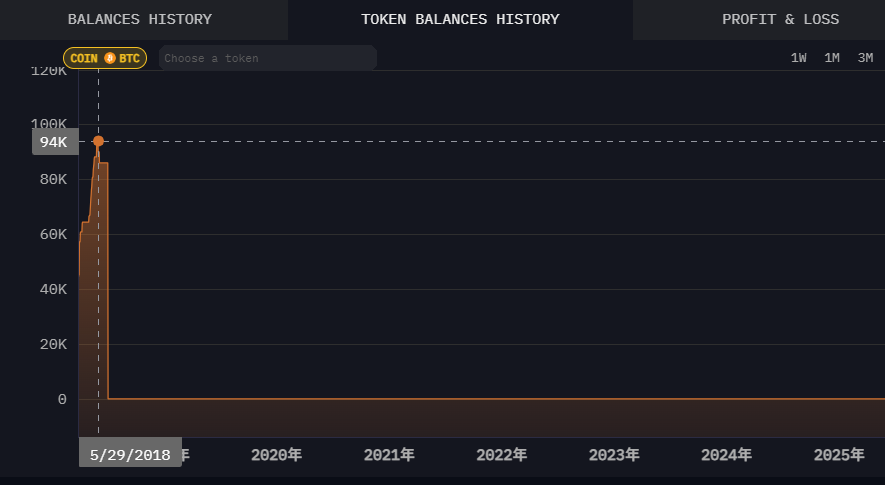
Bitcoin whales buying Ethereum | Source: Arkham
Bitcoin spot ETFs, on the other hand, have resumed inflows following six consecutive days of outflows. SoSoValue data shows the net inflow at $219 million on Monday, bringing the cumulative net inflow to $54 billion and the net assets near $144 billion. If institutional demand stabilizes in the coming days, Bitcoin price could gain bullish momentum for a recovery toward the $120,000 pivotal level.
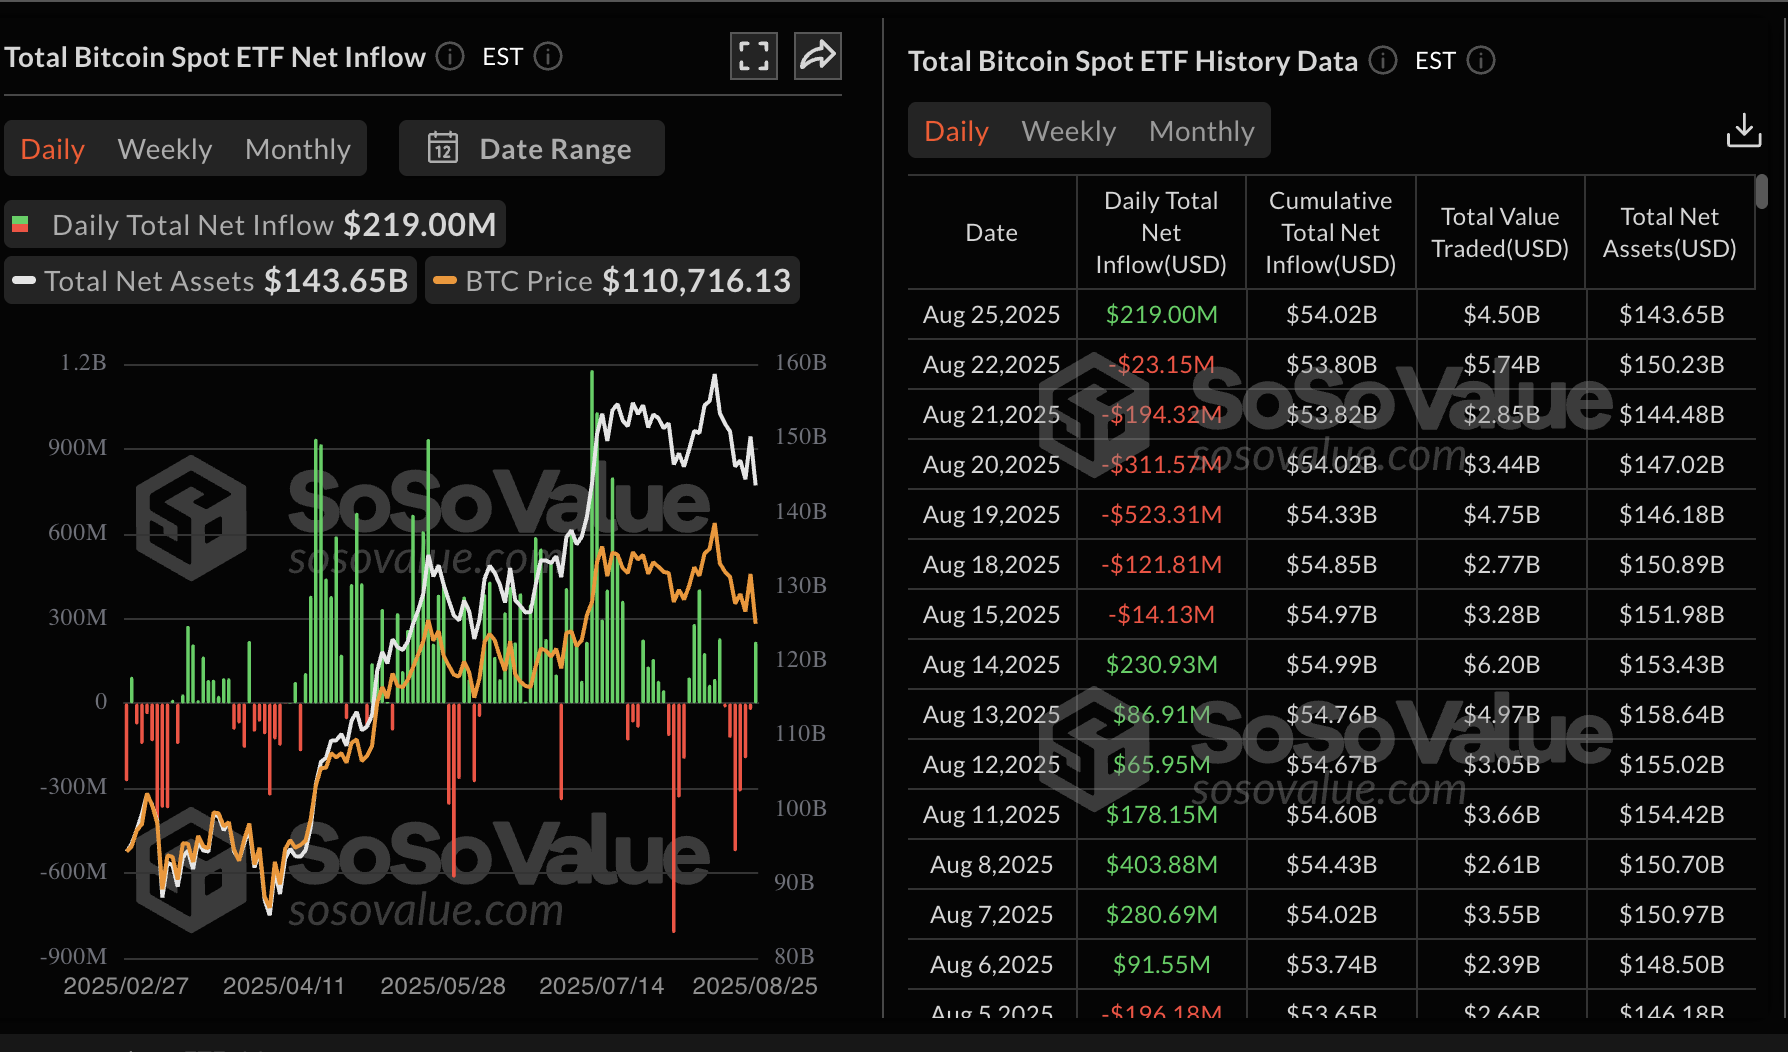
Bitcoin spot ETF data | Source: SoSoValue
As for XRP, interest in the token remains shaky, reflecting a 4% decrease in the derivatives market’s Open Interest (OI) to $7.8 billion over the past 24 hours. Liquidations have also been rising as the XRP price wobbles below the $3.00 critical level.
Over the past 24 hours, long position holders suffered nearly $16 million in liquidations compared to $1.8 million in shorts. This indicates that investors are risk-averse, with most preferring to reduce exposure until the crypto market stabilizes.
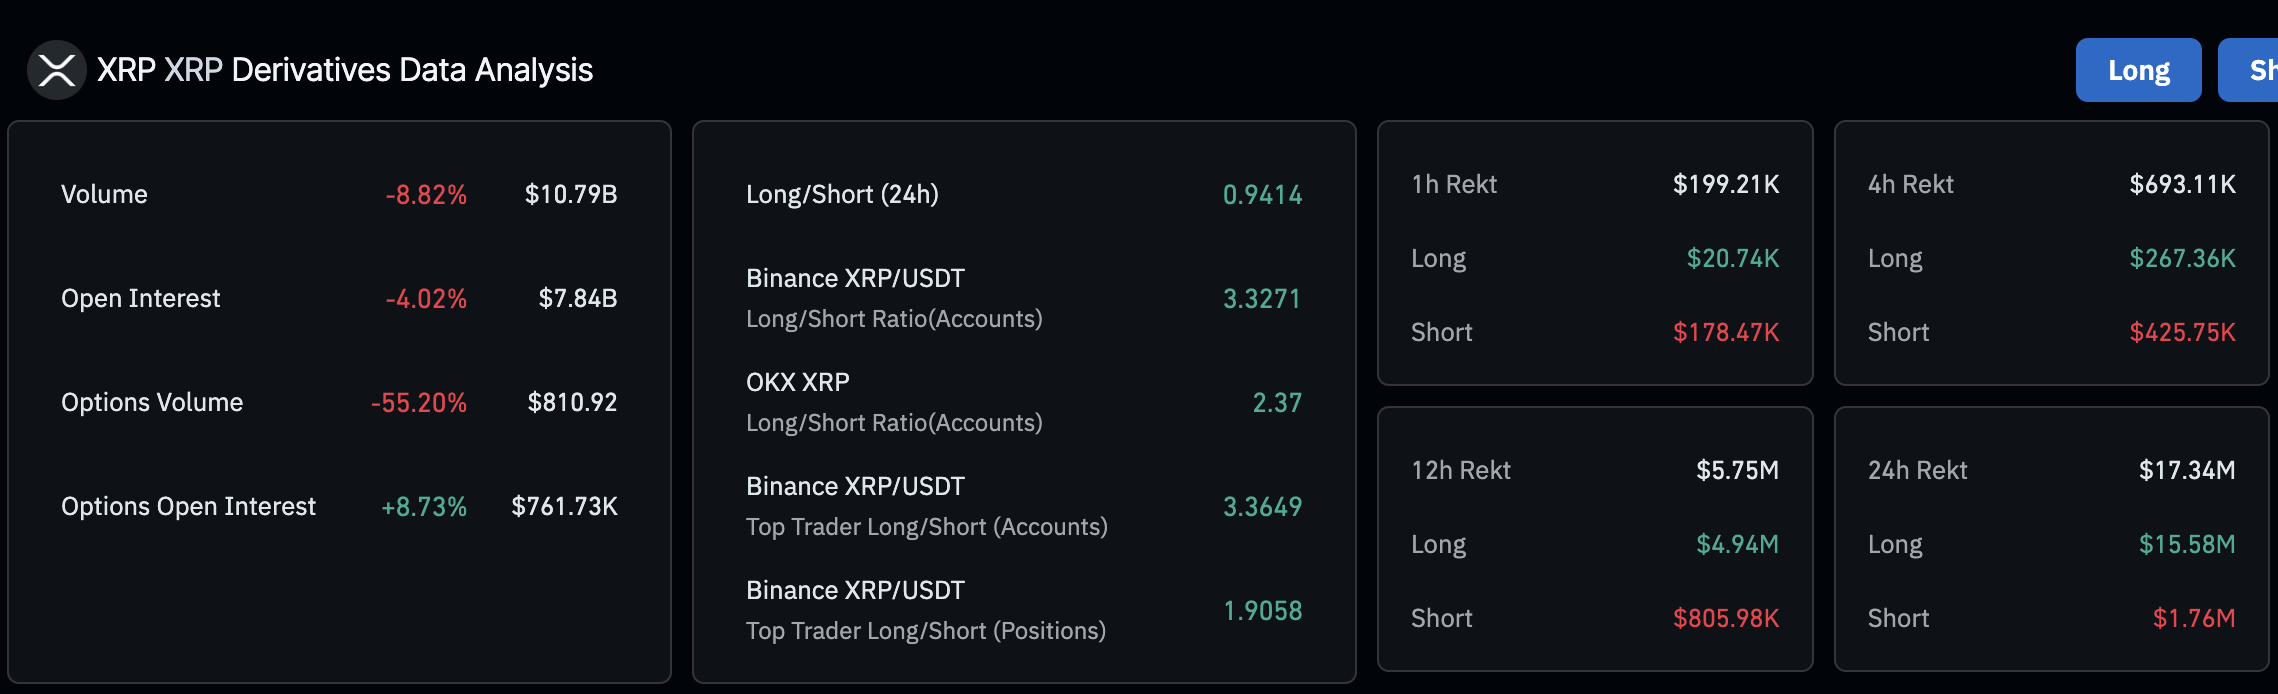
XRP derivatives market data | Source: CoinGlass
Chart of the day: Bitcoin faces technical setbacks
Bitcoin price is trading above $110,000, but what stands out is the loss of several key support levels, including the 50-day Exponential Moving Average (EMA) at $114,531 and the 100-day EMA at $110,803.
The Moving Average Convergence Divergence (MACD) indicator’s decline below the mean line, while maintaining a sell signal confirmed on August 17, backs the deteriorating technical structure. Traders will likely consider de-risking as long as the blue MACD line remains below the red signal line.
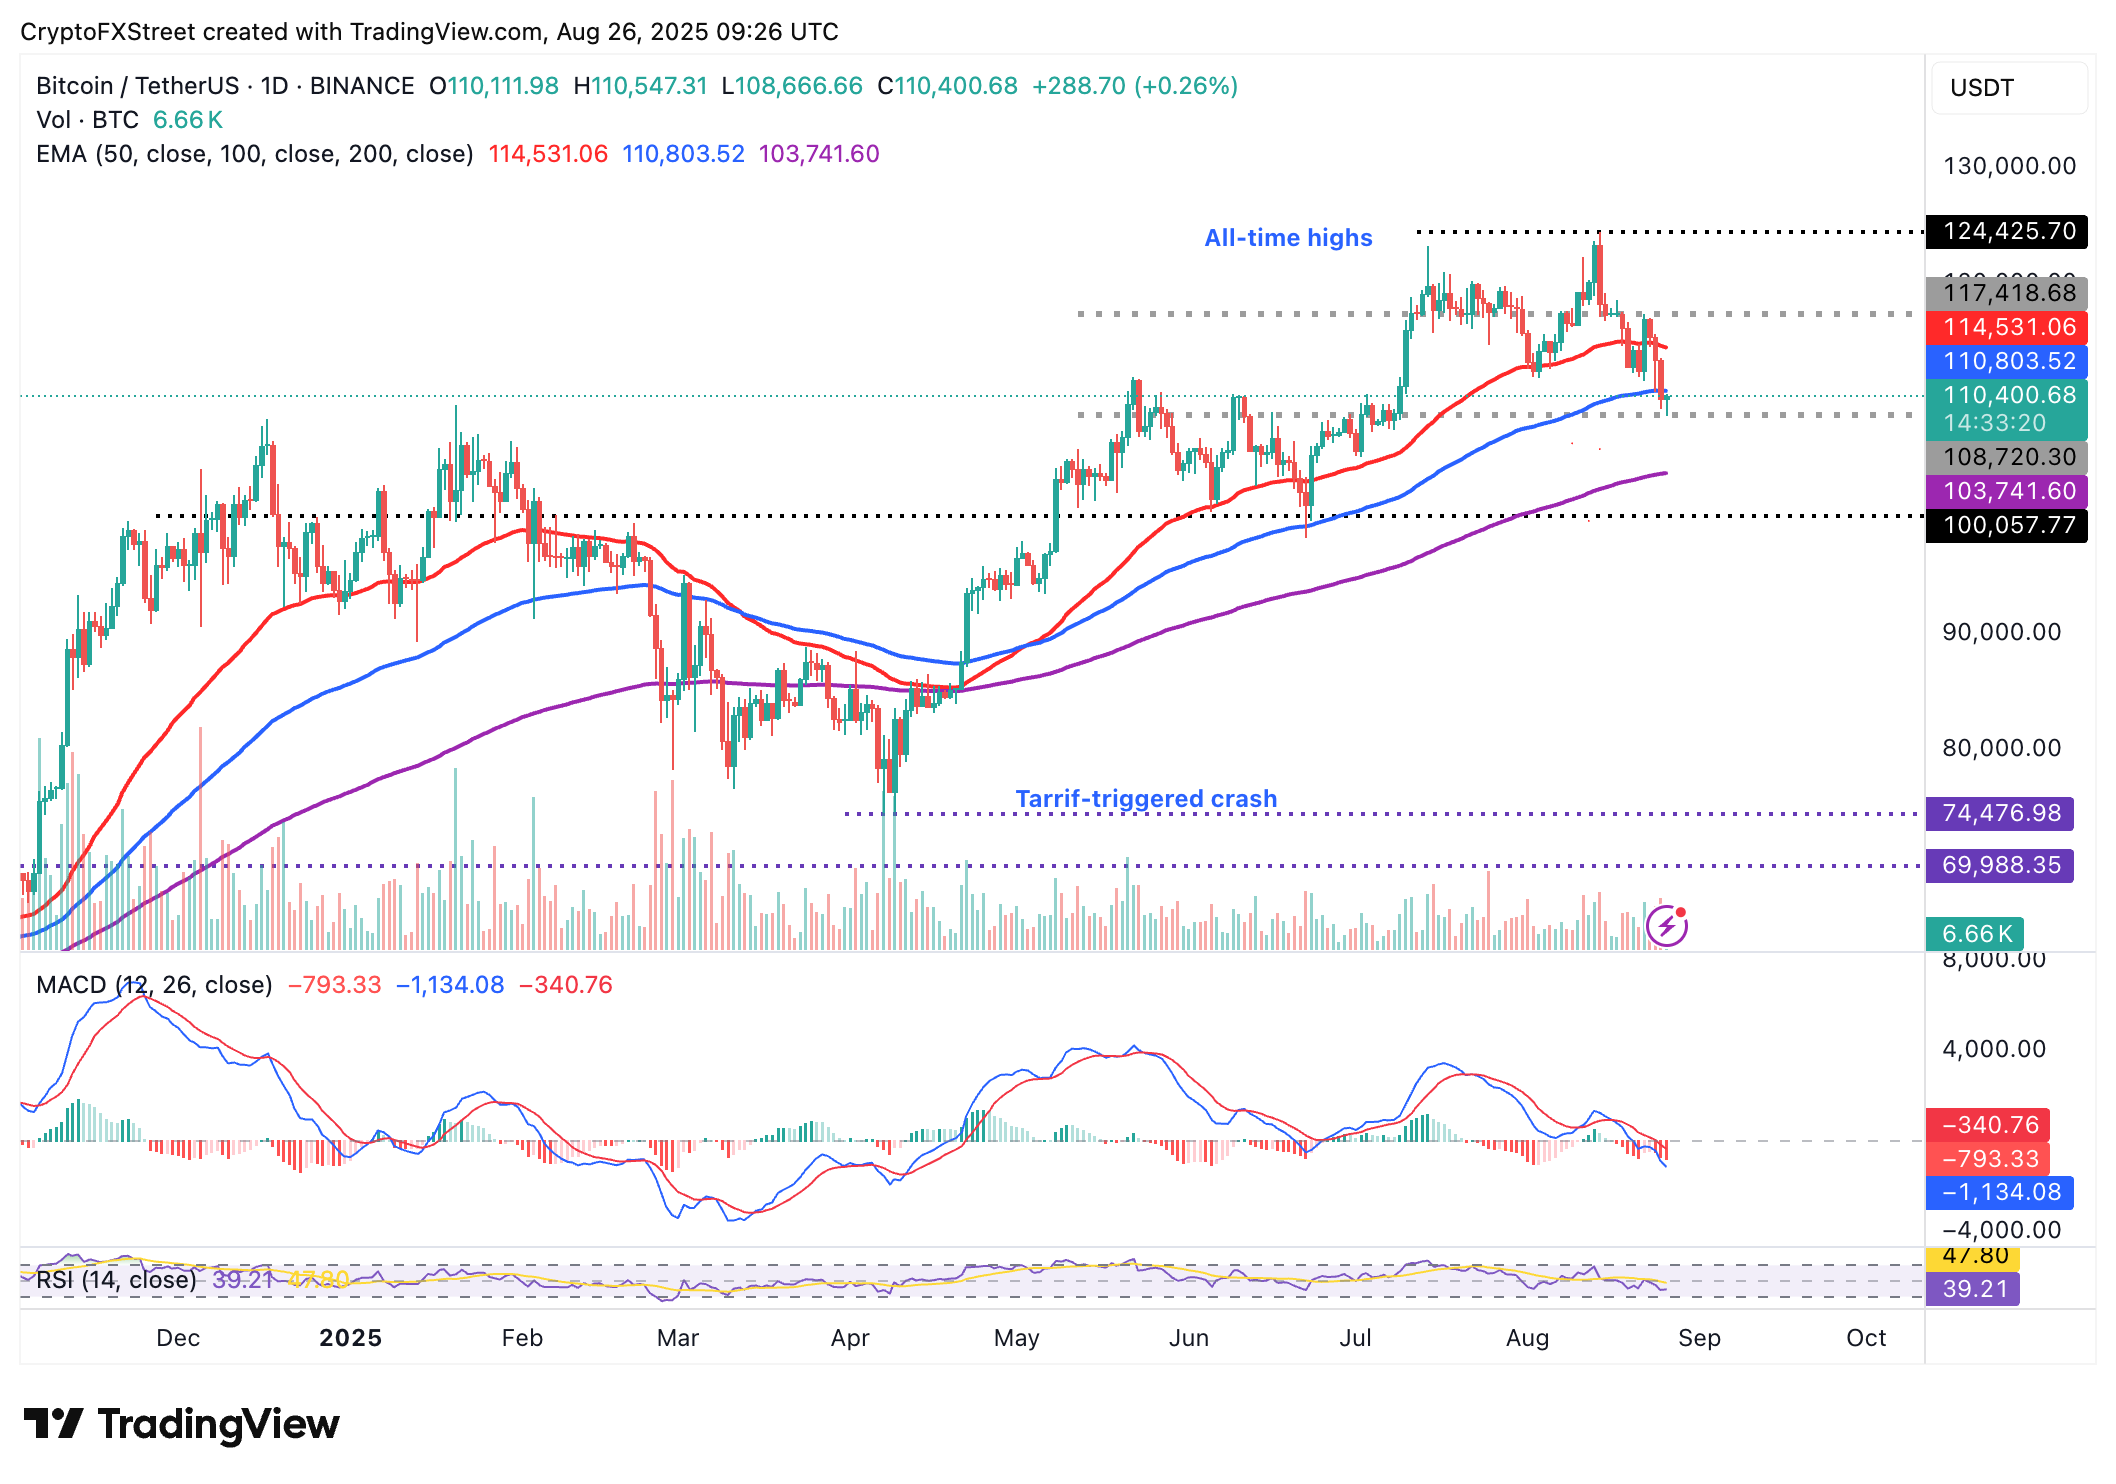
BTC/USDT daily chart
If bearish pressure accelerates and BTC extends the decline below the intraday low of $108,666, traders could shift focus to the 200-day EMA support at $103,740. In the short term, a correction to the $100,000 round-figure support level cannot be ruled out.
Altcoins update: Can Ethereum hit new record high as XRP consolidates?
Ethereum price is struggling to defy the widespread risk-off sentiment, trading above $4,400 at the time of writing. The largest smart contracts token has, since July 11, sustained a buy signal provided by the SuperTrend indicator, bolstering the bullish outlook. Ethereum also sits above the 50-day EMA at $3,881, implying bullish sentiment. Key areas of interest for traders are the new record high of around $4,955 set on Sunday and the support tested at $4,071 on August 19.
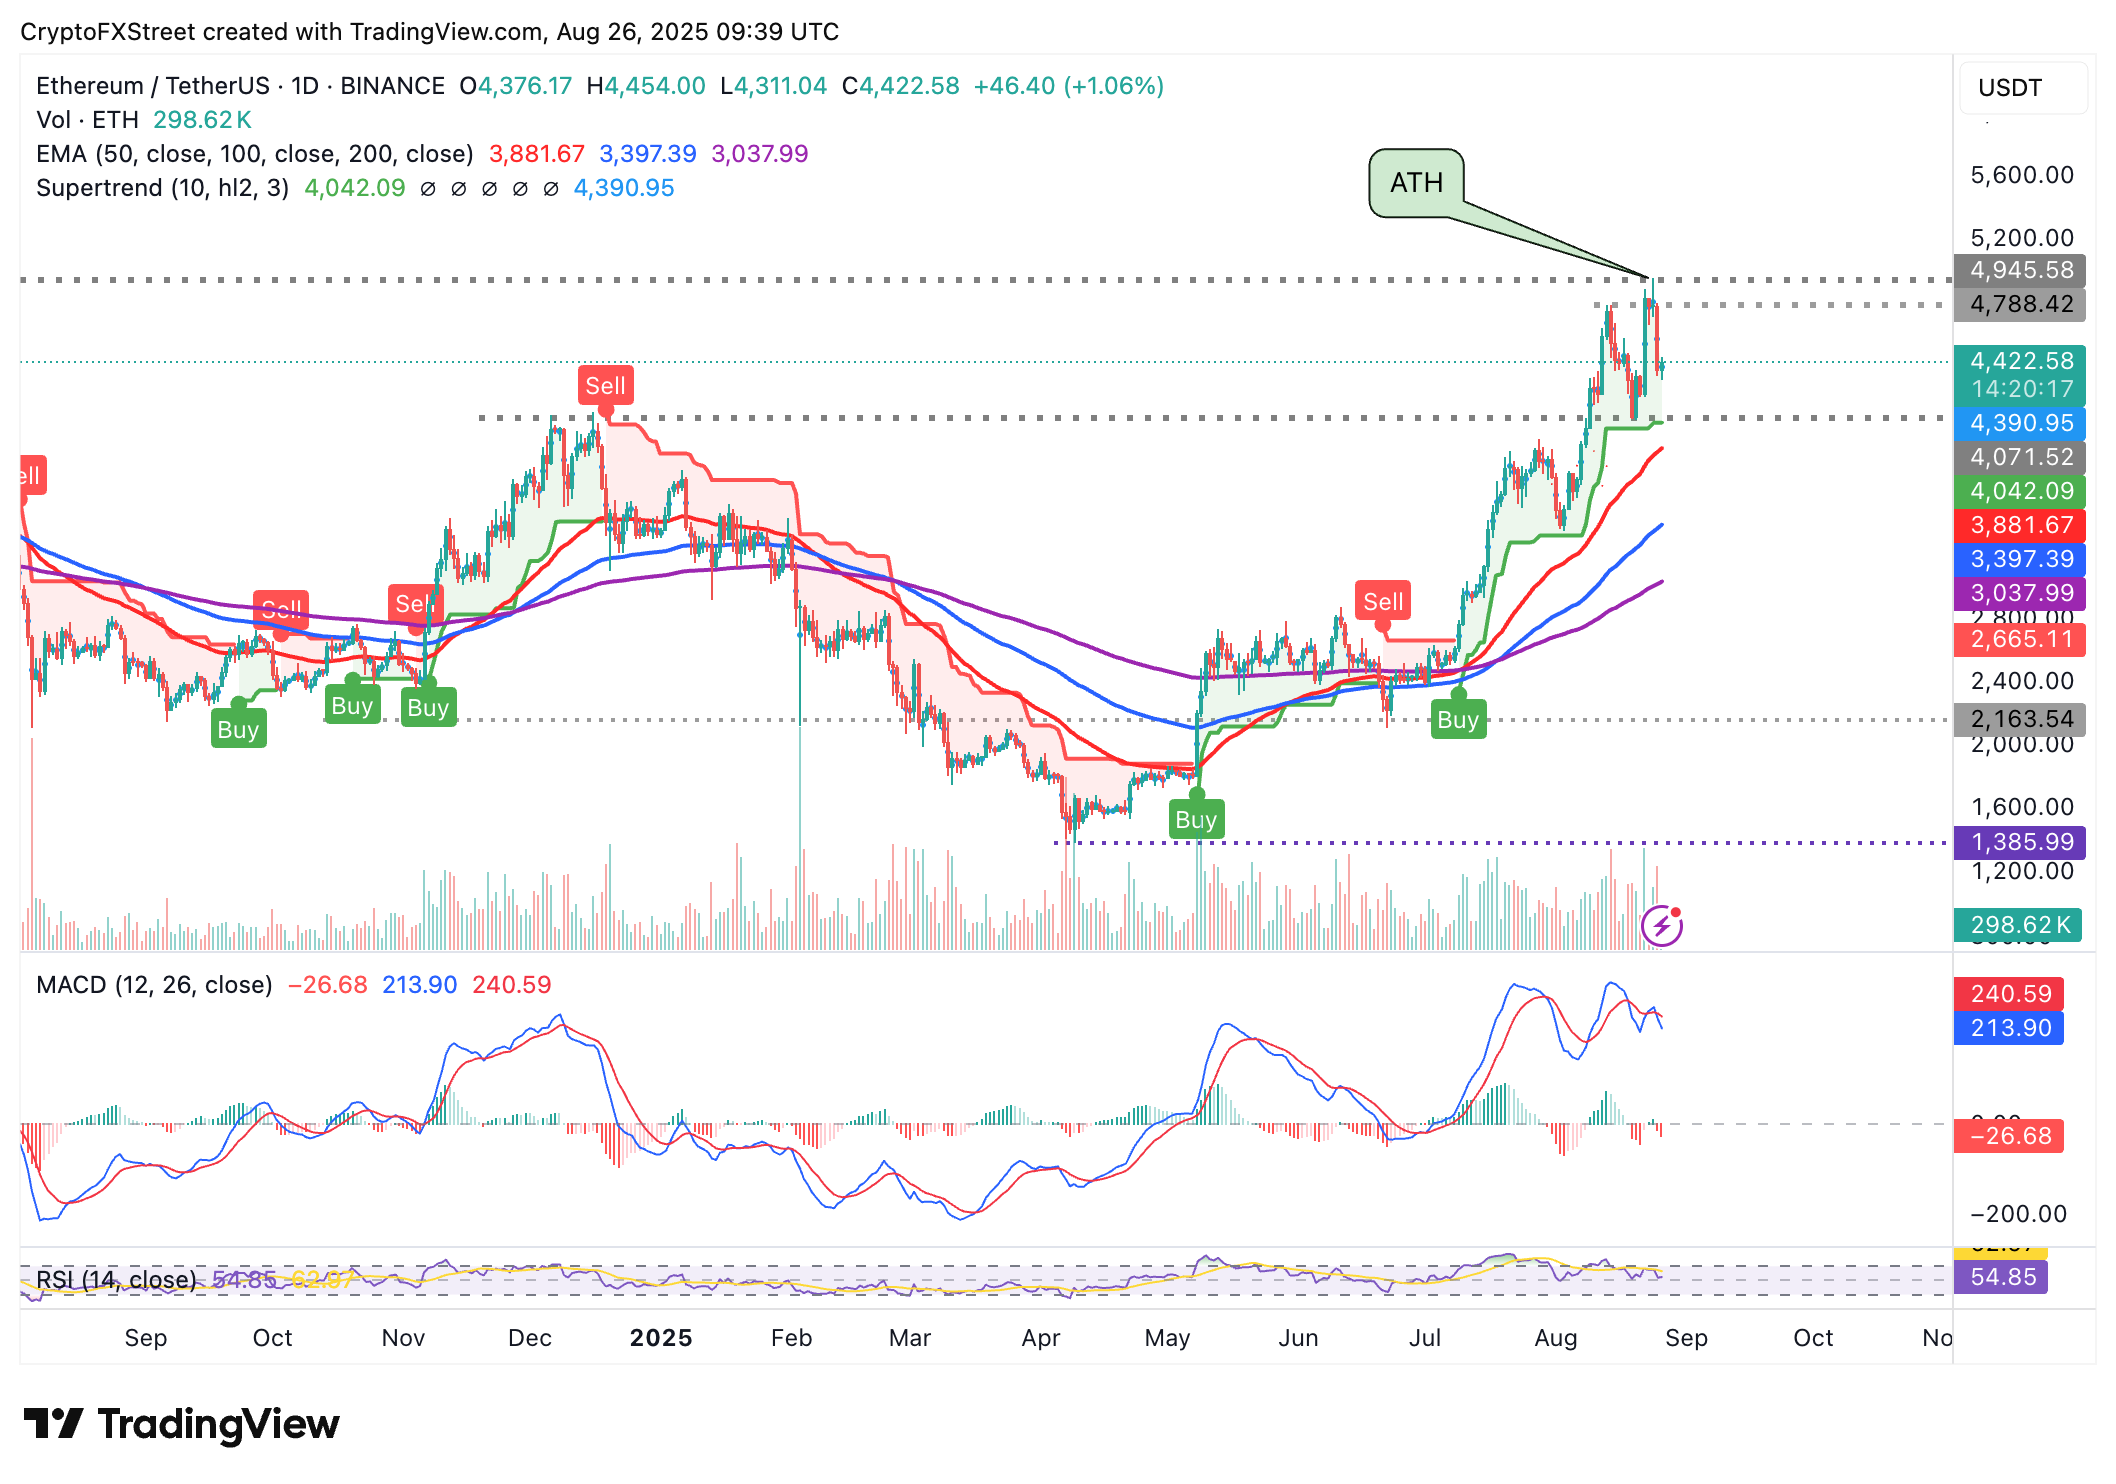
ETH/USDT daily chart
As for XRP, sellers appear to have the upper hand, with the price wobbling below the 50-day EMA at $2.94 and the pivotal $3.00 level. The MACD indicator affirms the bearish outlook, sliding below the zero line while upholding a sell signal.
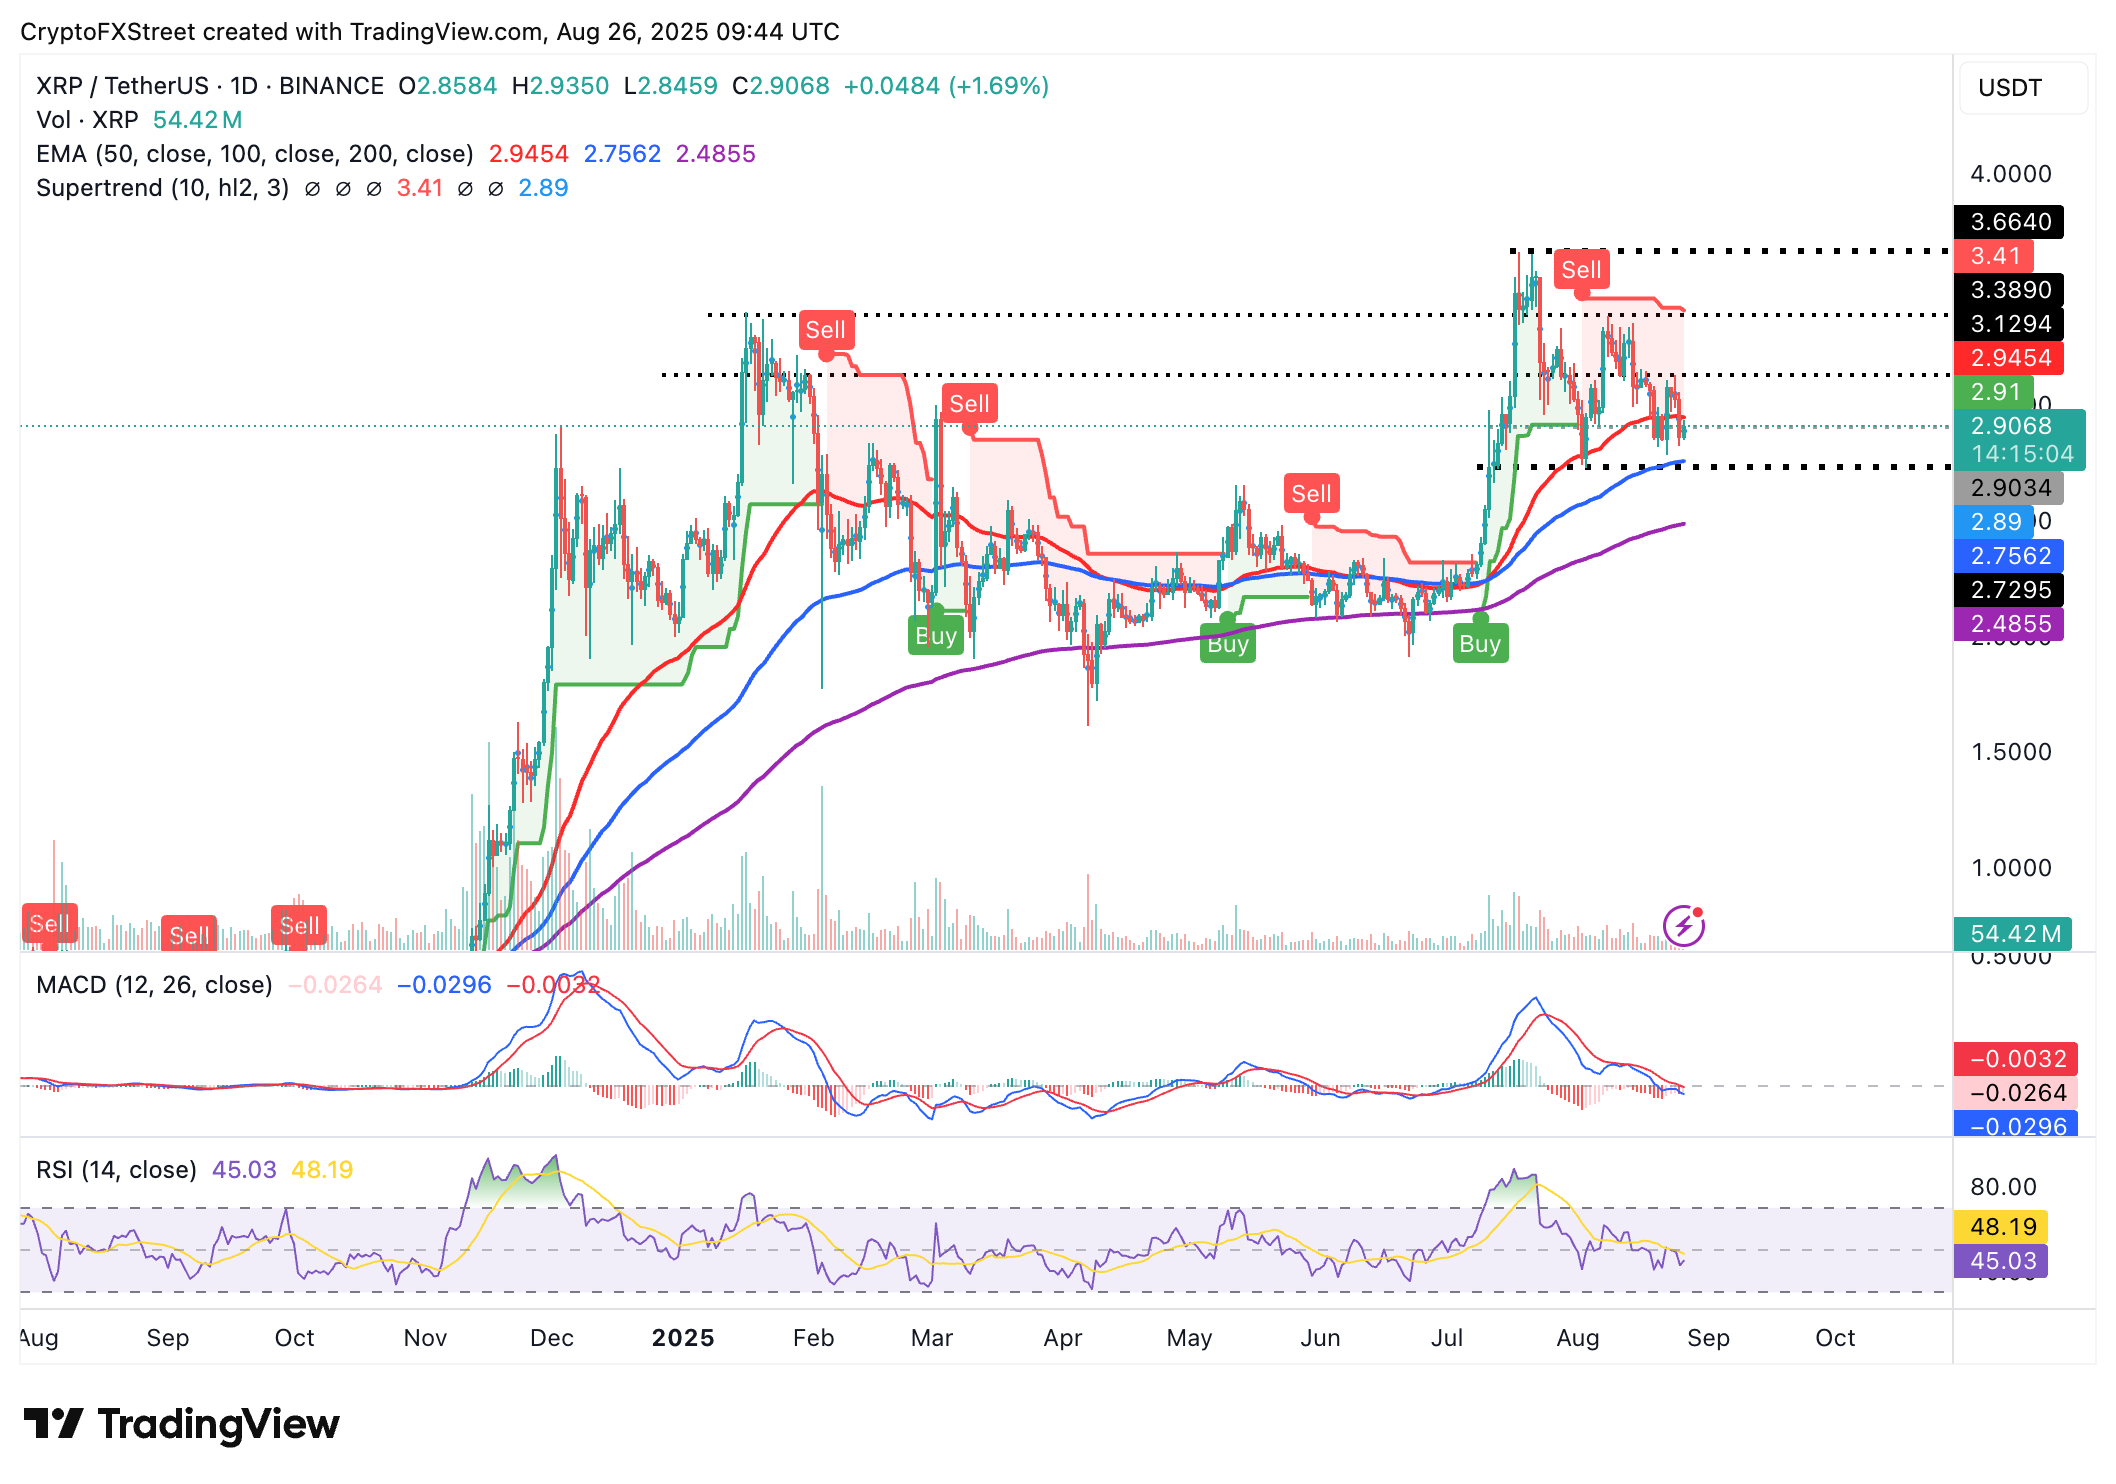
XRP/USDT daily chart
The 100-day EMA at $2.75 is in line to provide support if the downtrend accelerates, particularly with the derivatives market posting a significant drop in Open Interest as highlighted above.
A key outcome investors would be looking forward to is the resumption of the uptrend above the 50-day EMA and the $3.00 resistance level - a move likely to strengthen the bullish grip.
Bitcoin, altcoins, stablecoins FAQs
Bitcoin is the largest cryptocurrency by market capitalization, a virtual currency designed to serve as money. This form of payment cannot be controlled by any one person, group, or entity, which eliminates the need for third-party participation during financial transactions.
Altcoins are any cryptocurrency apart from Bitcoin, but some also regard Ethereum as a non-altcoin because it is from these two cryptocurrencies that forking happens. If this is true, then Litecoin is the first altcoin, forked from the Bitcoin protocol and, therefore, an “improved” version of it.
Stablecoins are cryptocurrencies designed to have a stable price, with their value backed by a reserve of the asset it represents. To achieve this, the value of any one stablecoin is pegged to a commodity or financial instrument, such as the US Dollar (USD), with its supply regulated by an algorithm or demand. The main goal of stablecoins is to provide an on/off-ramp for investors willing to trade and invest in cryptocurrencies. Stablecoins also allow investors to store value since cryptocurrencies, in general, are subject to volatility.
Bitcoin dominance is the ratio of Bitcoin's market capitalization to the total market capitalization of all cryptocurrencies combined. It provides a clear picture of Bitcoin’s interest among investors. A high BTC dominance typically happens before and during a bull run, in which investors resort to investing in relatively stable and high market capitalization cryptocurrency like Bitcoin. A drop in BTC dominance usually means that investors are moving their capital and/or profits to altcoins in a quest for higher returns, which usually triggers an explosion of altcoin rallies.
บทความแนะนำ


