
Bitcoin Price Forecast: BTC slips below $110,000, wiping out over-leverage traders
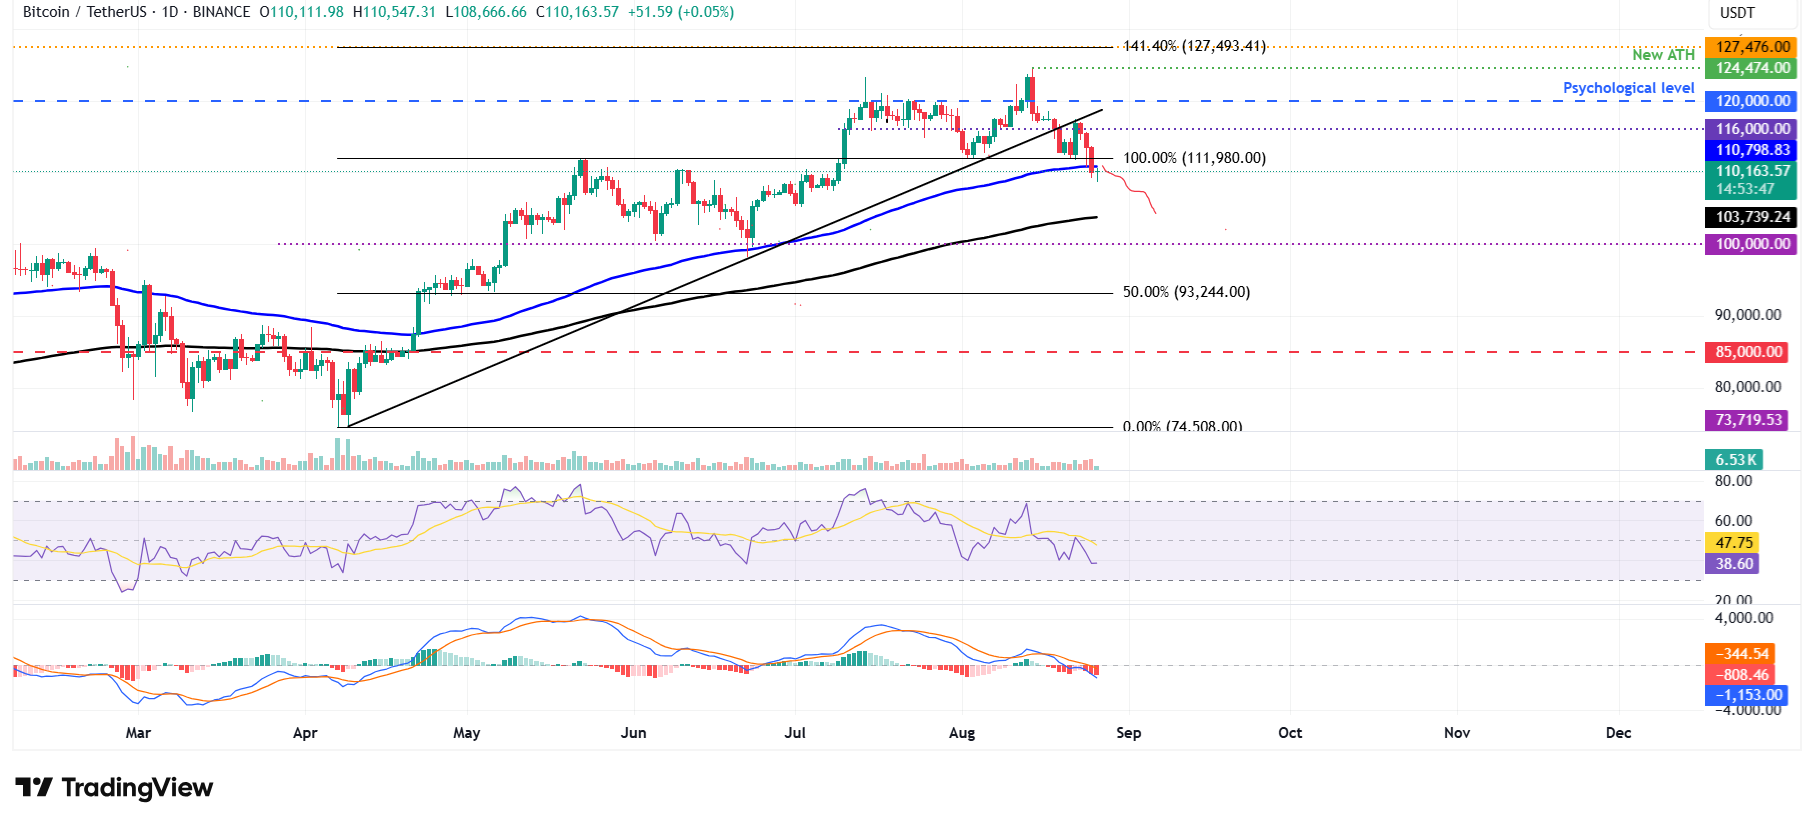
- Bitcoin price slips below its 100-day EMA at $110,800, signaling renewed weakness in price action.
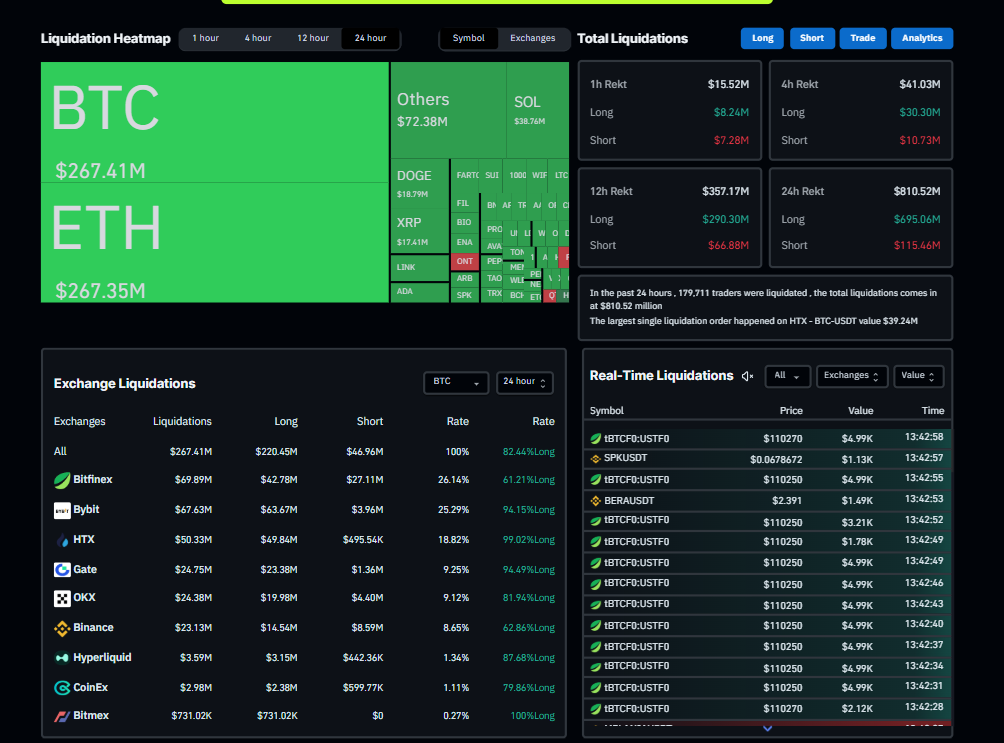
- Over 179,700 traders were liquidated in the last 24 hours, with total liquidations exceeding $800 million.
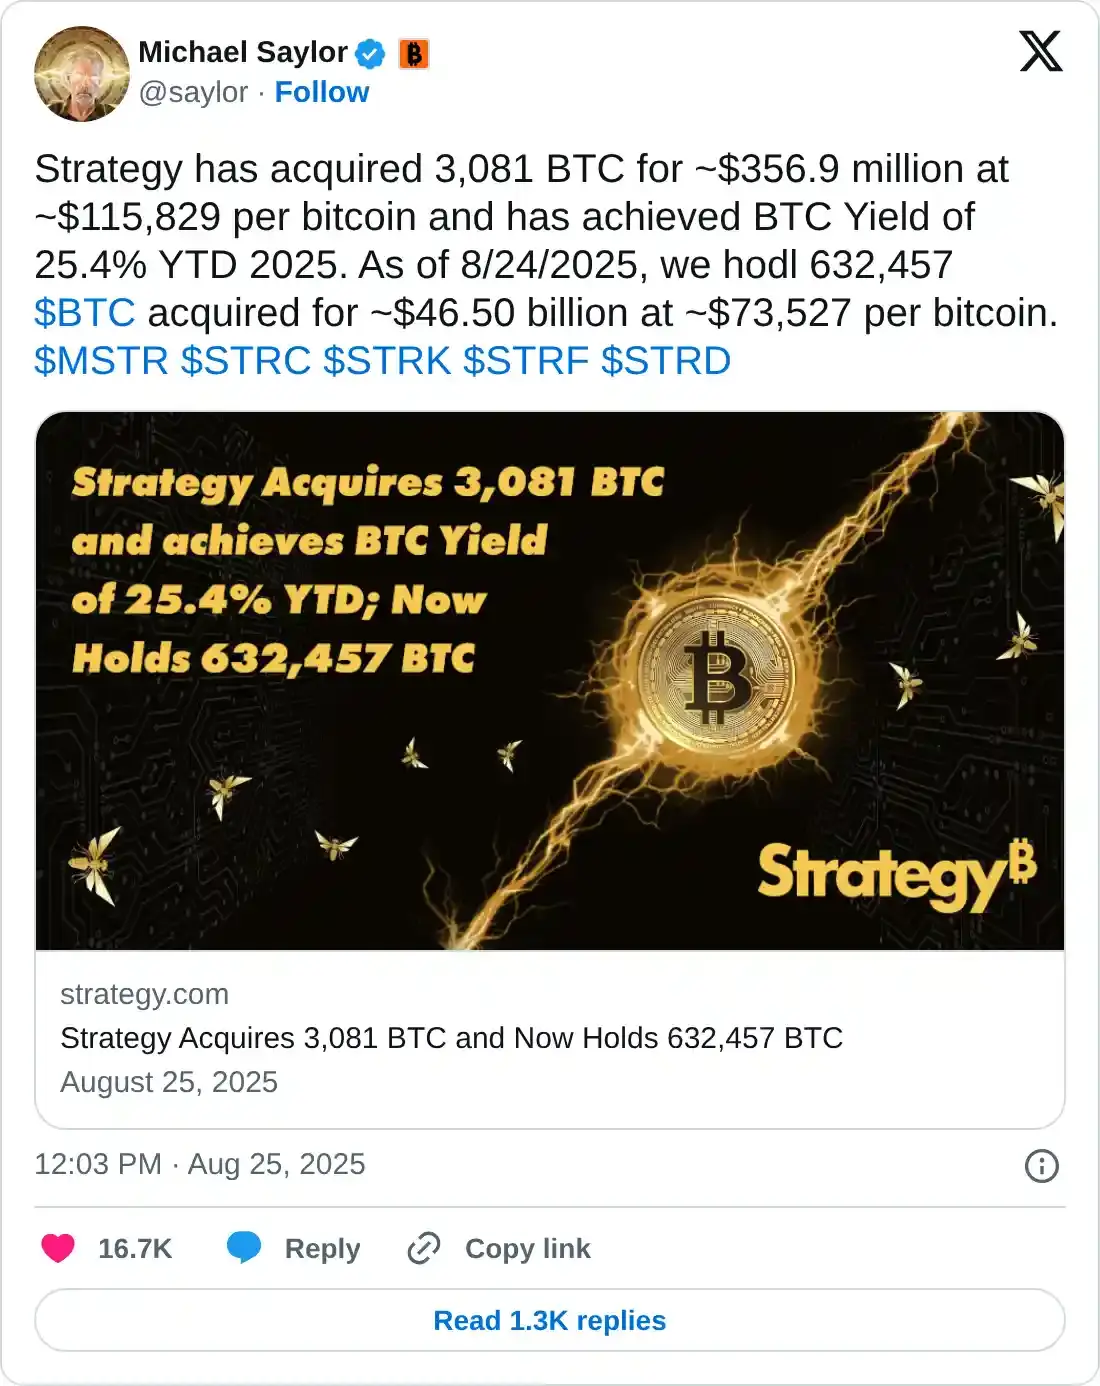
- Some optimism remains as BTC’s spot ETFs record $219 million in fresh inflows while Statergy adds 3,081 BTC to reserve.
Bitcoin (BTC) hovers around $110,100 at the time of writing on Tuesday after closing below a key support level the previous day, triggering massive liquidations across the market. More than 179,700 traders were wiped out in the past 24 hours, with losses exceeding $800 million. However, signs of resilience remain as spot Bitcoin Exchange Traded Funds (ETFs) attracted fresh inflows and Strategy added to its reserves, offering a glimmer of support for BTC.
Bitcoin correction liquidates overleveraged long positions
Bitcoin started the week on a negative note, slipping below $110,000 on Monday and reaching a low of $108,666 during the early Asian trading session on Tuesday, reflecting weak investor sentiment and fading market momentum.
This price correction in the largest cryptocurrency by market capitalization had triggered a wave of liquidation across the crypto market. CoinGlass Liquidation Map chart below shows that 179,722 traders were liquidated in the last 24 hours, with total liquidations exceeding $800 million. Over $267 million come from BTC alone, with over 82.44% of the positions being long, indicating overly bullish positioning. Apart from liquidating overleveraged long positions, the largest single liquidation occurred on Huobi exchange (HTX), where a BTC/USDT position worth $39.24 million was liquidated.
Bitcoin ETFs record fresh inflow, Statergy adds 3,081 BTC to reserve
Despite this massive correction in BTC, institutional and corporate demand added BTC during recent price dips. SoSoValue data show that Bitcoin Spot ETFs recorded an inflow of $219 million on Monday, breaking their six-day streak of outflows since August 15. If this inflow continues and intensifies, the BTC price could see some signs of recovery.
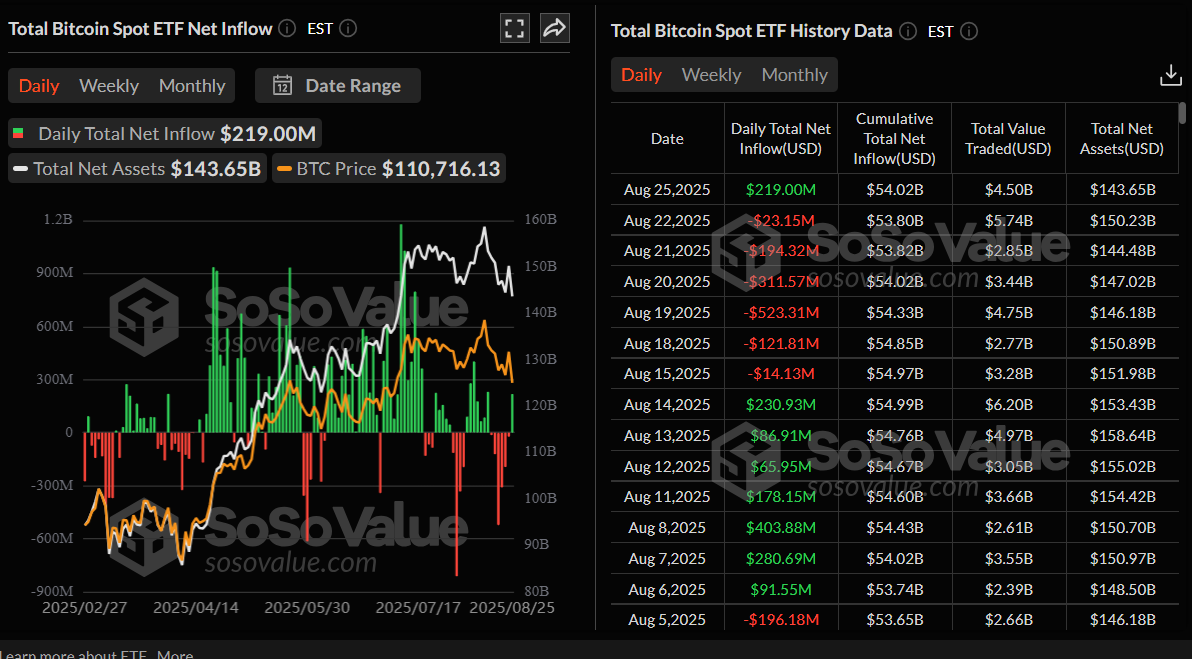
Total Bitcoin Spot ETF Net weekly inflow chart. Source: SoSoValue
On the corporate front, the demand from BTC also showed some signs of interest. Treasury companies such as Metaplanet and Strategy had added a total of 3,184 BTC on Monday, comfortably buying at these price dips.
QCP Capital reported on Monday that in the near term, “BTC appears to be ceding momentum to ETH, but our structural view on BTC is unchanged. As in July, when the market absorbed roughly 80,000 BTC of legacy supply, we expect institutions to buy dips selectively.”
Bitcoin Price Forecast: Bears aiming for $103,700 mark
Bitcoin price found rejection from its previously broken trendline on Saturday and declined more than 5% until Monday, closing below its 100-day Exponential Moving Average (EMA) at 110,798. At the time of writing on Tuesday, it hovers around $110,100.
If BTC continues its correction, it could extend the decline toward its next support level at $103,739, the 200-day EMA.
The Relative Strength Index (RSI) on the daily chart reads 38 after facing rejection from its neutral level of 50 on Friday, indicating strong bearish momentum. The Moving Average Convergence Divergence (MACD) indicator showed a bearish crossover last week and supports the bearish thesis.
BTC/USDT daily chart
However, if BTC closes above its 100-day EMA at $110,798 and finds support around it, then BTC could extend the rally toward its key resistance at $116,000.
Bitcoin, altcoins, stablecoins FAQs
Bitcoin is the largest cryptocurrency by market capitalization, a virtual currency designed to serve as money. This form of payment cannot be controlled by any one person, group, or entity, which eliminates the need for third-party participation during financial transactions.
Altcoins are any cryptocurrency apart from Bitcoin, but some also regard Ethereum as a non-altcoin because it is from these two cryptocurrencies that forking happens. If this is true, then Litecoin is the first altcoin, forked from the Bitcoin protocol and, therefore, an “improved” version of it.
Stablecoins are cryptocurrencies designed to have a stable price, with their value backed by a reserve of the asset it represents. To achieve this, the value of any one stablecoin is pegged to a commodity or financial instrument, such as the US Dollar (USD), with its supply regulated by an algorithm or demand. The main goal of stablecoins is to provide an on/off-ramp for investors willing to trade and invest in cryptocurrencies. Stablecoins also allow investors to store value since cryptocurrencies, in general, are subject to volatility.
Bitcoin dominance is the ratio of Bitcoin's market capitalization to the total market capitalization of all cryptocurrencies combined. It provides a clear picture of Bitcoin’s interest among investors. A high BTC dominance typically happens before and during a bull run, in which investors resort to investing in relatively stable and high market capitalization cryptocurrency like Bitcoin. A drop in BTC dominance usually means that investors are moving their capital and/or profits to altcoins in a quest for higher returns, which usually triggers an explosion of altcoin rallies.
บทความแนะนำ


