AAVE Price Forecast: Bears take control as technical and on-chain signals warn of double-digit drop

แหล่งที่มา Fxstreet
  • Aave price retests its previously broken ascending trendline, signaling a potential downside move.
  • On-chain and derivatives data turn bearish, with Spot Taker CVD in negative territory and short positions hitting a one-month high.
  • The technical outlook suggests weakness in momentum indicators, pointing to the likelihood of a double-digit correction in the near term.

Aave (AAVE) is facing renewed selling pressure as bearish momentum builds, with the price retesting a previously broken ascending trendline. On-chain and derivatives data further support the bearish thesis as AAVE’s Spot Taker Cumulative Volume Delta (CVD) is in negative territory, and short positions are hitting a one-month high. The technical analysis further reinforces the bearish outlook, suggesting that the AAVE token could be on the verge of a double-digit correction in the near term.

Aave’s on-chain and derivatives data show a bearish bias

CryptoQuant data, as shown in the graph below, highlights selling pressure on Aave. The Taker CVD (Cumulative Volume Delta) for AAVE is negative, and the value has been steadily decreasing since mid-July. This indicator measures the cumulative difference between market buy and sell volumes over three months. When the 90-day CVD is positive and increasing, it suggests the Taker Buy Dominant Phase, while a negative and decreasing value indicates the Taker Sell Dominant Phase.

Aave Spot Taker CVD chart. Source: CryptoQuant

Aave Spot Taker CVD chart. Source: CryptoQuant

According to Coinglass’s data, the long-to-short ratio of Aave reads 0.82 on Tuesday, the lowest value in over a month. This ratio, below one, reflects bearish sentiment in the markets, as more traders are betting on the asset price to fall.

AAVE long-to-short ratio chart. Source: Coinglass

AAVE long-to-short ratio chart. Source: Coinglass

Aave Price Forecast: AAVE bears remain in control

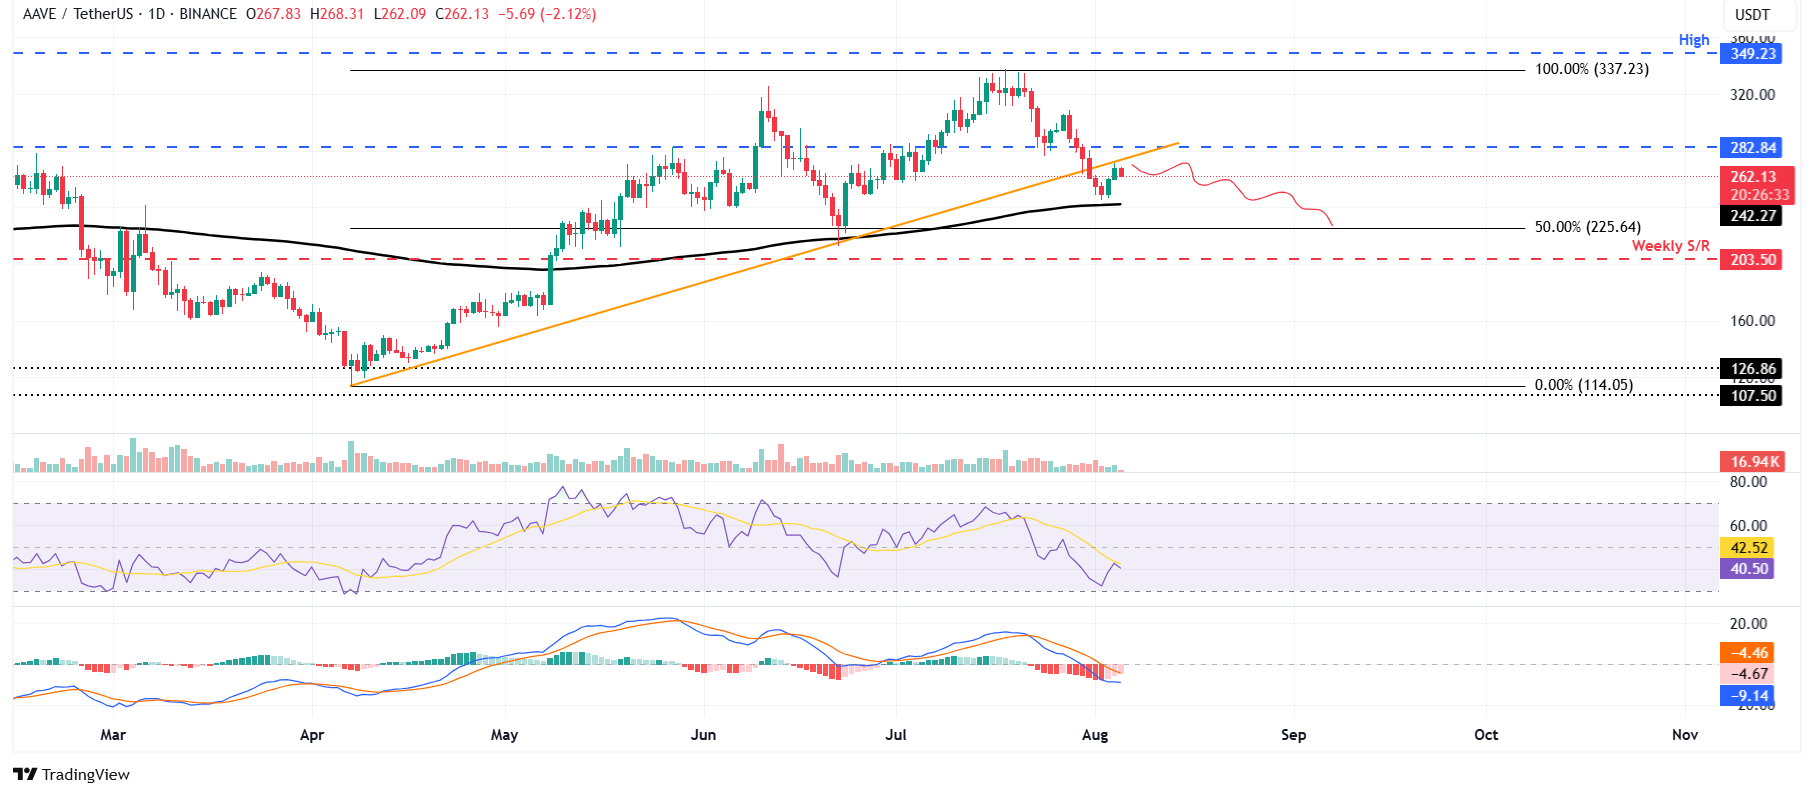
Aave price broke below the ascending trendline (drawn by connecting multiple lows since early April) on Thursday and declined 5% in the next two days. However, it found support around its 200-day Exponential Moving Average (EMA) at $242.27 on Sunday and recovered 8.68% by Monday, retesting the previously broken ascending trendline. At the time of writing on Tuesday, it trades slightly down at around $262.13.

If AAVE continues its correction, it could extend the decline to retest its 200-day EMA at $242.27. A successful close below this level could extend an additional decline toward its 50% price retracement level at $225.64.

The Relative Strength Index (RSI) reads 40, below its neutral level of 50, indicating bearish momentum. Additionally, the Moving Average Convergence Divergence (MACD) also showed a bearish crossover that still holds, suggesting bearish momentum and a downward trend.
AAVE/USDT daily chart 

AAVE/USDT daily chart 

However, if AAVE recovers and closes above its daily resistance level at $282.84, it could extend the rally toward its July 18 high of $349.23.

ข้อจำกัดความรับผิดชอบ: เพื่อการอ้างอิงเท่านั้น ผลการดำเนินงานในอดีตไม่ได้บ่งบอกถึงผลลัพธ์ในอนาคต
placeholder
AUD/JPY พุ่งขึ้นใกล้ 98.00 ขณะที่ RBA คงอัตราดอกเบี้ยไว้ที่ 3.6% ตามที่คาดการณ์ไว้คู่ AUD/JPY ปรับตัวขึ้นใกล้ระดับ 98.00 เนื่องจากสกุลเงินดอลลาร์ออสเตรเลีย (AUD) แข็งค่าขึ้นหลังจากการประกาศจากธนาคารกลางออสเตรเลีย (RBA) ว่าสมาชิกได้ตัดสินใจคงอัตราดอกเบี้ยนโยบาย (OCR) ไว้ที่ 3.6%
ผู้เขียน  FXStreet
9 เดือน 30 วัน อังคาร
คู่ AUD/JPY ปรับตัวขึ้นใกล้ระดับ 98.00 เนื่องจากสกุลเงินดอลลาร์ออสเตรเลีย (AUD) แข็งค่าขึ้นหลังจากการประกาศจากธนาคารกลางออสเตรเลีย (RBA) ว่าสมาชิกได้ตัดสินใจคงอัตราดอกเบี้ยนโยบาย (OCR) ไว้ที่ 3.6%
placeholder
WTI ร่วงต่ำกว่า $63.00 จากแผนการปรับเพิ่มการผลิตของ OPEC+ราคาน้ำมัน West Texas Intermediate (WTI) ยังคงลดลง โดยซื้อขายอยู่ที่ประมาณ 62.90 ดอลลาร์ต่อบาร์เรลในช่วงเช้าของวันอังคารในเอเชีย
ผู้เขียน  FXStreet
9 เดือน 30 วัน อังคาร
ราคาน้ำมัน West Texas Intermediate (WTI) ยังคงลดลง โดยซื้อขายอยู่ที่ประมาณ 62.90 ดอลลาร์ต่อบาร์เรลในช่วงเช้าของวันอังคารในเอเชีย
placeholder
การคาดการณ์ราคาเงิน: XAGUSD เคลื่อนไหวต่ำกว่า 47.00 ดอลลาร์ ใกล้ระดับสูงสุดตั้งแต่เดือนพฤษภาคม 2011โลหะเงิน (XAG/USD) ยังคงถูกจำกัดอยู่ในกรอบราคาใกล้ระดับสูงสุดนับตั้งแต่เดือนพฤษภาคมปี 2011 ที่แตะไปเมื่อวันก่อน และซื้อขายอยู่ต่ำกว่าระดับ $47.00 ในช่วงเซสชั่นเอเชียวันอังคาร
ผู้เขียน  FXStreet
9 เดือน 30 วัน อังคาร
โลหะเงิน (XAG/USD) ยังคงถูกจำกัดอยู่ในกรอบราคาใกล้ระดับสูงสุดนับตั้งแต่เดือนพฤษภาคมปี 2011 ที่แตะไปเมื่อวันก่อน และซื้อขายอยู่ต่ำกว่าระดับ $47.00 ในช่วงเซสชั่นเอเชียวันอังคาร
placeholder
คาดการณ์ราคาทองคำ: XAU/USD พุ่งขึ้นไปที่ $3,820 ท่ามกลางความเป็นไปได้ของการปิดรัฐบาลสหรัฐทองคํากำลังซื้อขายอยู่เหนือ $3,800 หลังจากทำจุดสูงสุดใหม่ตลอดกาลที่ $3,819 ในช่วงเซสชันยุโรปของวันจันทร์ โดยโลหะมีค่ากำลังเติบโตและดอลลาร์สหรัฐอ่อนค่าลง ขณะที่นักลงทุนเตรียมพร้อมสำหรับความเป็นไปได้ในการปิดรัฐบาลสหรัฐในวันพุธ ทรัมป์คาดว่าจะพบกับผู้นำรัฐสภาสองพรรค
ผู้เขียน  FXStreet
9 เดือน 29 วัน จันทร์
ทองคํากำลังซื้อขายอยู่เหนือ $3,800 หลังจากทำจุดสูงสุดใหม่ตลอดกาลที่ $3,819 ในช่วงเซสชันยุโรปของวันจันทร์ โดยโลหะมีค่ากำลังเติบโตและดอลลาร์สหรัฐอ่อนค่าลง ขณะที่นักลงทุนเตรียมพร้อมสำหรับความเป็นไปได้ในการปิดรัฐบาลสหรัฐในวันพุธ ทรัมป์คาดว่าจะพบกับผู้นำรัฐสภาสองพรรค
placeholder
การคาดการณ์ราคา EUR/JPY: มุมมองเชิงบวกยังคงมีอยู่เหนือ 174.50ในช่วงเช้าของตลาดลงทุนยุโรปวันจันทร์ คู่ EURJPY ปรับตัวลดลงไปที่ประมาณ 174.75 เงินเยนญี่ปุ่น (JPY) แข็งค่าขึ้นเมื่อเทียบกับเงินยูโร (EUR) ท่ามกลางการไหลเข้าของเงินทุนที่ปลอดภัย เนื่องจากรัฐบาลสหรัฐฯ มีความเสี่ยงที่จะปิดทำการ อย่างไรก็ตาม ความไม่แน่นอนทางการเมืองในญี่ปุ่นอาจจำกัดการปรับตัวขาขึ้นของ JPY
ผู้เขียน  FXStreet
9 เดือน 29 วัน จันทร์
ในช่วงเช้าของตลาดลงทุนยุโรปวันจันทร์ คู่ EURJPY ปรับตัวลดลงไปที่ประมาณ 174.75 เงินเยนญี่ปุ่น (JPY) แข็งค่าขึ้นเมื่อเทียบกับเงินยูโร (EUR) ท่ามกลางการไหลเข้าของเงินทุนที่ปลอดภัย เนื่องจากรัฐบาลสหรัฐฯ มีความเสี่ยงที่จะปิดทำการ อย่างไรก็ตาม ความไม่แน่นอนทางการเมืองในญี่ปุ่นอาจจำกัดการปรับตัวขาขึ้นของ JPY
ตราสารที่เกี่ยวข้อง
goTop
quote