
Jupiter Price Forecast: JUP eyes further gains amid record high TVL, $150M DeFi lending boost
- Jupiter allocates $150 million in USDC to JLP loans, boosting DeFi lending.
- The total value locked on Jupiter hits a record high of $2.97 billion.
- The technical outlook suggests an extended rally as Jupiter gains bullish momentum.
Jupiter (JUP) edges higher by over 7% at press time on Tuesday, extending the uptrend for the fourth consecutive day. The momentum grows as Jupiter announces a $150 million USDC allocation to its Jupiter Liquidity Provider (JLP) loans, aiming to boost its Decentralized Finance (DeFi) lending.
Furthermore, the Total Value Locked (TVL) on Jupiter hits a record high as it inches closer to the $3 billion mark. Amid such conditions, the technical outlook indicates an increase in bullish momentum, suggesting further gains.
Jupiter’s $150 million plan to boost DeFi lending
Jupiter announced a 150 million USDC allocation to JLP loans, providing additional liquidity to its DeFi lending service against yield-bearing JLP tokens. The protocol also states that in the event of liquidation, the JLP tokens are burned to redeem locked assets, rather than forcing market selling.
DeFiLlama data shows the TVL on Jupiter has hit a record high of $2.97 billion, up from $2.81 billion on Monday. Typically, TVL refers to the US Dollar value of the total crypto assets locked on a protocol, suggesting increased adoption if TVL rises.
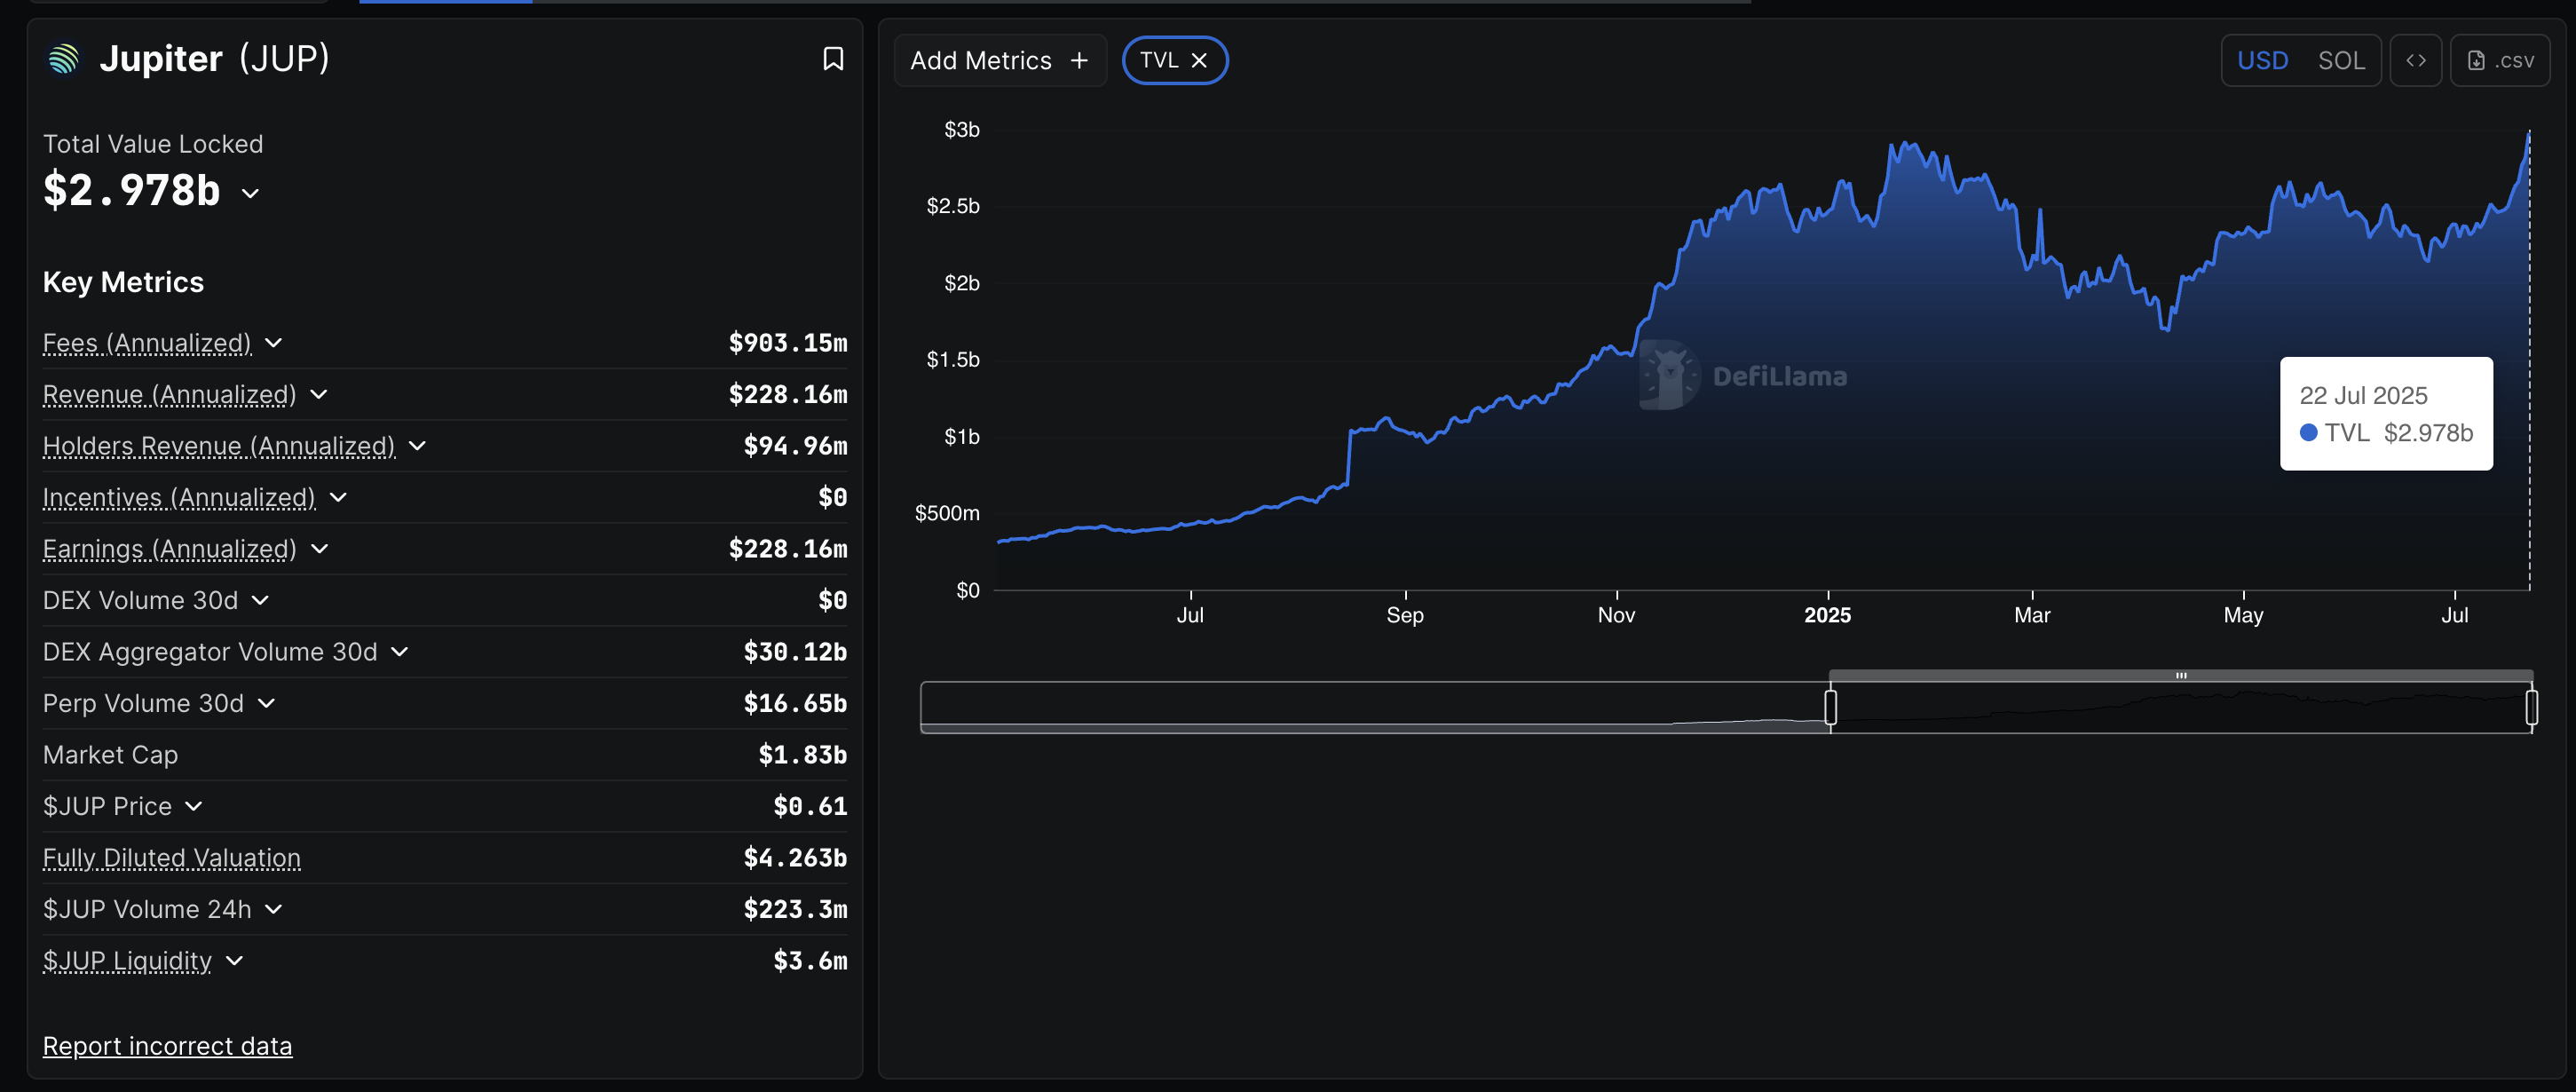
JUP TVL chart. Source: DeFiLlama
JUP Open Interest crosses $200 million
Coinglass’ data shows a 36% rise in JUP Open Interest (OI) over the last 24 hours, reaching $202.45 million. A spike in OI refers to rising capital inflows, a sign of increased confidence among traders.
The OI-weighted funding rate, at 0.0110%, is up from 0.0055% on Monday, indicating a bullish trend in capital inflows. Bulls pay the positive funding rates to balance swap and spot prices, which are misaligned due to increased buying pressure, and vice versa.
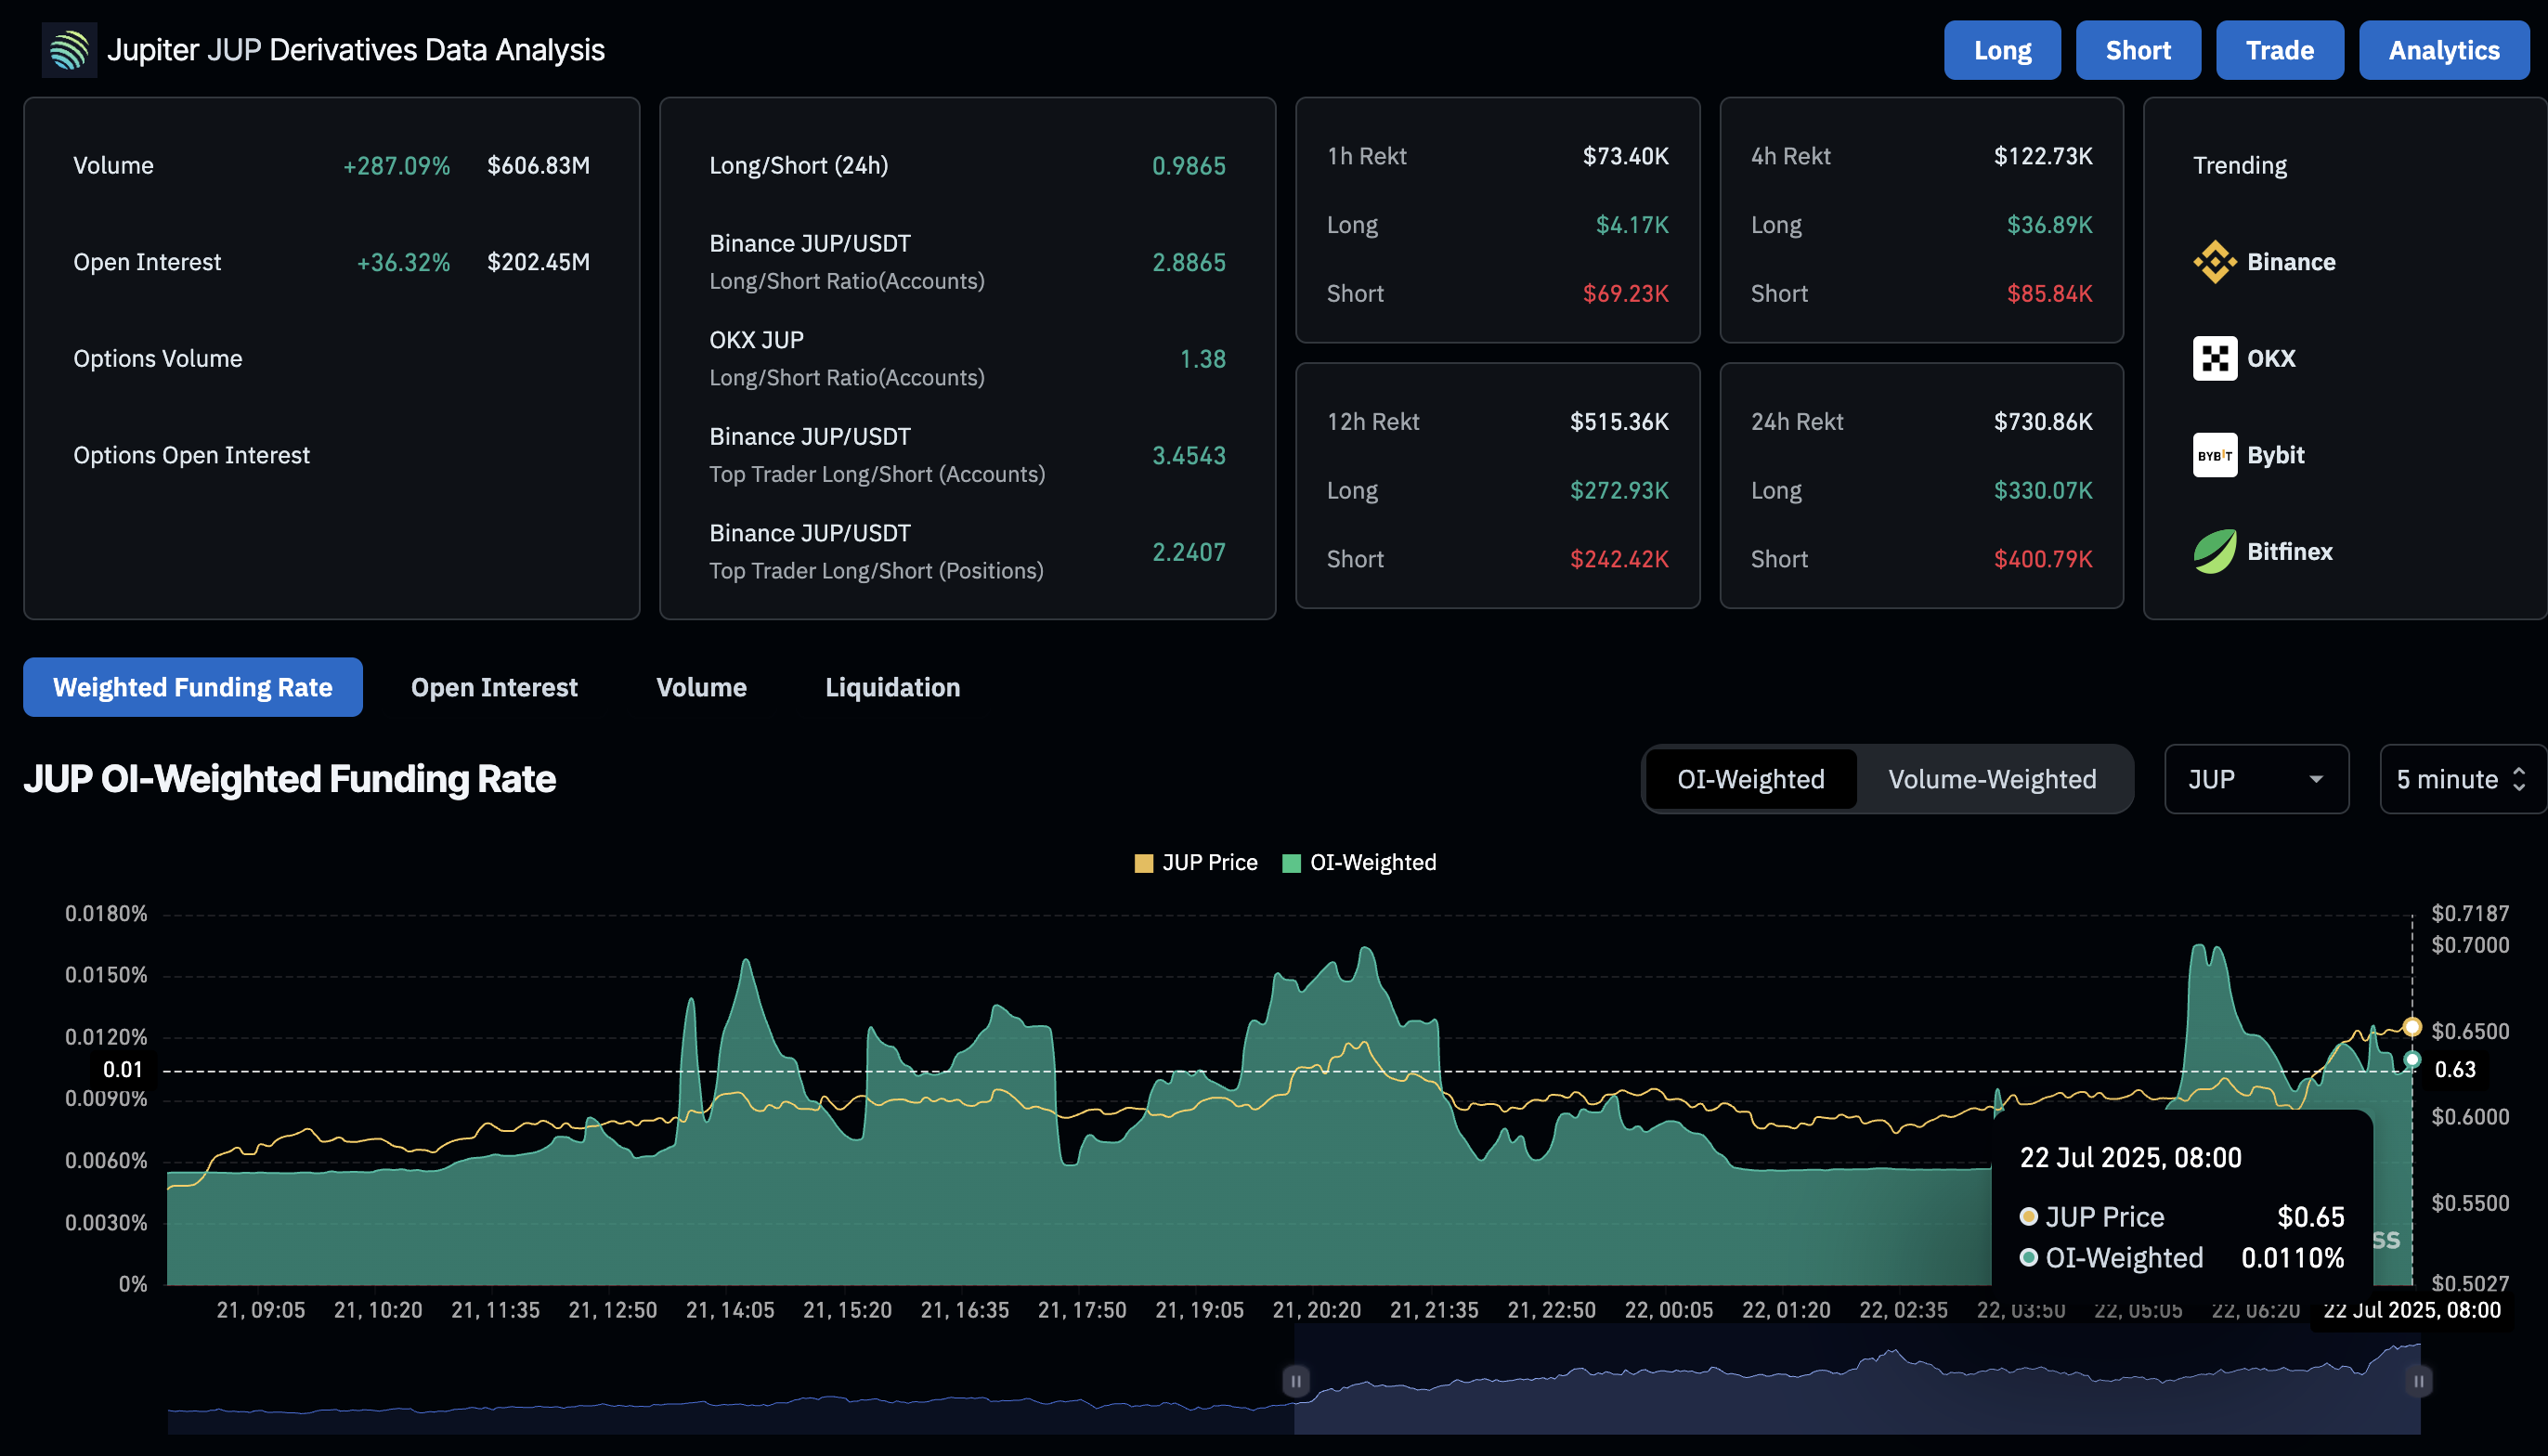
Jupiter derivatives data. Source: Coinglass
Jupiter builds bullish momentum, targeting $0.74
Jupiter’s recovery run surpasses the 200-day Exponential Moving Average (EMA) at $0.5836 and the $0.6339 resistance level, last tested on Monday. With its fourth consecutive bullish candle, JUP has recorded an over 40% rise so far in July.
A decisive daily close above $0.6339 could extend the bullish run to $0.7459, marked by the low of December 20.
The Moving Average Convergence/Divergence (MACD) and its signal line avoid a crossover with resurgence of green histograms from the zero line, suggesting an increase in bullish momentum.
The Relative Strength Index (RSI) reads 85 on the daily chart, indicating overbought conditions as buying pressure grows.
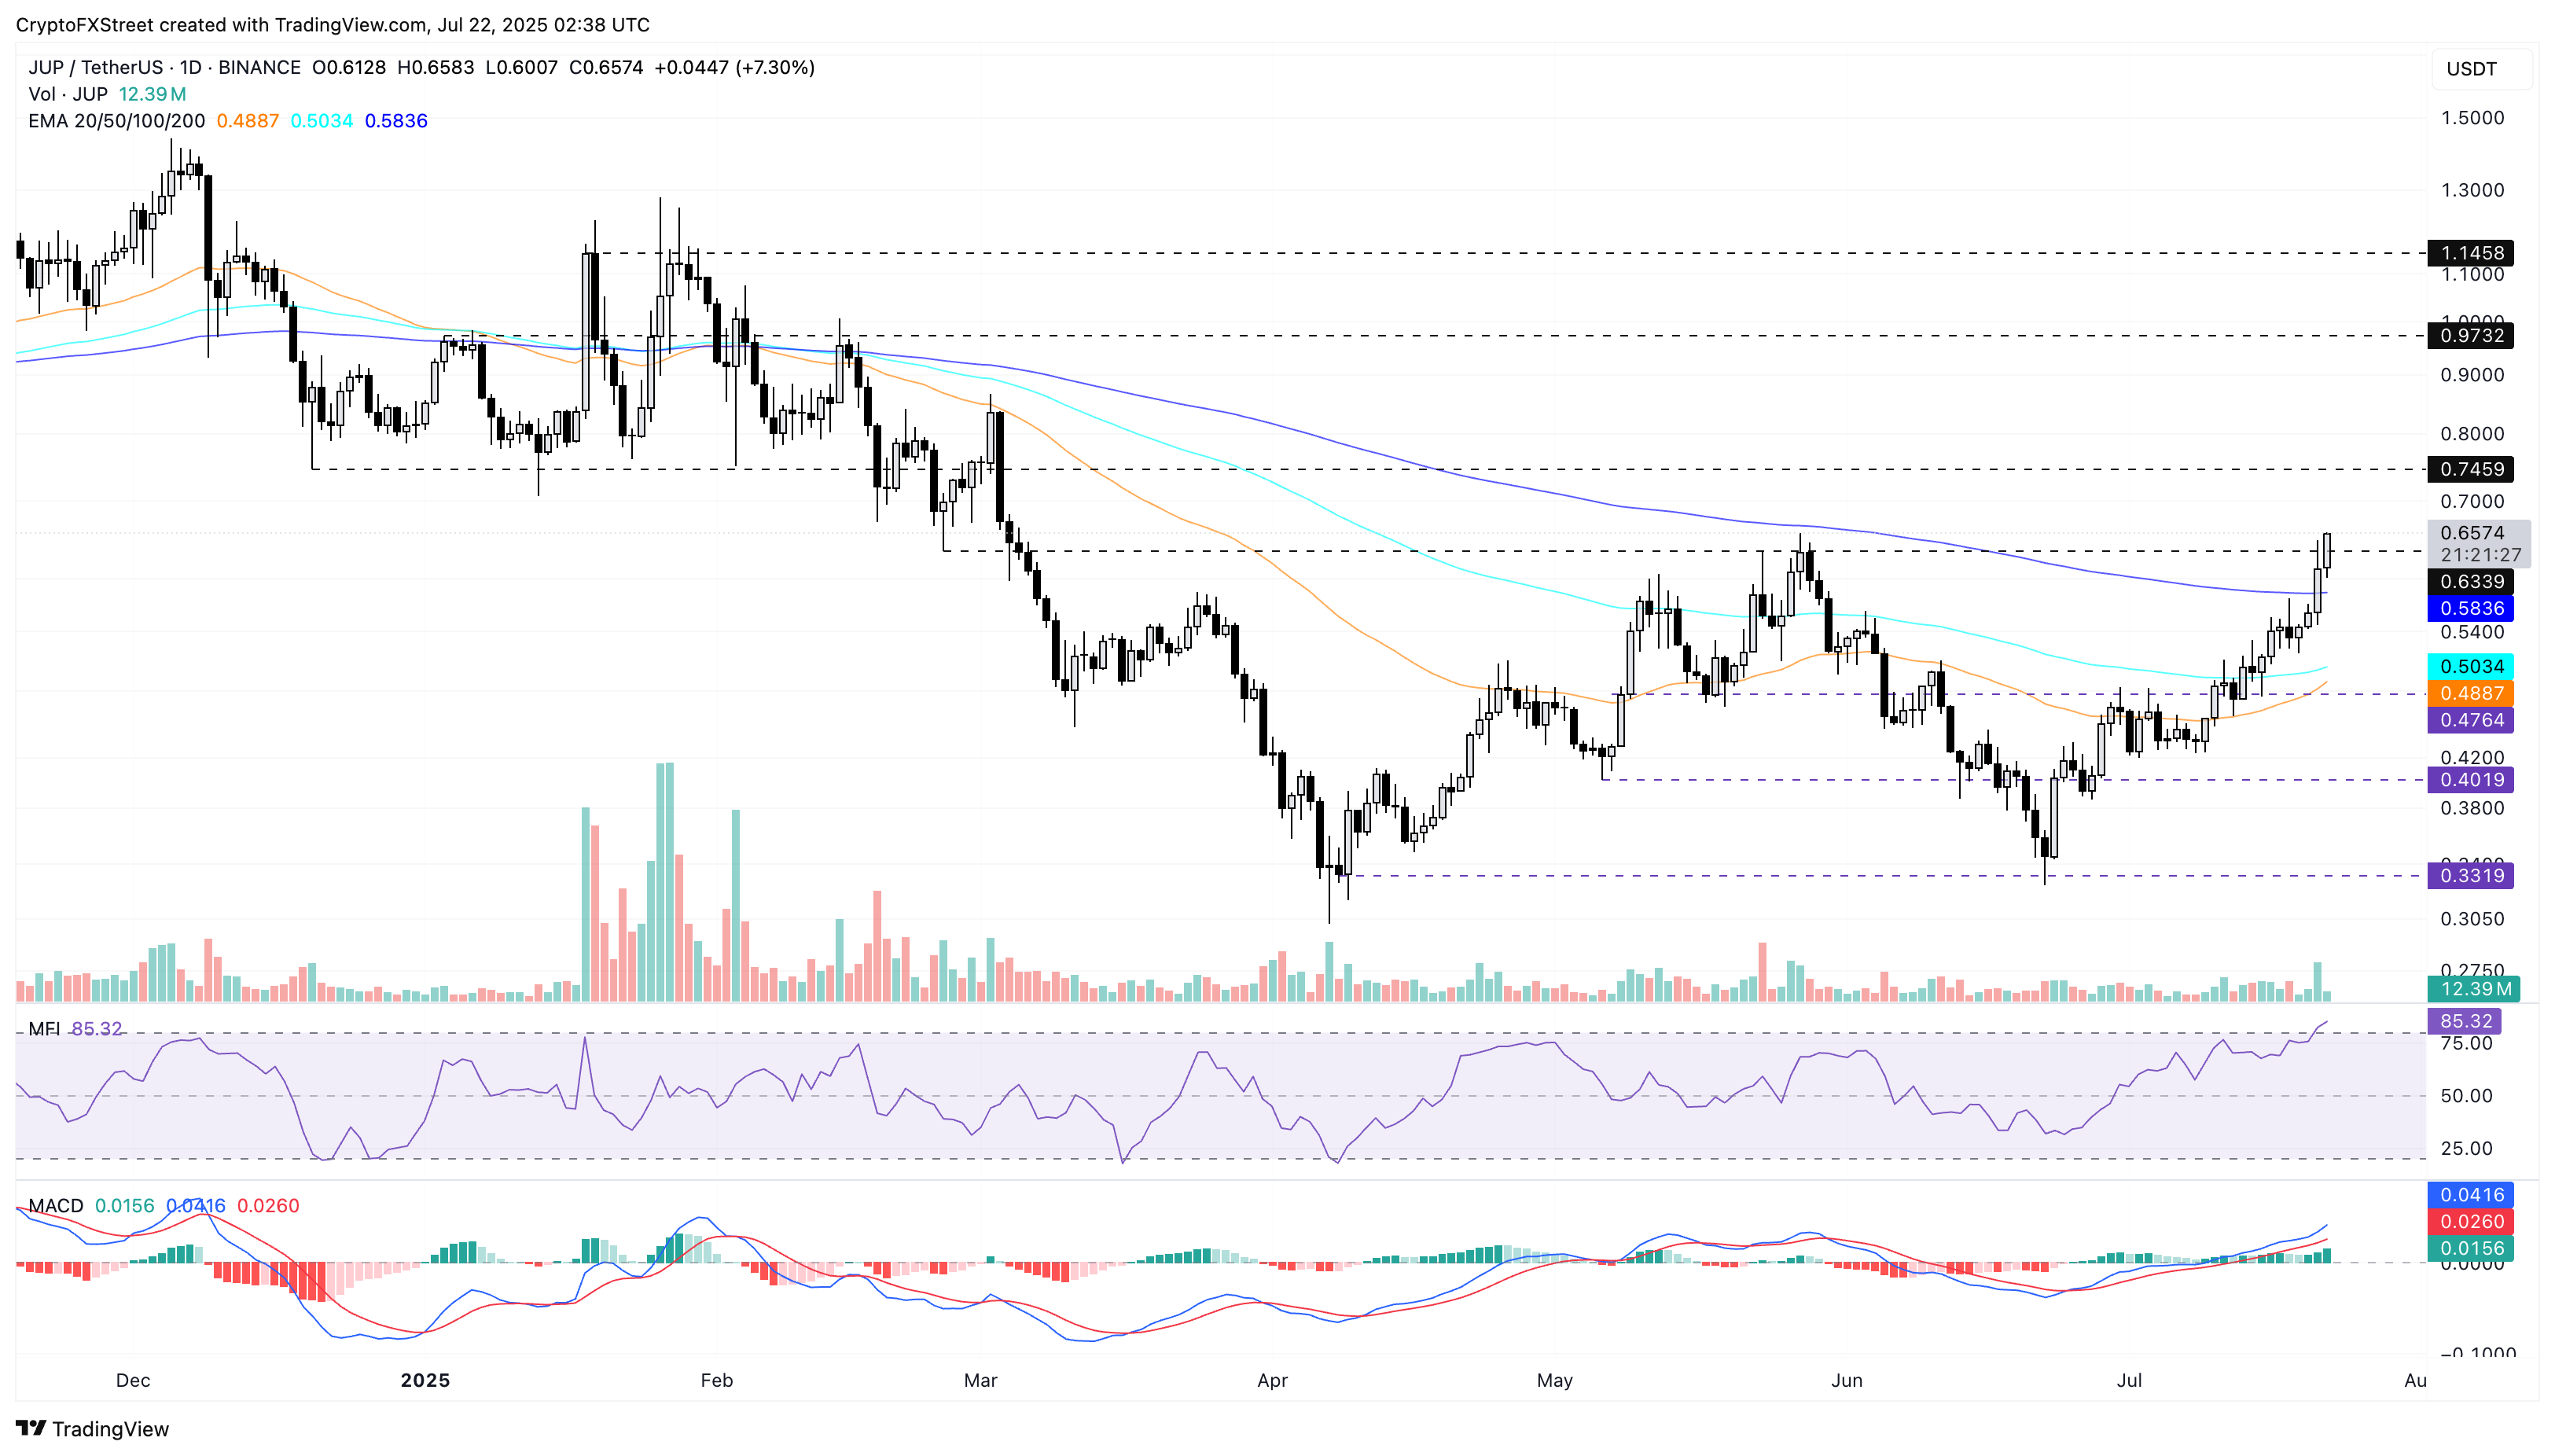
JUP/USDT daily price chart.
On the flip side, if Jupiter fails to hold a daily close above $0.6339, a bearish reversal could retest the 200-day EMA at $0.5836, followed by the 100-day EMA at $0.5031.
Artigos Recomendados


