
PYTH Network Price Forecast: PYTH bulls gain momentum amid rising network activity, Open Interest
- PYTH edges higher for the seventh consecutive day, surpassing an eight-month resistance trendline.
- Increased transactions suggest heightened activity on the Pyth Network.
- PYTH Open Interest exceeds $50 million as optimism grows in the derivatives market.
Pyth Network (PYTH) edges higher by nearly 2% at press time on Monday, extending the almost 10% jump from Sunday. The bullish run aligns with the rising network activity and the increasing Open Interest. The technical outlook suggests further gains as PYTH gains momentum with the breakout of an eight-month-old resistance trendline.
Transaction count signals increased Pyth Network activity
DappRadar’s data shows heightened activity on the Pyth Network in the last 90 days. Pyth Network recorded 213.64k daily transactions on Sunday, up from the low of 170.89k transactions on Wednesday.
An increase in transaction count reflects a surge in user activity, increasing the demand for the native token, PYTH.
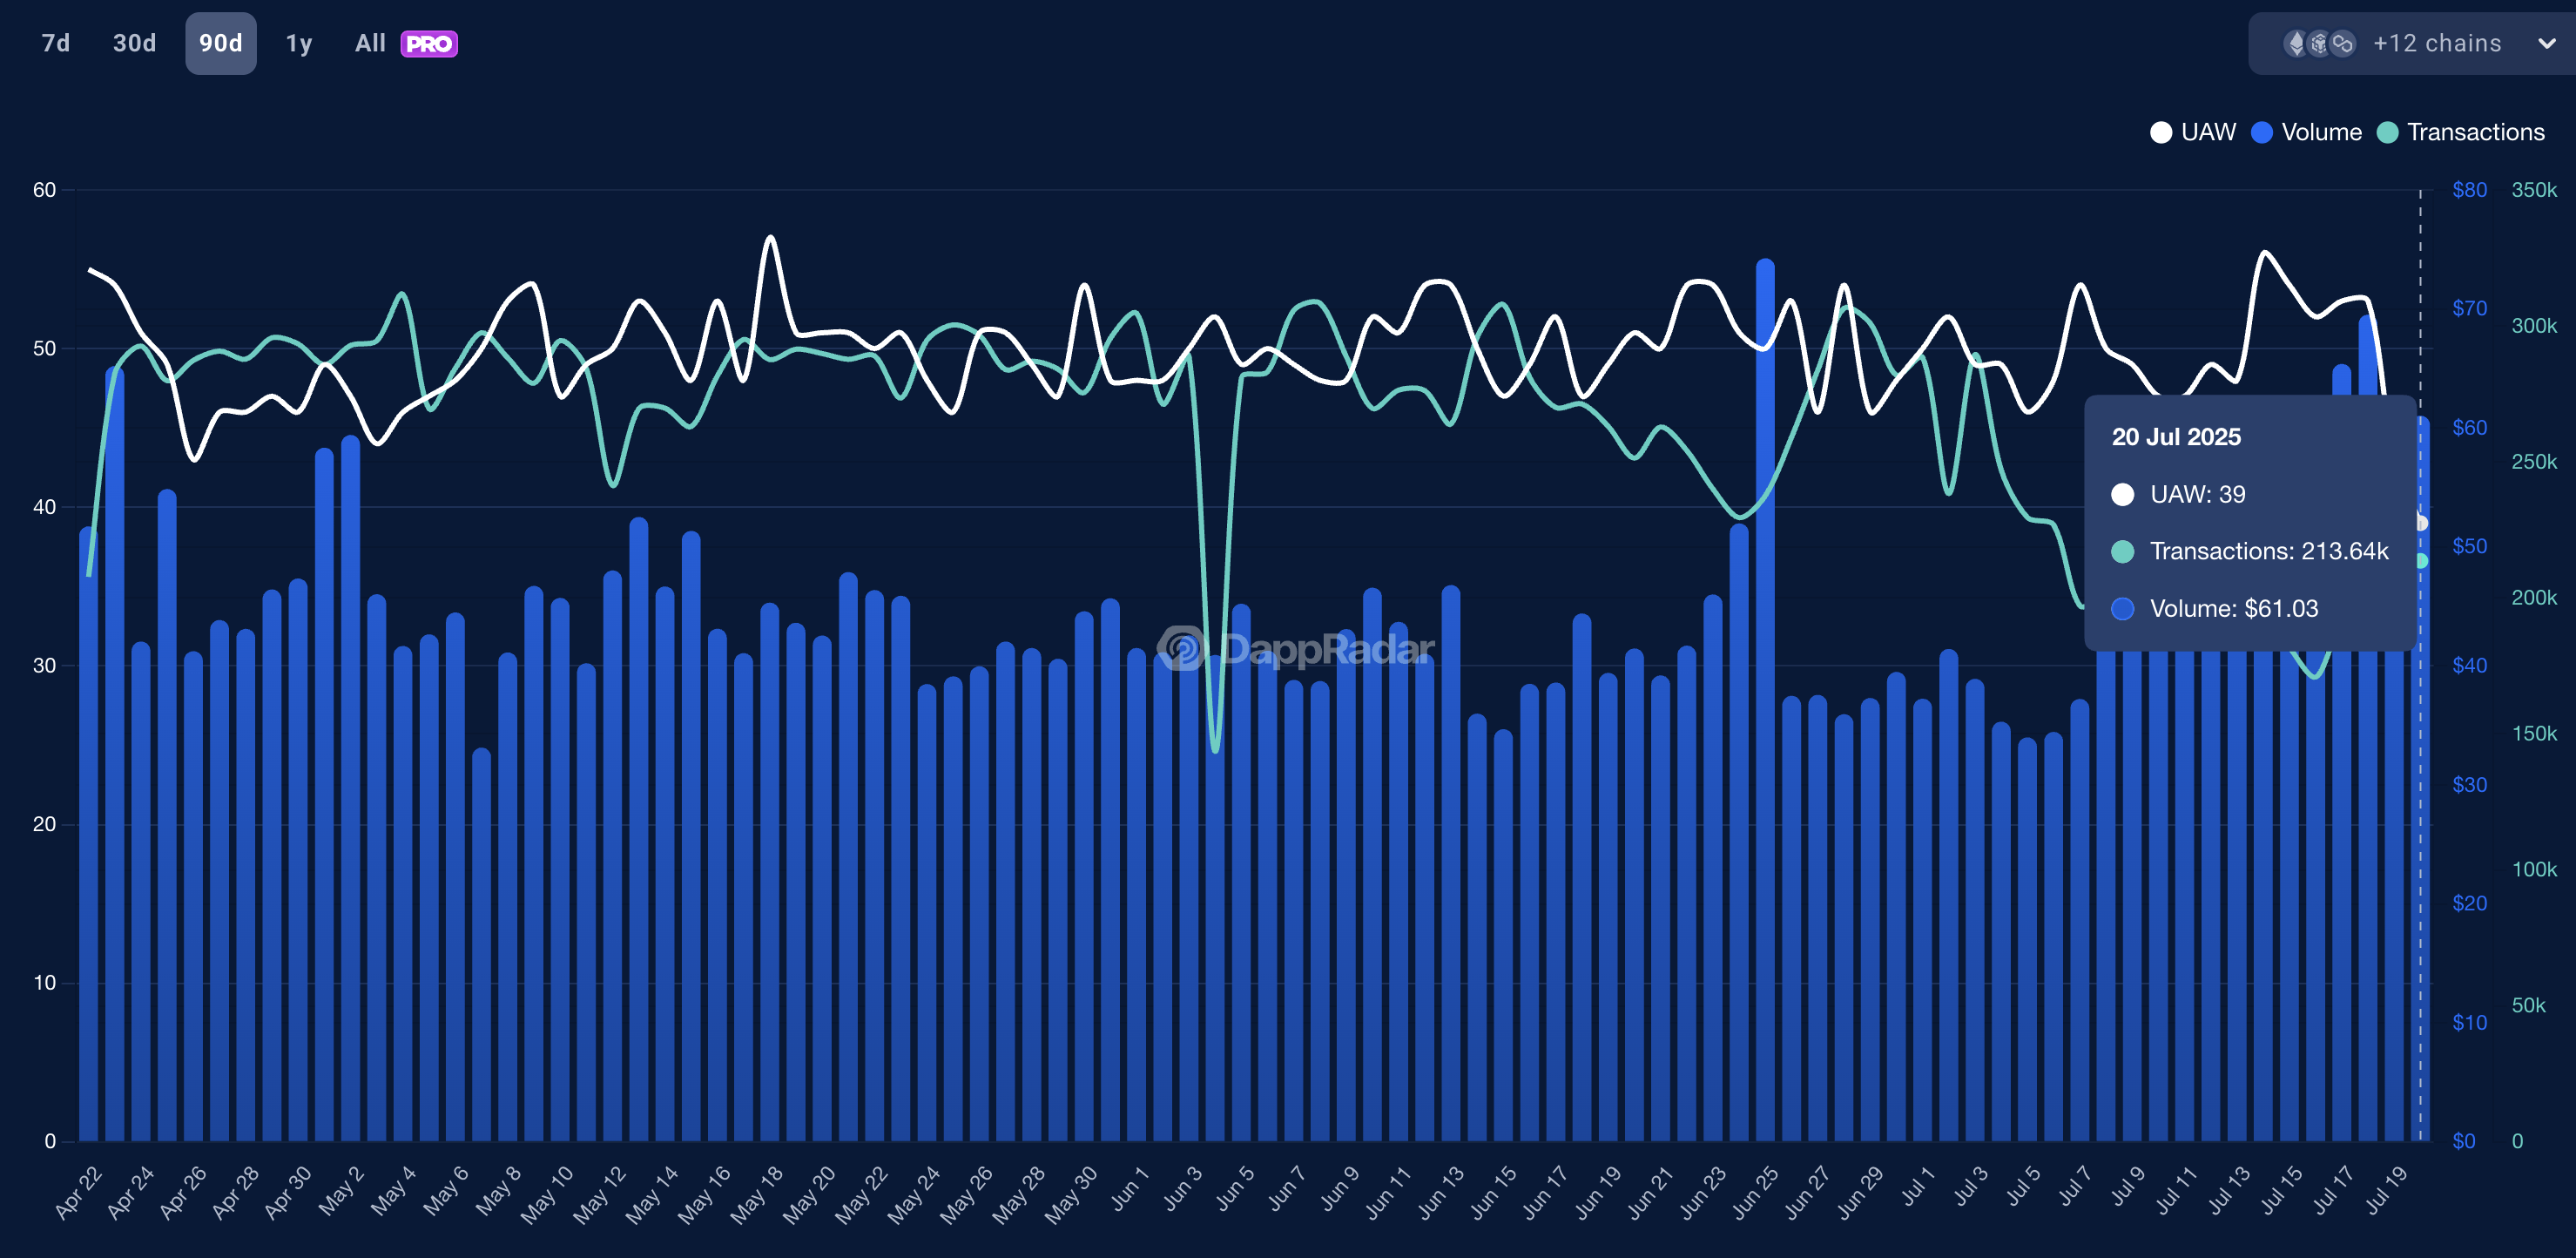
Pyth network on-chain activity. Source: DappRadar
Rising optimism sparks a surge in PYTH Open Interest
CoinGlass’ data shows the PYTH Open Interest (OI) reaching $54.79 million, up from $50.54 million on Sunday. An increase in OI translates to heightened capital inflow in the derivative market with increased traders’ interest.
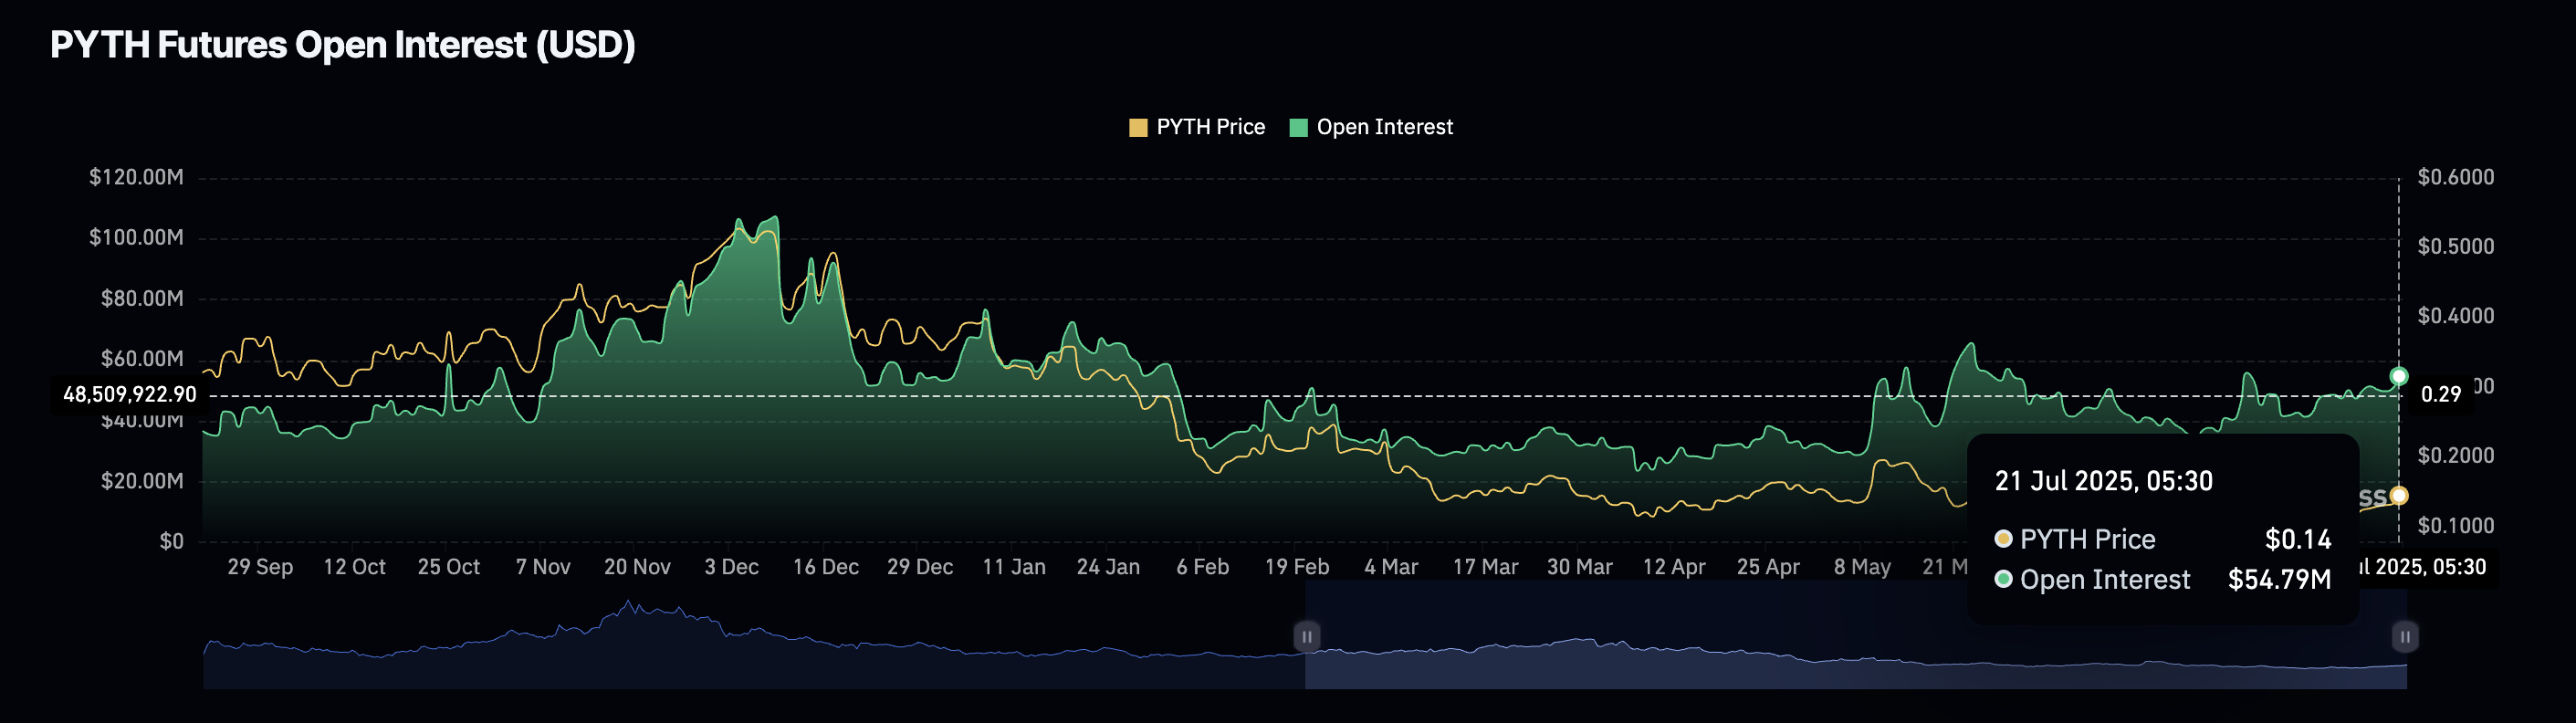
PYTH Open Interest. Source: Coinglass
PYTH’s recovery run targets double-digit gains to $0.1684
Pyth Network edges higher for the seventh successive day by nearly 2% so far on Monday, adding on the 9.87% rise from Sunday. The bull run exceeded the 100-day Exponential Moving Average (EMA) at $0.1330 and the eight-month long resistance trendline (formed by connecting the December 3 and May 14 highs) at $0.1371.
However, the uptrend struggles to surpass the $0.1489 resistance marked by the May 22 peak. A decisive close above this level could extend the trendline breakout rally to the 38.2% Fibonacci level at $0.1684, drawn from the $0.5533 peak of December 3 to the $0.0807 low of June 22.
Still, the Money Flow Index (MFI) on the daily chart rises higher, entering the overbought zone, and reaches 89. Investors must remain cautious as overbought conditions risk correction or consolidation. Typically, MFI values above 90 indicate extreme buying pressure, which is rarely sustainable and often foreshadows a trend reversal.
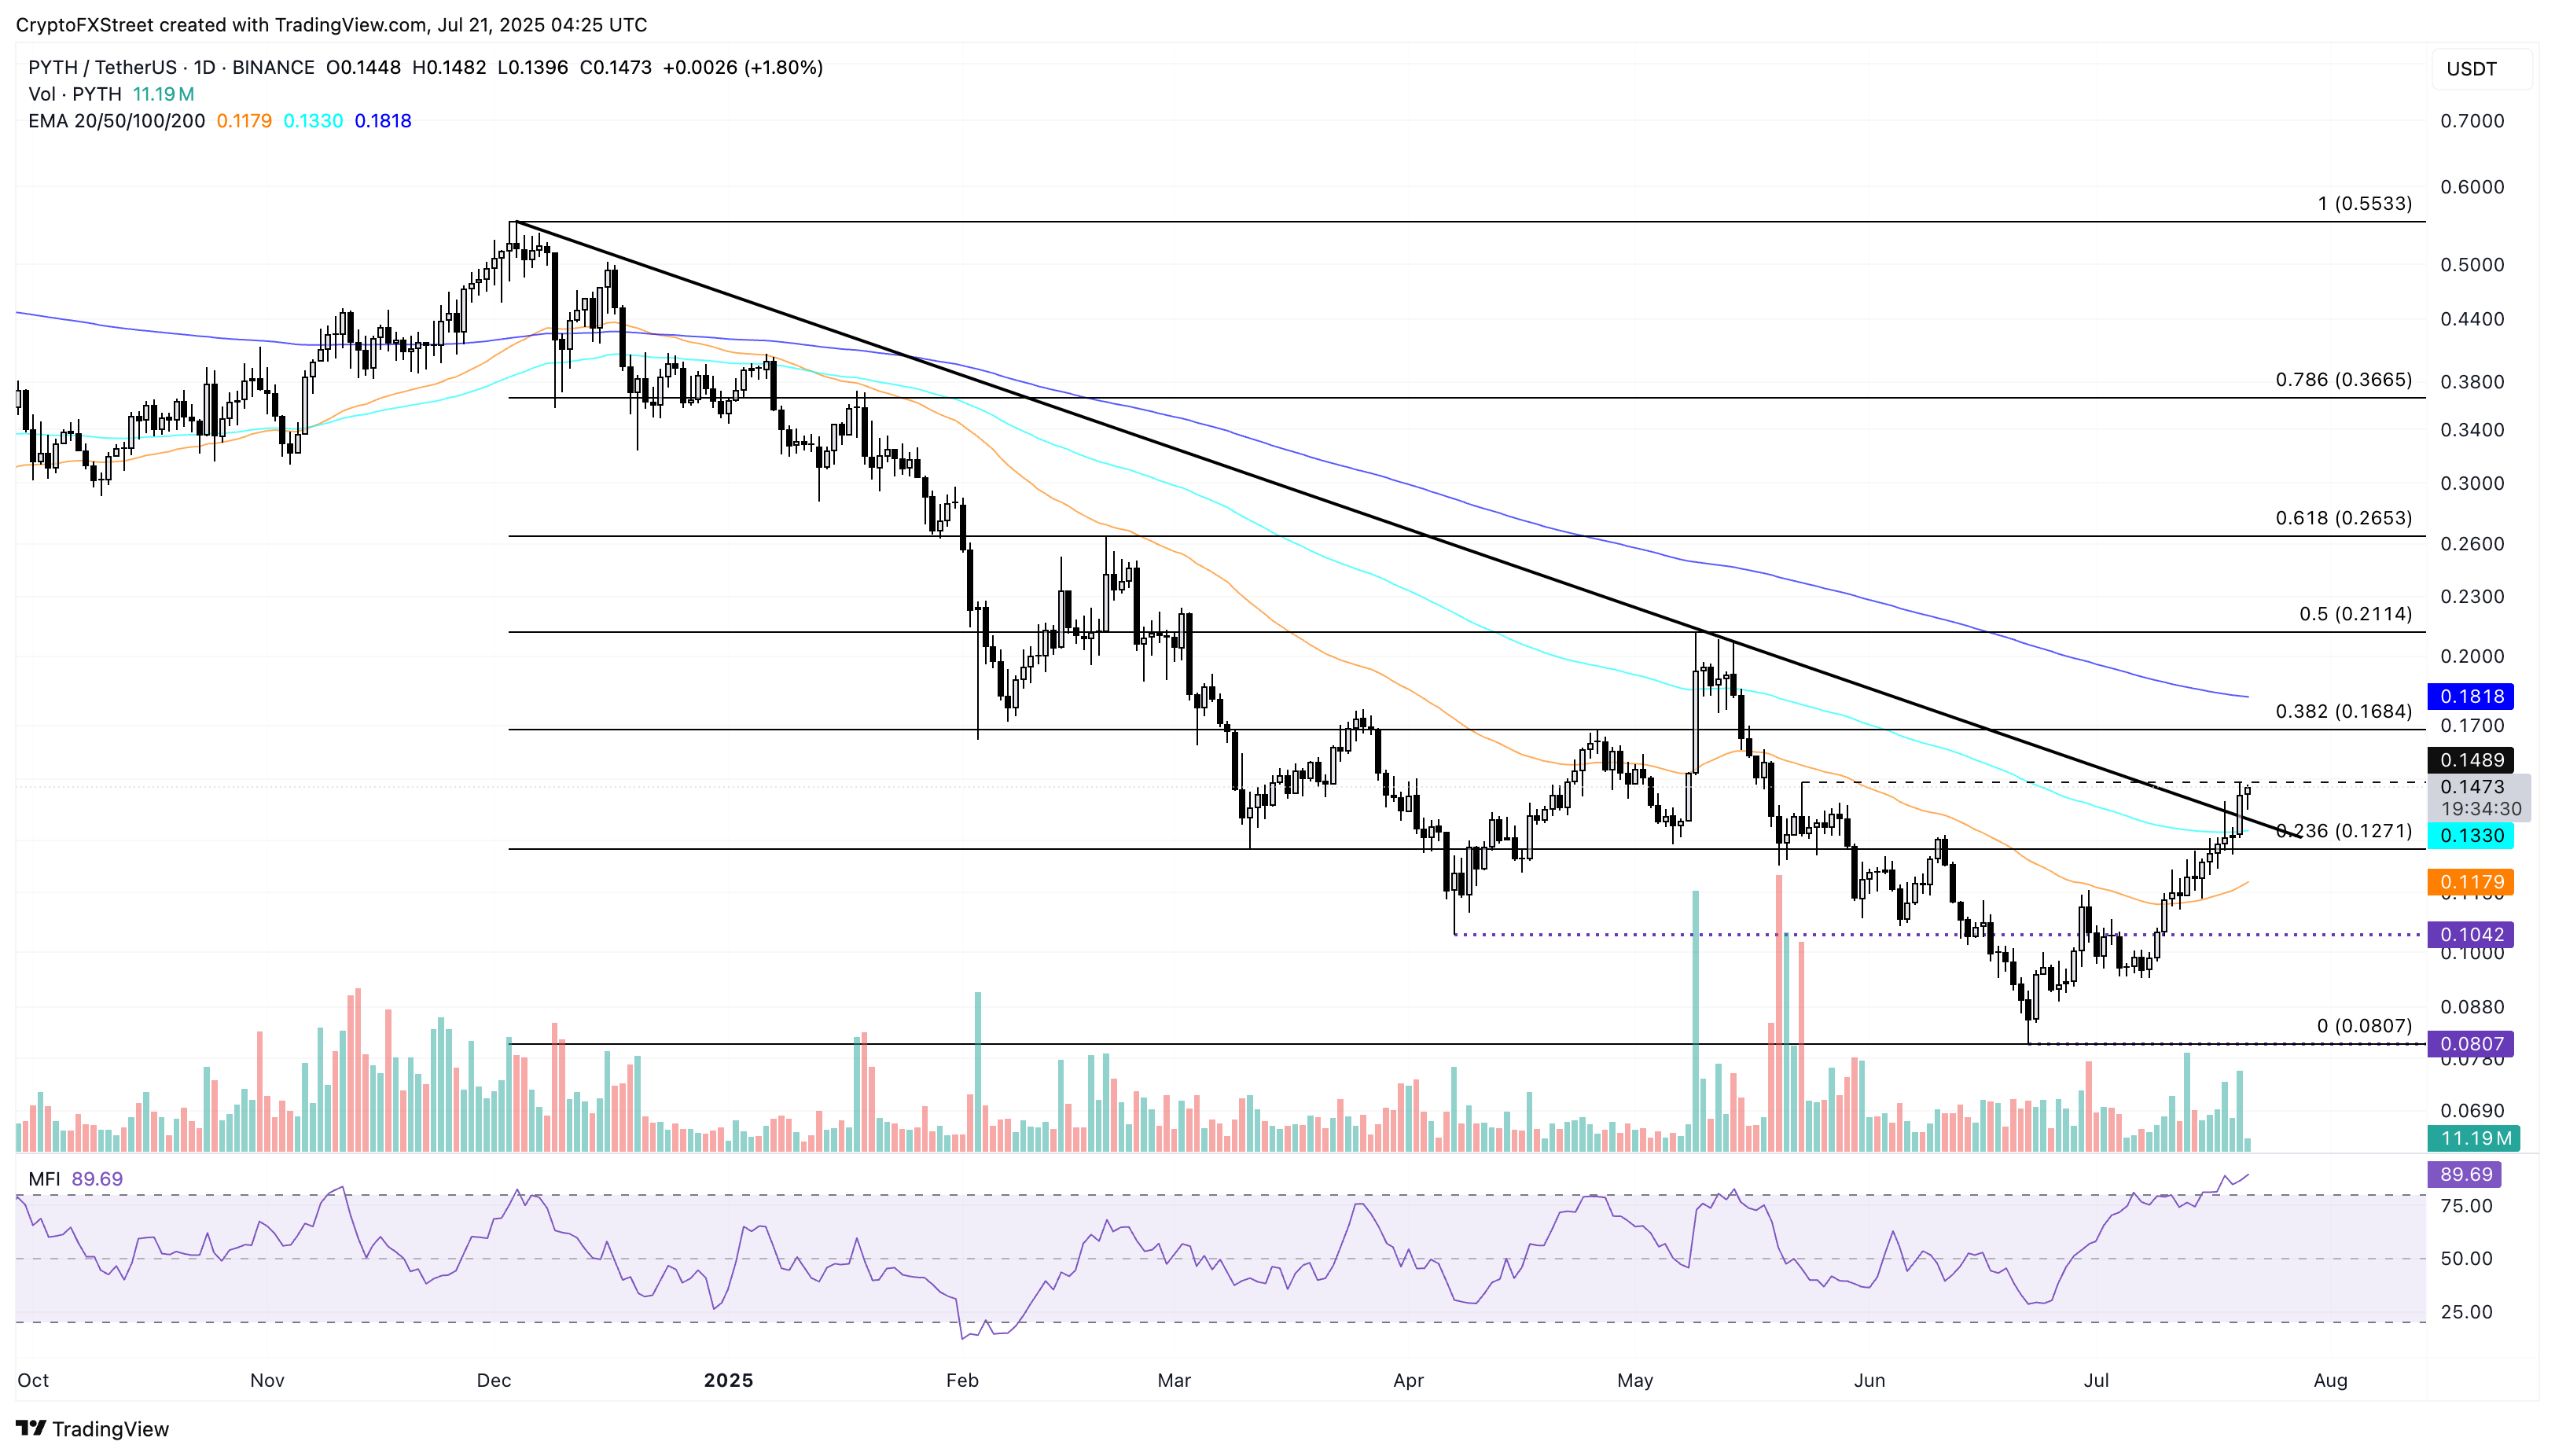
PYTH/USDT daily price chart.
On the downside, a reversal to the 100-day EMA at 0.1330 could act as a retest of the broken trendline. However, if PYTH retests the 23.6% Fibonacci level at $0.1271, the trendline breakout would be invalidated. A clean push below this level could extend the declining trend to the 50-day EMA at $0.1179.
Artigos Recomendados


