

Pi Network Price Forecast: PI remains under pressure near record lows as bears dominate

Fonte Fxstreet
  • Pi Network remains under pressure on Monday after setting a fresh all-time low near $0.0600 on Saturday.
  • Derivatives positioning points to persistent bearish sentiment among PI traders.
  • The technical outlook remains bearish, with PI hovering near record-low territory as sellers retain control.

Pi Network (PI) extends its decline on Monday, approaching the all-time low (ATL) of $0.0600 recorded over the weekend. Bearish sentiment in the derivatives market adds to selling pressure, and a deteriorating technical outlook suggests that downside risks remain elevated, leaving PI vulnerable to fresh lows if sellers maintain control.

Derivatives metrics suggest deeper correction

Derivatives positioning points to persistent bearish sentiment for Pi Network. The Blockworks chart below shows that PI's Open Interest (OI)-weighted funding rate turned negative, dropping to -0.00014% on Monday, indicating that shorts are paying longs and dominating perpetual futures positioning. 
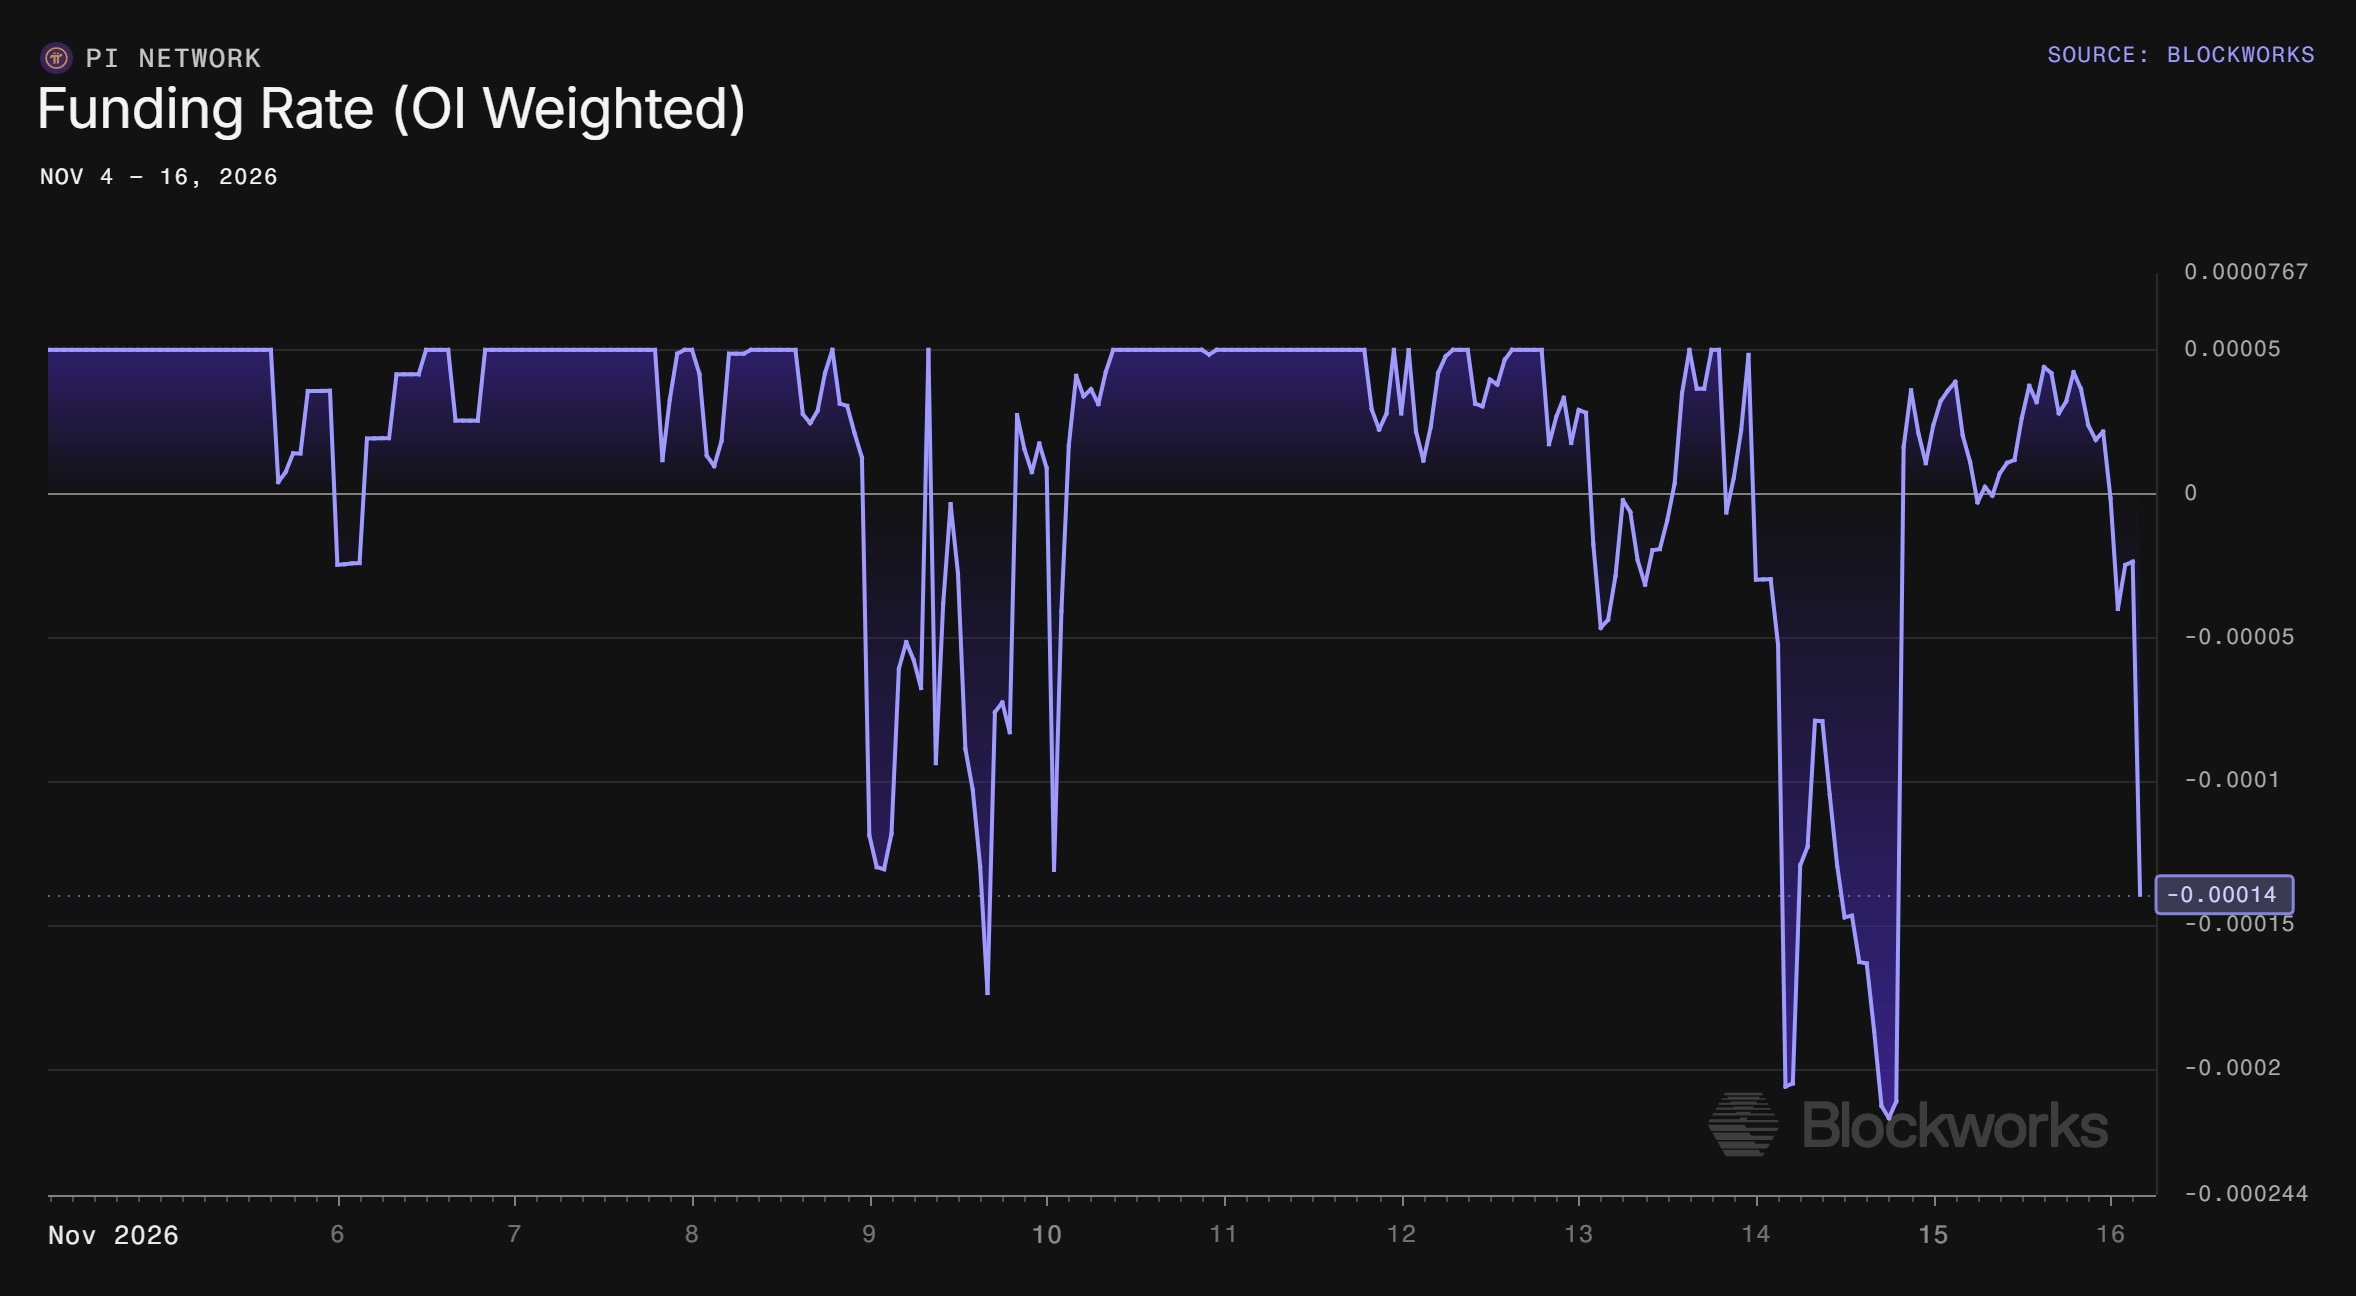
Pi Network funding rates chart. Source: Blockworks

In addition, the 30-day Sharpe ratio has fallen to -4.462 on Monday, highlighting deteriorating risk-adjusted returns as Pi Network's recent decline continues to weigh on market performance. Moreover, the metric has remained below zero since October, suggesting that investors continue to face negative returns relative to the volatility they are exposed to.

Together, both the OI-weighted funding rate and the 30-day Sharpe ratio suggest that bearish sentiment remains dominant among PI traders.
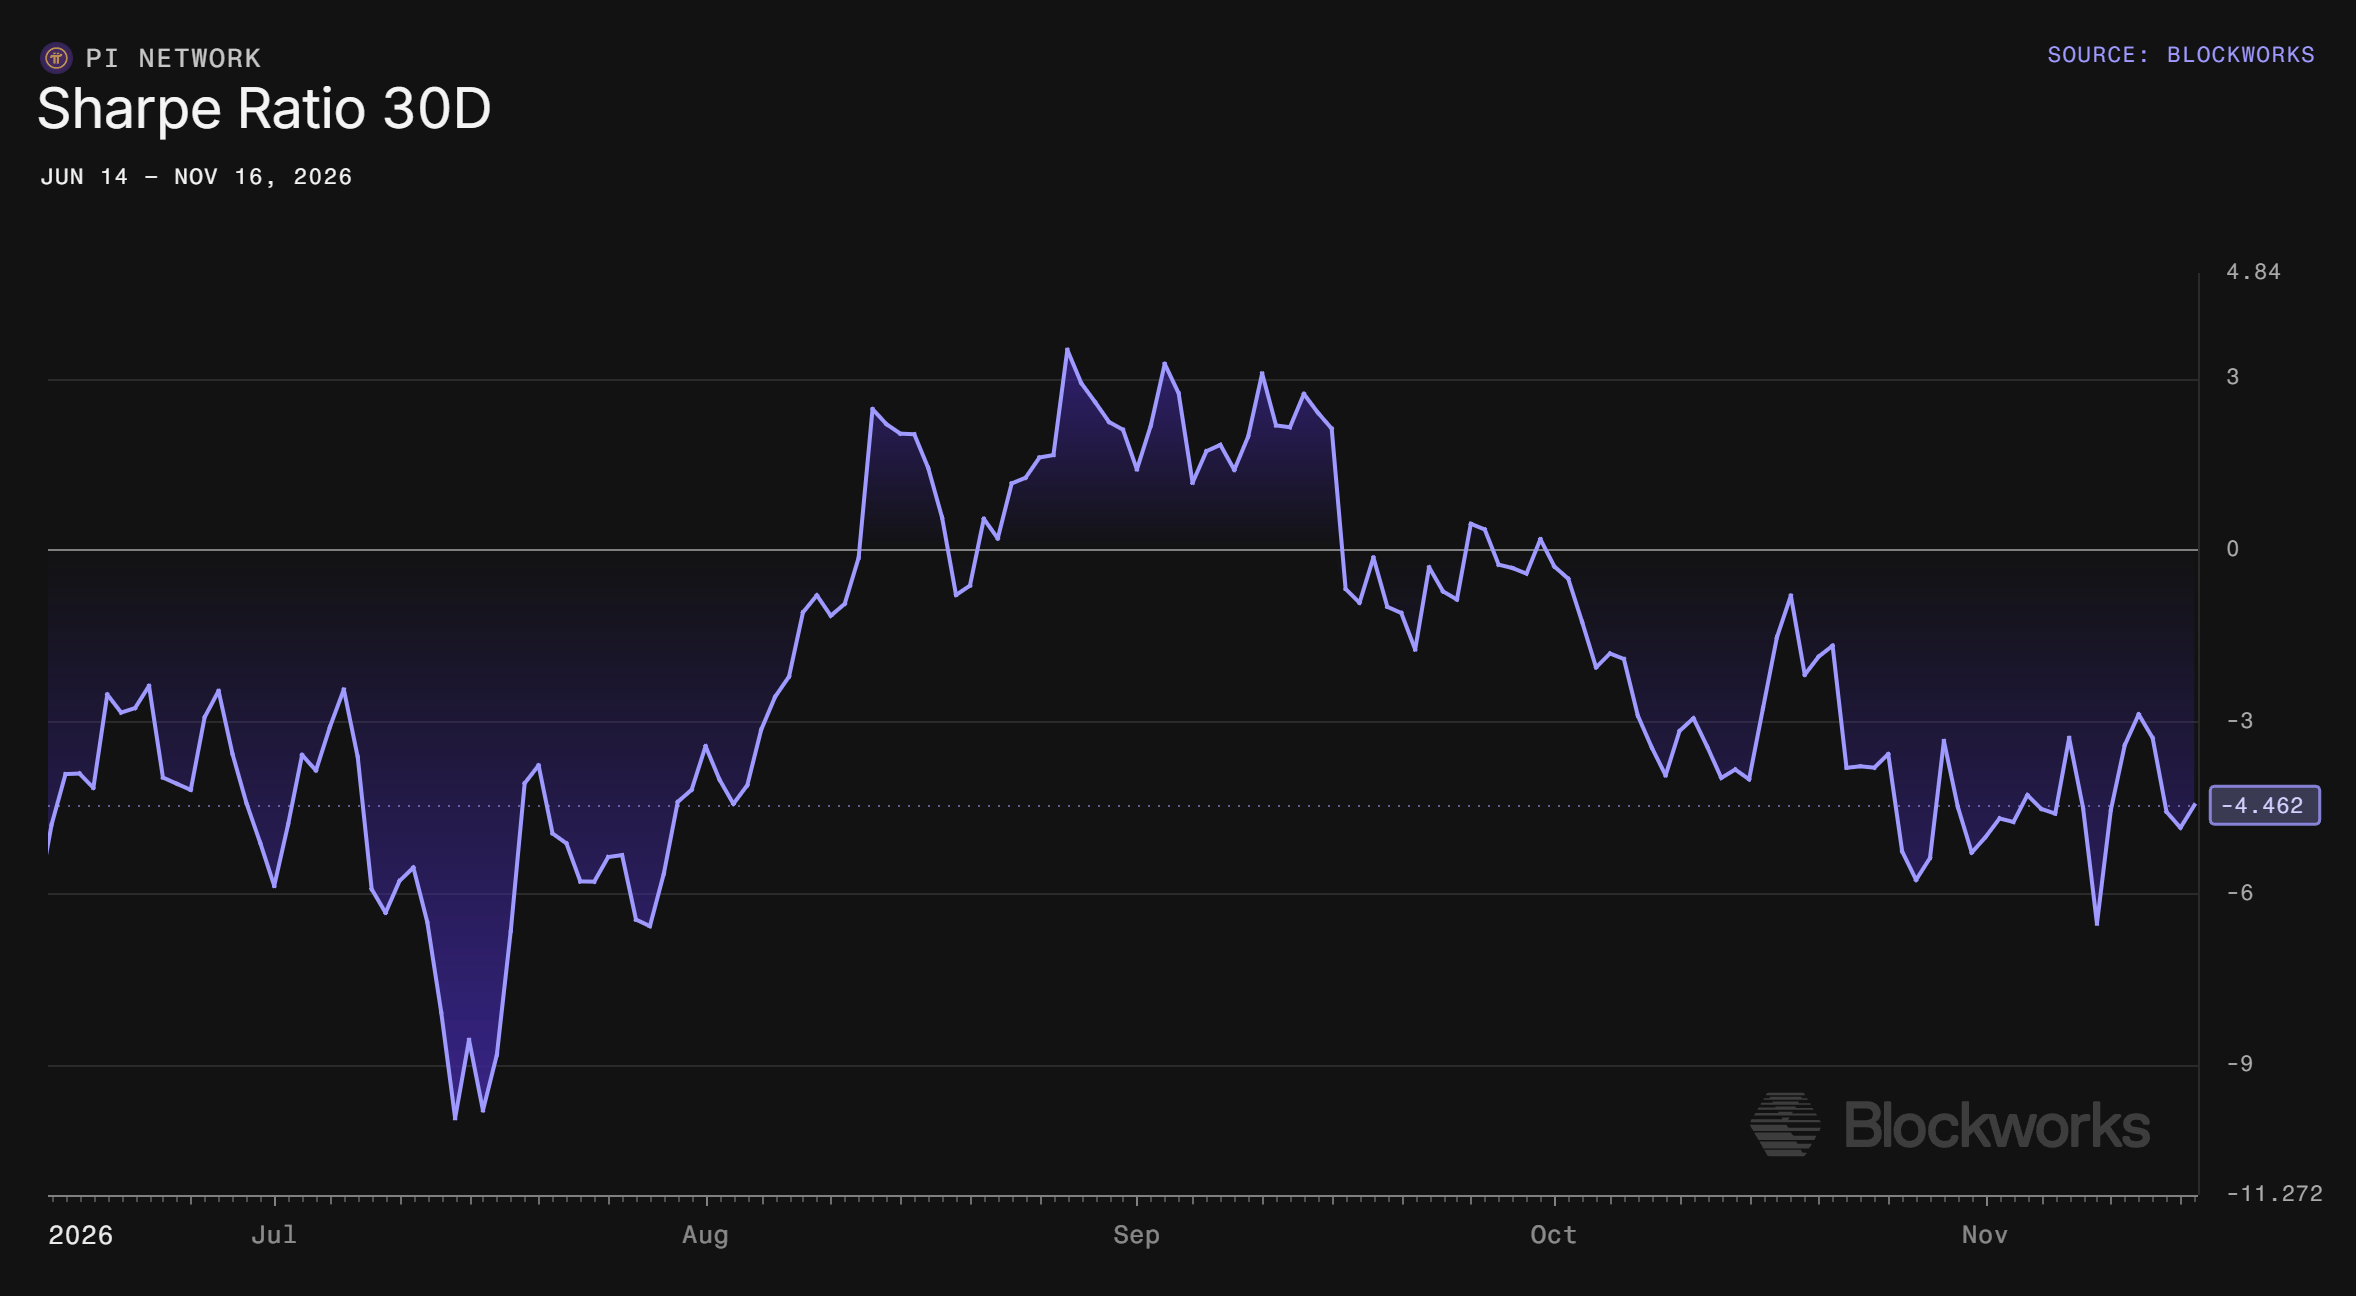
Pi Network 30-day Sharpe ratio chart. Source: Blockworks

Pi Network Price Forecast: Is PI heading to set a new record low?

Pi Network price trades at $0.062 at the time of writing on Monday, after setting a fresh all-time low near $0.0600 on Saturday. In addition, PI is extending its slide well below the main Exponential Moving Averages (EMAs) and keeping the near-term bias firmly bearish. 

The 50-day EMA at $0.077, the 100-day EMA at $0.085 and the 200-day EMA at $0.112 all sit overhead and collectively suggest a capped market while price remains beneath them.

Momentum reinforces this weak tone on the daily chart, with the Relative Strength Index (RSI) hovering in oversold territory near 28 and the Moving Average Convergence Divergence (MACD) with a negative histogram, hinting at persistent downside pressure despite the stretched conditions.

On the topside, initial resistance appears near the downward trendline at $0.073, followed by a horizontal barrier at $0.074, forming a first supply cluster just above current levels. A stronger recovery would face further resistance at the 50-day EMA at $0.077 and then the 100-day EMA at $0.085, ahead of the more distant horizontal cap at $0.098 and the 200-day EMA at $0.112. 

With no clear structural support levels defined below $0.061, the pair remains vulnerable to further declines until buyers can reclaim the nearer resistance band and start building a base.
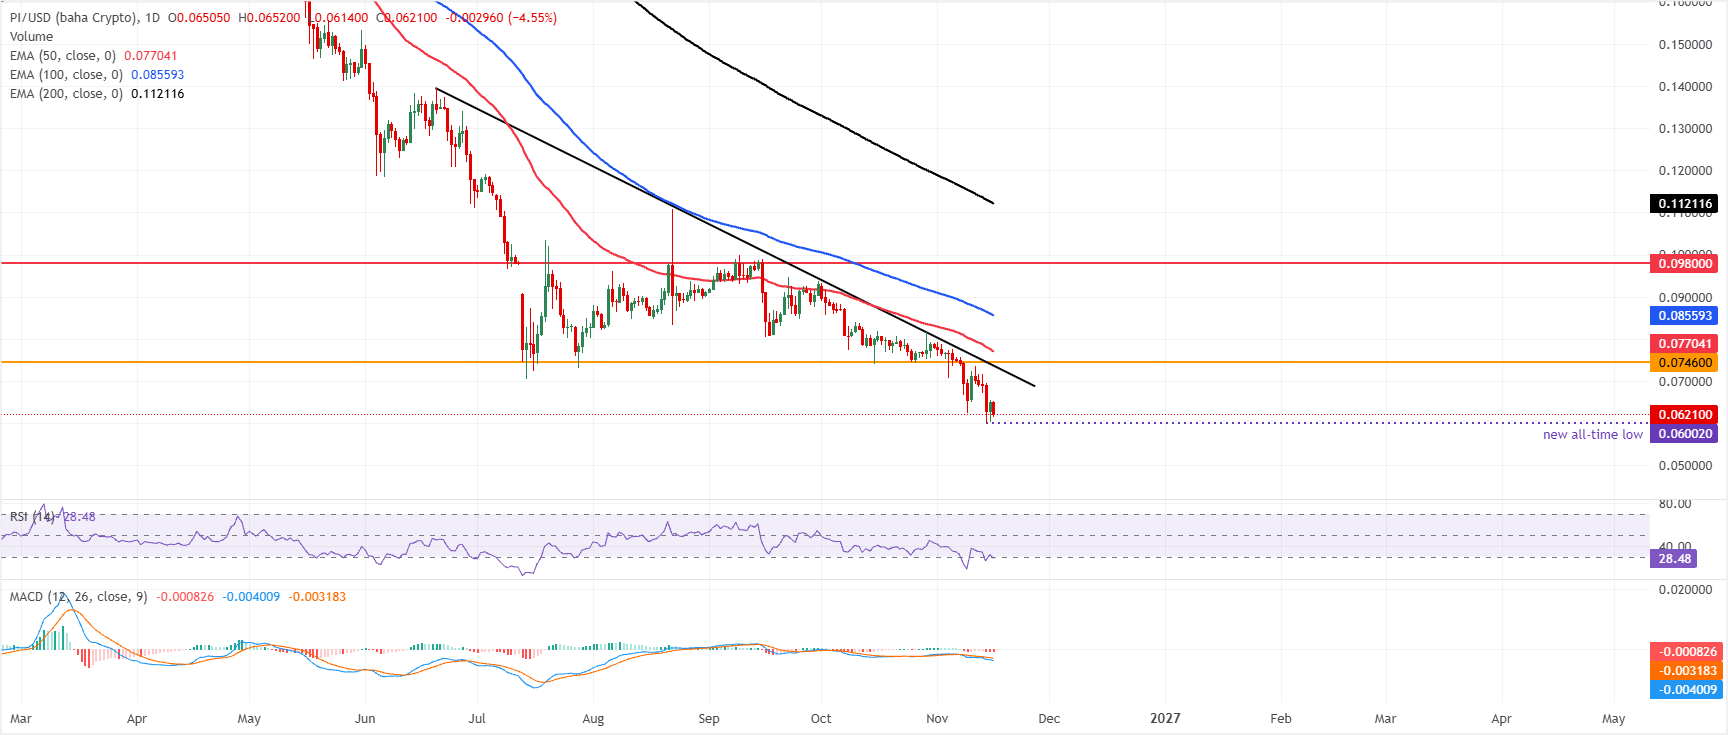
PI/USD daily chart

(The technical analysis of this story was written with the help of an AI tool. Know more.)

Isenção de responsabilidade: Apenas para fins informativos. O desempenho passado não é indicativo de resultados futuros.
placeholder
Rendimentos do Tesouro perto de máximo de 24 anos com Pimco alertando sobre 6%O rendimento da dívida do Tesouro dos EUA a 10 anos manteve-se perto de 5,29% na sexta-feira, logo abaixo do seu pico recente de 5,34%. Este foi o nível mais elevado desde abril de 2002, quando atingiu 5,36% em 2 de abril, segundo dados do Federal Reserve. Dan Ivascyn, diretor de investimentos da Pimco, afirma que 6% é uma possibilidade, o que levanta temores sobre taxas de empréstimo elevadas e ações...
Autor  Cryptopolitan
10 Mês 10 Dia Sab
O rendimento da dívida do Tesouro dos EUA a 10 anos manteve-se perto de 5,29% na sexta-feira, logo abaixo do seu pico recente de 5,34%. Este foi o nível mais elevado desde abril de 2002, quando atingiu 5,36% em 2 de abril, segundo dados do Federal Reserve. Dan Ivascyn, diretor de investimentos da Pimco, afirma que 6% é uma possibilidade, o que levanta temores sobre taxas de empréstimo elevadas e ações...
placeholder
Nikkei salta 2%, Kospi sustenta 5,000 em meio à volatilidade enquanto Samsung e SK Hynix fecham em altaTradingKey - Ações japonesas e sul-coreanas oscilaram na busca pela formação de um fundo; o Nikkei registrou forte recuperação de 2,33%, enquanto as ações sul-coreanas recuaram para 5.018 pontos à esp
Autor  TradingKey
11 Mês 09 Dia Seg
TradingKey - Ações japonesas e sul-coreanas oscilaram na busca pela formação de um fundo; o Nikkei registrou forte recuperação de 2,33%, enquanto as ações sul-coreanas recuaram para 5.018 pontos à esp
placeholder
Kospi salta 4%, SoftBank dispara 14%, Kioxia avança 9%, SK Hynix sobe 7%TradingKey - KOSPI aciona sidecar em disparada de 4,39%, Nikkei retoma marca de 60.000 pontos e SoftBank salta quase 14%.Durante a sessão asiática de 10 de novembro, as bolsas do Japão e da Coreia do
Autor  TradingKey
11 Mês 10 Dia Ter
TradingKey - KOSPI aciona sidecar em disparada de 4,39%, Nikkei retoma marca de 60.000 pontos e SoftBank salta quase 14%.Durante a sessão asiática de 10 de novembro, as bolsas do Japão e da Coreia do
placeholder
Kospi apaga ganhos e cai abaixo de 5,300 enquanto SK Hynix cai 3%, SoftBank despenca 5%TradingKey - As ações do Japão e da Coreia do Sul divergiram à tarde, com o KOSPI virando para o campo negativo e fechando em baixa de 0,98%, enquanto o Nikkei subiu 0,53% e reconquistou a marca dos 6
Autor  TradingKey
11 Mês 13 Dia Sex
TradingKey - As ações do Japão e da Coreia do Sul divergiram à tarde, com o KOSPI virando para o campo negativo e fechando em baixa de 0,98%, enquanto o Nikkei subiu 0,53% e reconquistou a marca dos 6
placeholder
Ouro segue perto da mínima no ano com Fed e Oriente Médio apoiando o dólarO ouro (XAU/USD) avança levemente no início de uma nova semana, embora enfrente dificuldades para capitalizar essa alta e fracasse perto da marca de US$ 3.900 durante a sessão asiática.
Autor  FXStreet
3 horas atrás
O ouro (XAU/USD) avança levemente no início de uma nova semana, embora enfrente dificuldades para capitalizar essa alta e fracasse perto da marca de US$ 3.900 durante a sessão asiática.
goTop
quote