


Top 3 Price Predictions: Bitcoin, Ethereum, Ripple – BTC, ETH, XRP remain locked in a bearish trend despite oversold signals
- Bitcoin trades at $64,651 on Monday, suggesting bearish momentum remains dominant despite oversold signals.
- Ethereum trades below $1,823 after shedding more than 13% last week, with sellers maintaining control.
- XRP trades around $0.959 after correcting over 12% and reaching a new yearly low of $0.893 last week.
Bitcoin (BTC), Ethereum (ETH), and Ripple (XRP) remain under pressure after losses of over 12%, 13%, and 12%, respectively, last week. The top three cryptocurrencies struggle to find a floor, with BTC trading below $65,000, while ETH and XRP extend their declines on Monday. Despite momentum indicators showing oversold conditions hinting at a potential relief bounce, bearish momentum continues to dominate price action, leaving BTC, ETH and XRP vulnerable to further downside.
Bitcoin remains under pressure as bears dominate
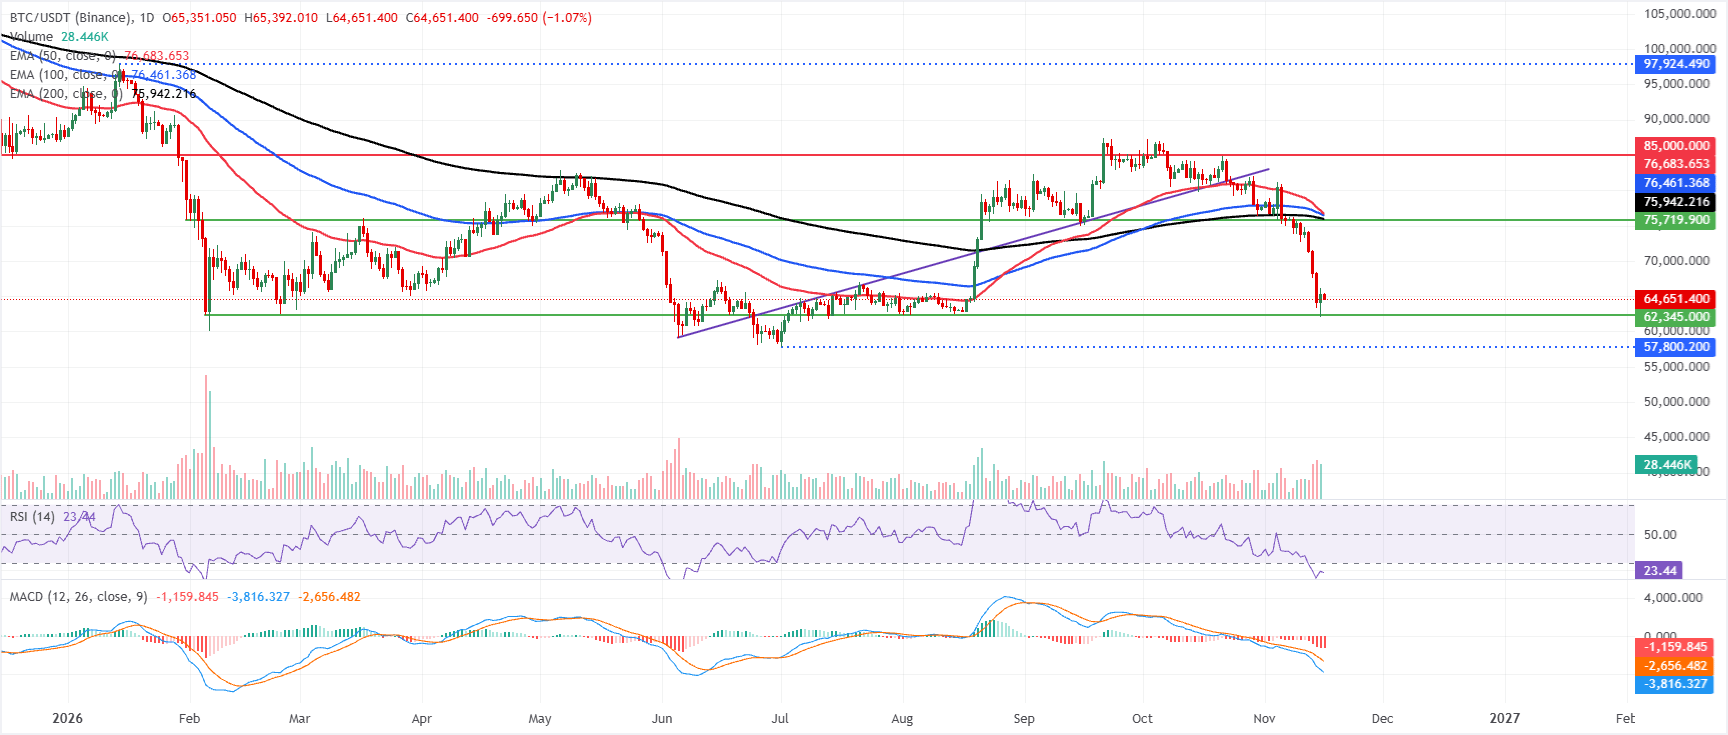
Bitcoin price trades at $64,651 on Monday, extending its slide well below the key Exponential Moving Averages (EMAs) and maintaining a clear bearish near-term bias. The 50-day EMA at $76,683, the 100-day EMA at $76,461 and the 200-day EMA at $75,942 all sit overhead, hinting at a heavy topside cap while price consolidates near recent lows.
The Relative Strength Index (RSI) has slipped into oversold territory around 23, which suggests downside pressure is stretched but not yet showing a decisive rebound, and the Moving Average Convergence Divergence (MACD) remains deeply negative, reinforcing persistent bearish momentum.
On the topside, initial resistance sits at the 200-day EMA near $75,942, followed by the 100-day EMA at $76,461 and the 50-day EMA at $76,683, where any recovery could struggle if bulls attempt a corrective bounce. A more distant barrier emerges at the horizontal line around $85,000, which marks a major ceiling for any medium-term recovery attempts. With momentum indicators still depressed, only a sustained daily close back above this EMA cluster would begin to weaken the bearish structure.
Ethereum oversold signals fail to stop the sell-off
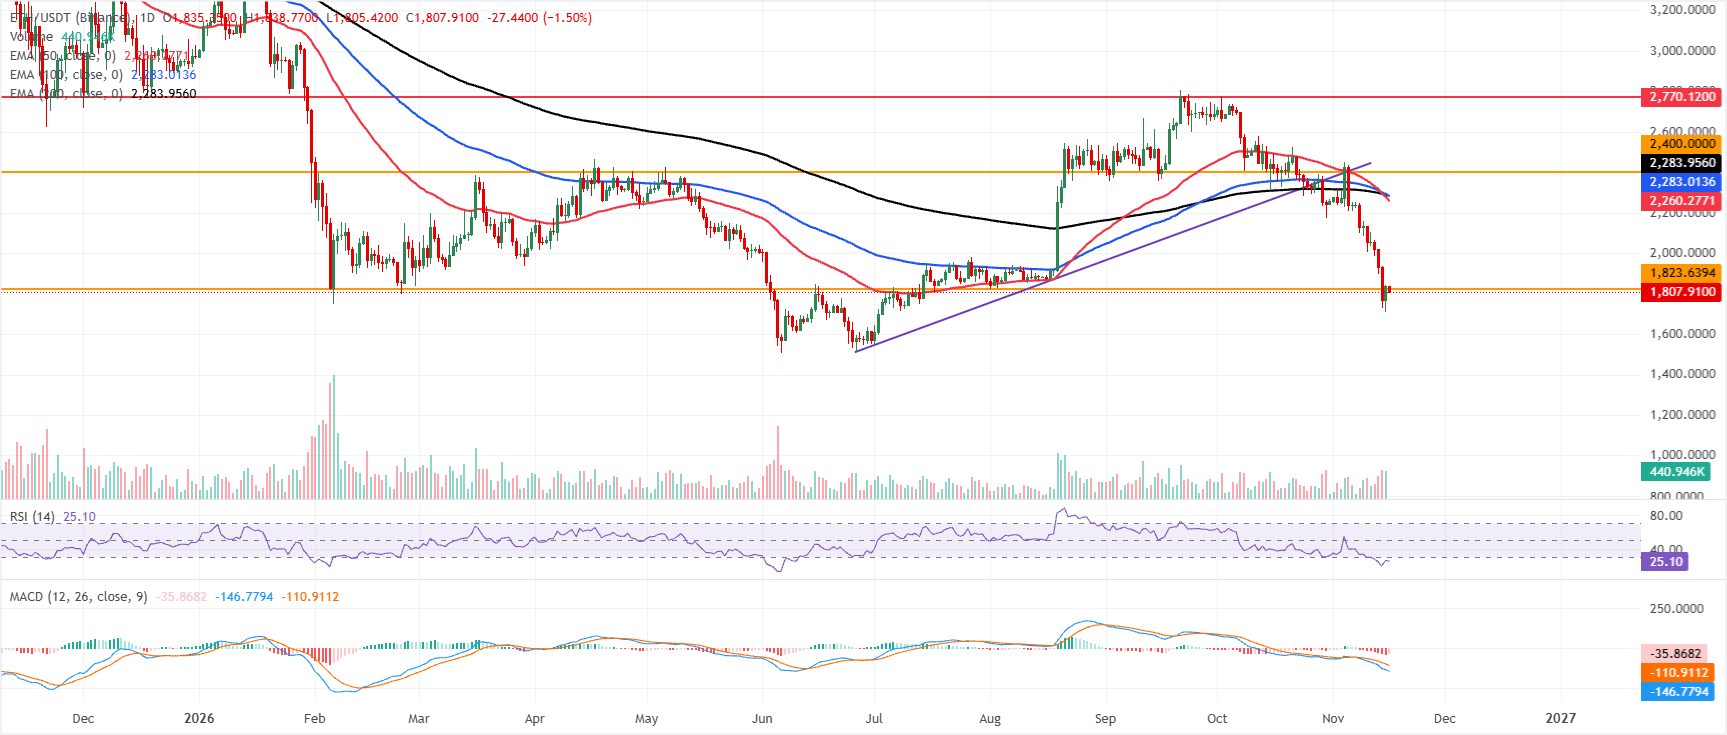
Ethereum price trades at $1,807 on Monday, extending its slide well below the main EMAs and reinforcing a bearish near-term bias. ETH sits below the 50-day EMA at $2,260, the 100-day EMA at $2,283, and the 200-day EMA at $2,283, underscoring a broad downside structure.
The RSI at 25 hovers in oversold territory, suggesting the sell-off could be stretched but not yet reversed. At the same time, the MACD remains deeply negative, hinting that bearish momentum is still dominant despite the oversold signals.
On the topside, immediate resistance is seen at the horizontal level near $1,823, which caps any initial recovery attempts. Above this, the 50-day EMA at $2,260 is followed by the clustered 100-day and 200-day EMAs around $2,283, forming a dense barrier that would need to be reclaimed to ease the bearish pressure. Further up, a psychological hurdle emerges at $2,400, ahead of the broken rising trendline area around $2,479 and a more distant resistance level at $2,770. With no nearby support levels defined below the current price in this dataset, the pair appears vulnerable to further downside until buyers manage to push it back through the initial resistance at $1,823.
XRP drops to a new yearly low
XRP trades at $0.959 on Monday, maintaining a firmly bearish near-term tone as it remains decisively below the 50-day, 100-day, and 200-day EMAs clustered between $1.228 and $1.329. Moreover, XRP dropped to $0.893 on Saturday, setting a new yearly low.
The RSI at 26 sits in oversold territory, while the MACD stays negative, reinforcing persistent downside pressure despite the potential for short-lived corrective bounces.
On the topside, initial resistance is seen at the psychological $1.000 level, followed by $1.160 ahead of the 50-day EMA at $1.228 and the 100-day EMA at $1.267. Above there, $1.300 and the 200-day EMA at $1.329 form a broader cap before higher resistance at $1.540 and $1.900, where previous supply is likely to reassert itself if any rebound extends.
XRP/USDT daily chart
(The technical analysis of this story was written with the help of an AI tool. Know more.)
Artigos Recomendados


