

Top Altcoins Price Forecast: Ripple and Solana under pressure as Hyperliquid recovers

Fonte Fxstreet
  • Ripple is down over 2% on Thursday, extending losses below $1.30 and capped below crucial moving averages.
  • Solana drops 2% so far, testing its 200-day EMA and the $100 psychological level amid mounting selling pressure.
  • Hyperliquid is up 7%, reclaiming its 50-day EMA at $81.21, suggesting renewed bullish momentum.

Institutional demand shakes

Institutional demand for altcoins is weak in the near term. Solana-focused ETFs record $5.66 million in outflows on Wednesday, after over $19 million and $8 million in outflows earlier this week, bringing the total to $33.04 million. A negative close to this week would mark its fourth consecutive weekly outflow, suggesting intense selling pressure from institutional investors.

Meanwhile, XRP and HYPE are facing institutional silence, with zero inflows on Wednesday, with weekly outflows of $3.61 million and $4.30 million, respectively.
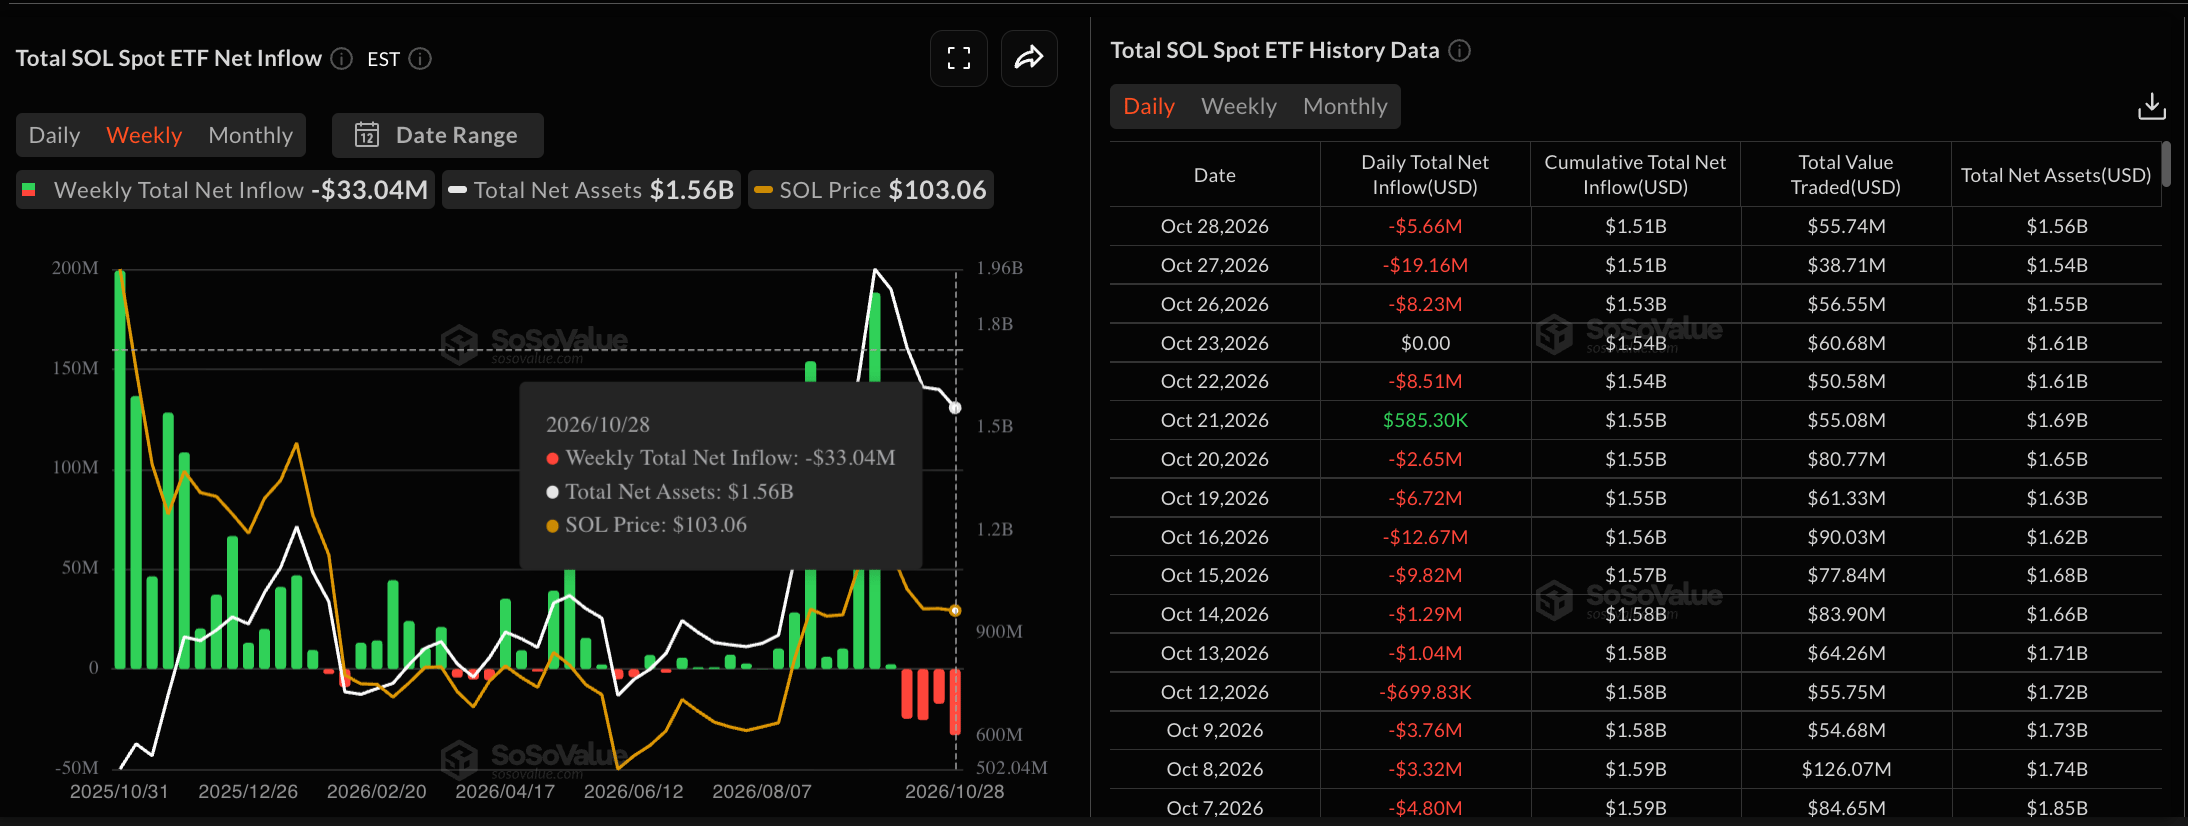

SOL ETFs data. Source: Sosovalue
XRP and HYPE ETFs data. Source: SoSoValue

Ripple risks breaking the key support floor

Ripple trades at $1.2924 at press time on Thursday, keeping a bearish near-term tone. XRP sits well below the 50-day and 200-day Exponential Moving Averages (EMAs) at $1.3574 and $1.3891, respectively.

The price has also retreated beneath the downward trendline barrier at $1.3216, suggesting that recent attempts to reclaim the resistance have failed.

Momentum is weak rather than washed out, with the Relative Strength Index (RSI) hovering near 40 on the daily chart, while the Moving Average Convergence Divergence (MACD) is flat in negative territory, hinting that any recovery could remain constrained.

A confirmed breakout below the $1.2588 level, set by the August 21 low, could extend the decline toward the August 2 high around $1.0933.

Chart Analysis XRP/USDT (Binance)
XRP/USDT daily price chart.

On the topside, initial resistance appears at the trendline break zone around $1.3216, followed by the 50-day EMA at $1.3574 and the denser structural cap provided by the 200-day EMA at $1.3891.

Solana tests the 200-day EMA support

Solana hovers around $100 on Thursday, keeping a bearish near-term bias. The SOL price remains below the 50-day EMA at $105 while holding above the longer-term 200-day EMA at $98.36.

The RSI around 35 hovers just above oversold territory, and the MACD stays negative, together suggesting waning but still dominant downside momentum.

A sustained close below the 200-day EMA at $98.36 could result in another test of the rising support trendline near $87.26.
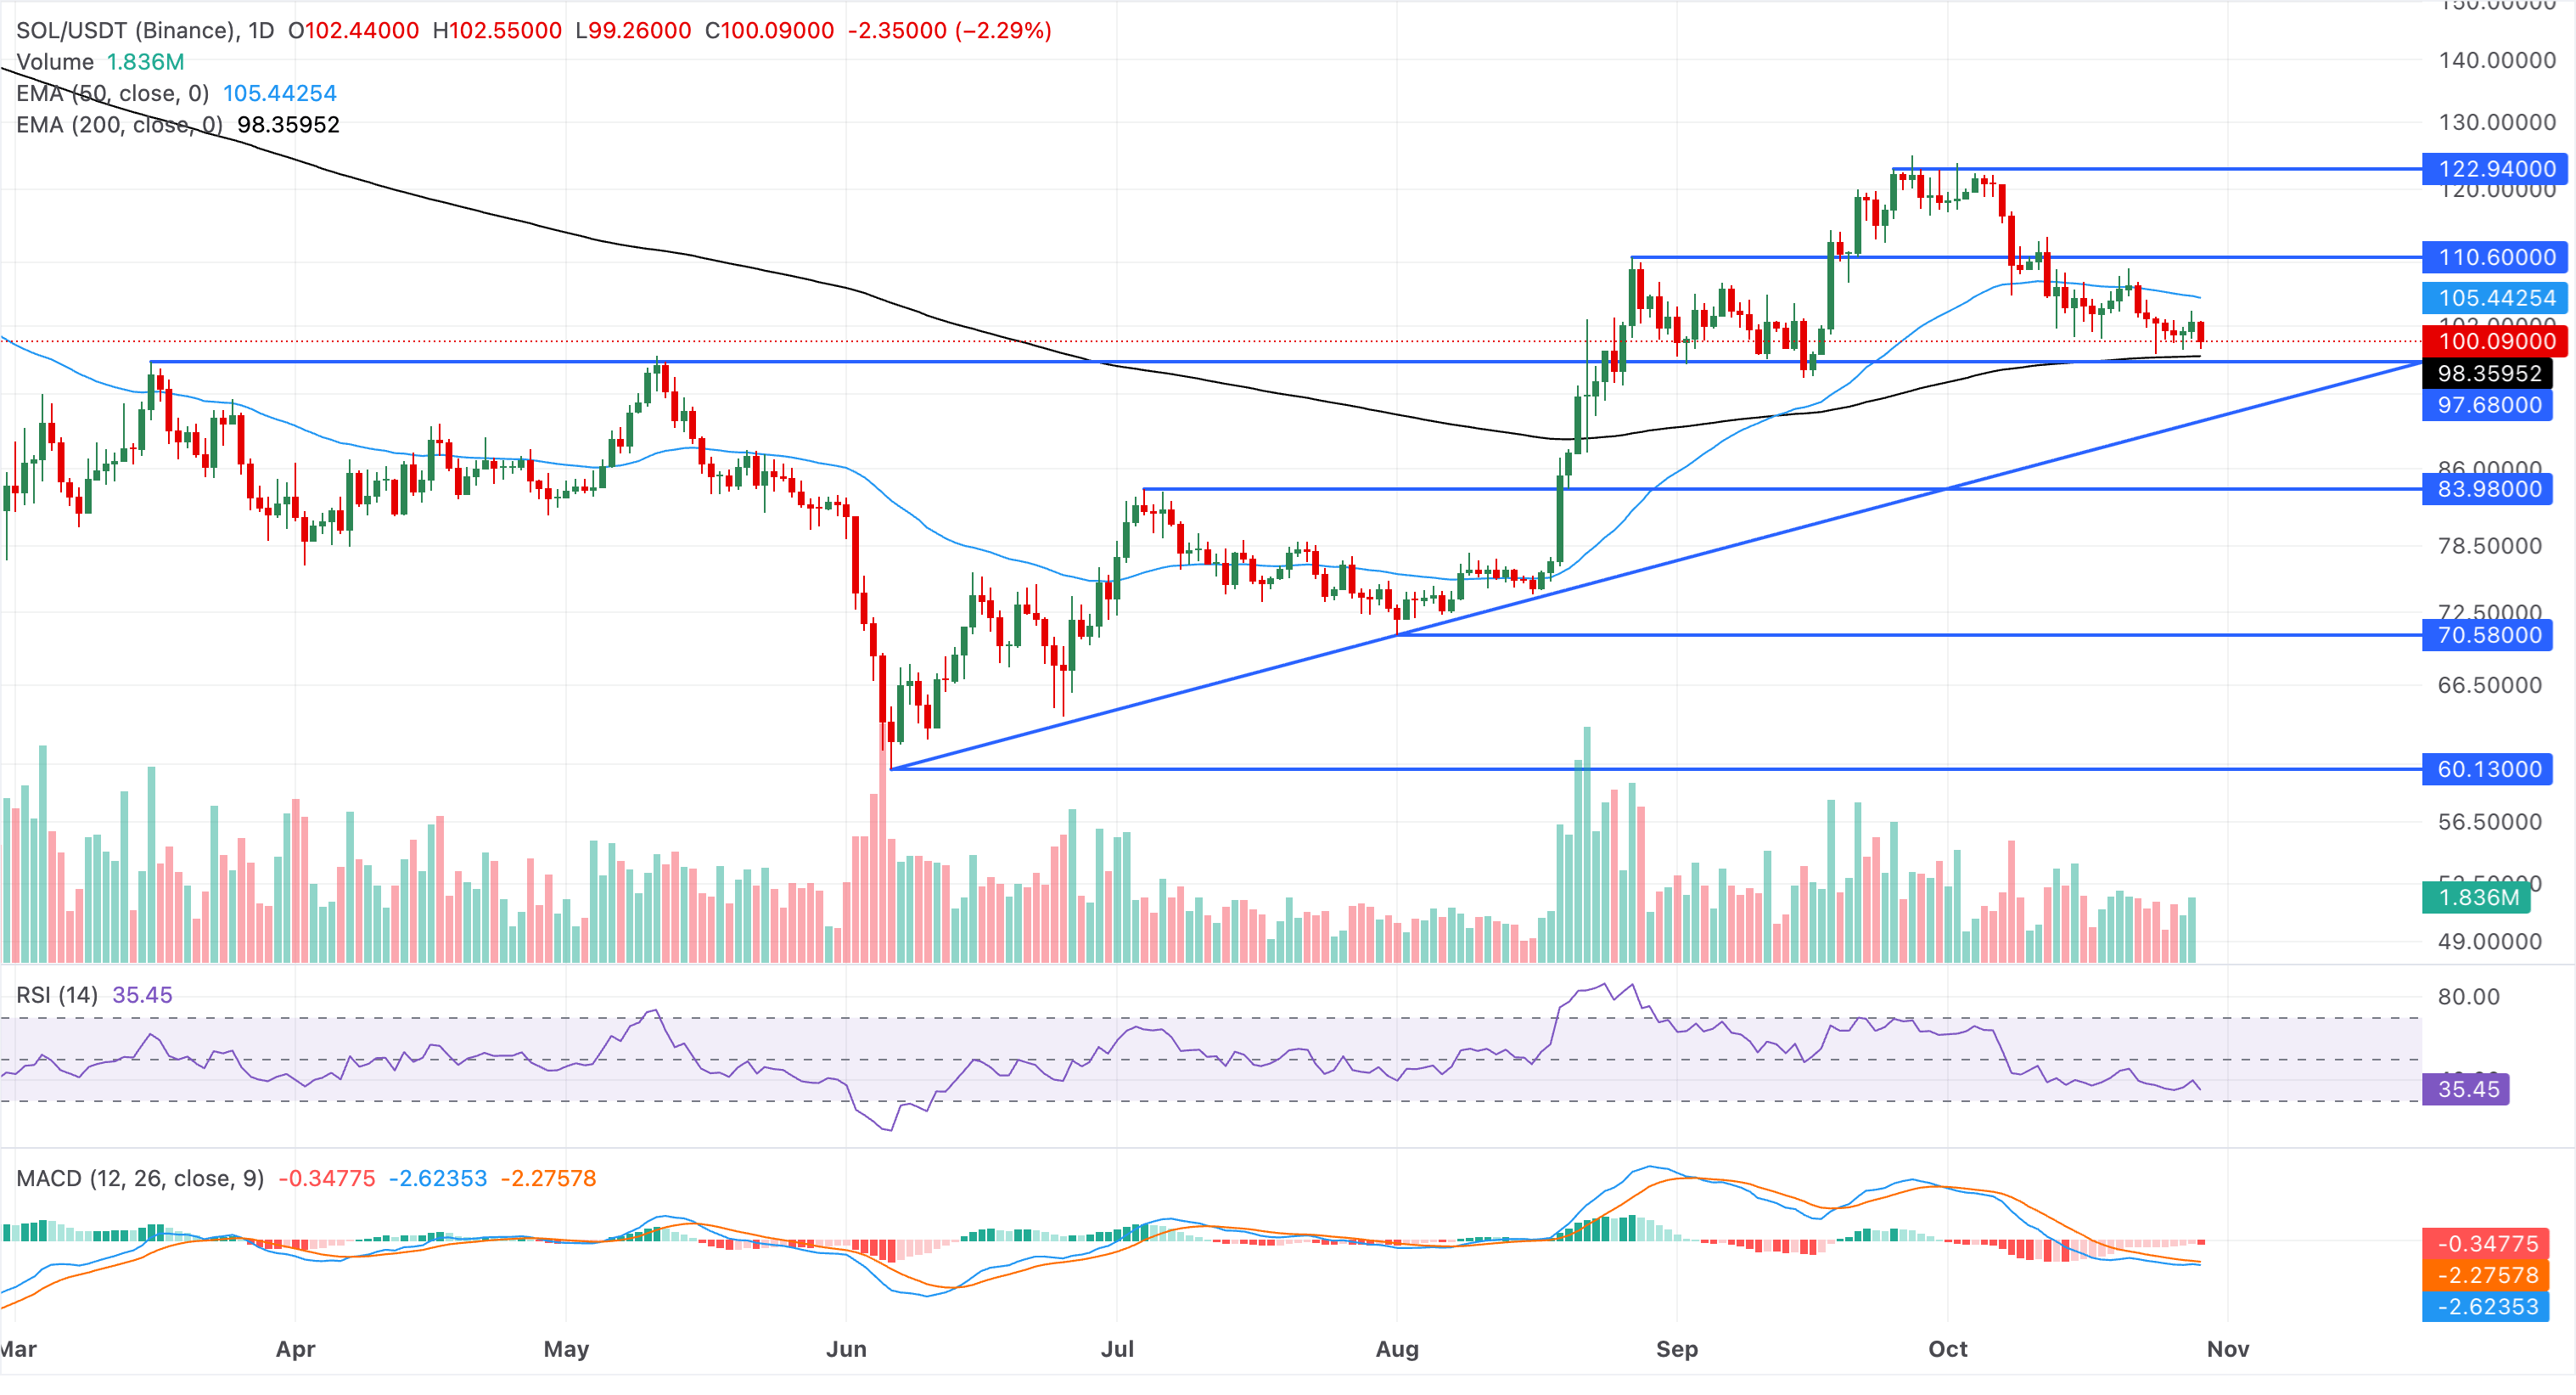
SOL/USDT daily price chart.

Immediate resistance is located at the 50-day EMA near $105.44, which caps recovery attempts and would need to be reclaimed to open a more constructive bullish phase.

Hyperliquid capped below 50-day EMA

Hyperliquid hovers above $86.00 on Thursday, maintaining a bullish near-term bias. HYPE holds well above the 50-day EMA at $81.82 and the 200-day EMA at $67.77, keeping the broader uptrend intact despite recent volatility.

Momentum conditions are constructive, with the RSI near 59 and the MACD in positive territory, hinting that buyers remain in control.

The immediate resistance for HYPE aligns with the September 3 high around $88.14, which could open the path toward the September 23 high around $98.30 and the $100 psychological threshold.

Chart Analysis HYPE/USD (baha Crypto)
HYPE/USD daily price chart.

On the downside, immediate support is defined by the 50-day EMA near $81.82. Below that, the longer-term bullish structure is supported by the rising trendline around $76.07 and the 200-day EMA at $67.77, with deeper pullbacks expected to attract dip-buying interest.

(The technical analysis of this story was written with the help of an AI tool. Know more.)

Isenção de responsabilidade: Apenas para fins informativos. O desempenho passado não é indicativo de resultados futuros.
placeholder
WTI cai abaixo de US$ 70 com pressão do Iraque sobre cotas da OPEPO WTI caiu abaixo de US$ 70 com preocupações sobre aumento da oferta global e a pressão do Iraque por uma cota maior na OPEP, enquanto o mercado acompanha o risco de saída iraquiana e a estabilidade da OPEP+.
Autor  TradingKey
6 Mês 25 Dia Qui
O WTI caiu abaixo de US$ 70 com preocupações sobre aumento da oferta global e a pressão do Iraque por uma cota maior na OPEP, enquanto o mercado acompanha o risco de saída iraquiana e a estabilidade da OPEP+.
placeholder
O petróleo WTI atinge nova máxima de seis semanas em US$ 86,00 com a escalada das tensões no Oriente MédioO petróleo WTI subiu para a máxima de seis semanas acima de US$ 86, impulsionado pela escalada das tensões no Oriente Médio e pelos riscos de interrupção em rotas estratégicas como o Mar Vermelho e Hormuz. Apesar do aumento inesperado nos estoques dos EUA, o mercado segue focado nos riscos de oferta.
Autor  FXStreet
7 Mês 22 Dia Qua
O petróleo WTI subiu para a máxima de seis semanas acima de US$ 86, impulsionado pela escalada das tensões no Oriente Médio e pelos riscos de interrupção em rotas estratégicas como o Mar Vermelho e Hormuz. Apesar do aumento inesperado nos estoques dos EUA, o mercado segue focado nos riscos de oferta.
placeholder
O BCE aumenta as taxas de juro para 2,5% em plena inflaçãoO Banco Central Europeu (BCE) aumentou a sua taxa de juro principal para 2,5% na quinta-feira e informou os mercados que as pressões inflacionistas em toda a zona euro deverão continuar por mais tempo. O banco atribuiu o aumento dos custos energéticos à retoma dos confrontos entre os EUA e o Irão, que impactam agora a economia em geral. 25 base...
Autor  Cryptopolitan
9 Mês 11 Dia Sex
O Banco Central Europeu (BCE) aumentou a sua taxa de juro principal para 2,5% na quinta-feira e informou os mercados que as pressões inflacionistas em toda a zona euro deverão continuar por mais tempo. O banco atribuiu o aumento dos custos energéticos à retoma dos confrontos entre os EUA e o Irão, que impactam agora a economia em geral. 25 base...
placeholder
Ações do Japão e da Coreia do Sul despencam; Kospi cai 3,52%, SK Hynix cai mais de 5%, Kioxia cai quase 7%TradingKey - Em 22 de outubro, os mercados de ações do Japão e da Coreia do Sul sofreram mais uma onda de vendas. O índice sul-coreano KOSPI fechou em queda de 3,52%, aos 5.533,78 pontos, enquanto o í
Autor  TradingKey
10 Mês 22 Dia Qui
TradingKey - Em 22 de outubro, os mercados de ações do Japão e da Coreia do Sul sofreram mais uma onda de vendas. O índice sul-coreano KOSPI fechou em queda de 3,52%, aos 5.533,78 pontos, enquanto o í
placeholder
Ouro opera em leve queda e dólar renova máxima de duas semanas antes do desfecho do FOMCO ouro (XAU/USD) recua a partir da máxima semanal de cerca de US$ 4.070, atingida durante a sessão asiática desta quarta-feira, interrompendo uma sequência de dois dias de altas antes do evento decisivo do banco central.
Autor  FXStreet
Ontem 06: 00
O ouro (XAU/USD) recua a partir da máxima semanal de cerca de US$ 4.070, atingida durante a sessão asiática desta quarta-feira, interrompendo uma sequência de dois dias de altas antes do evento decisivo do banco central.
goTop
quote