


Bitcoin Price Forecast: BTC steadies below $90,000 ahead of Fed rate decision
- Bitcoin price stabilizes on Wednesday after recovering nearly 3% in the previous two days.
- US-listed spot ETFs record an outflow of $147.37 on Tuesday, signaling cautious institutional positioning.
- Market participants now await the FOMC decision for more clues on the rate-cut path, which could spark fresh volatility in risky assets.
Bitcoin (BTC) price is inching closer to the key $90,000 psychological level on Wednesday after rebounding 3% so far this week. The institutional demand for BTC signals cautious positioning as spot Exchange Traded Funds (ETFs) recorded mild outflow on Tuesday. Traders now turn attention to the outcome of the two-day Federal Open Market Committee (FOMC) meeting for more clues on the interest rate-cut path, which could act as a key catalyst for short-term volatility in the Crypto King.
BTC could see fresh volatility
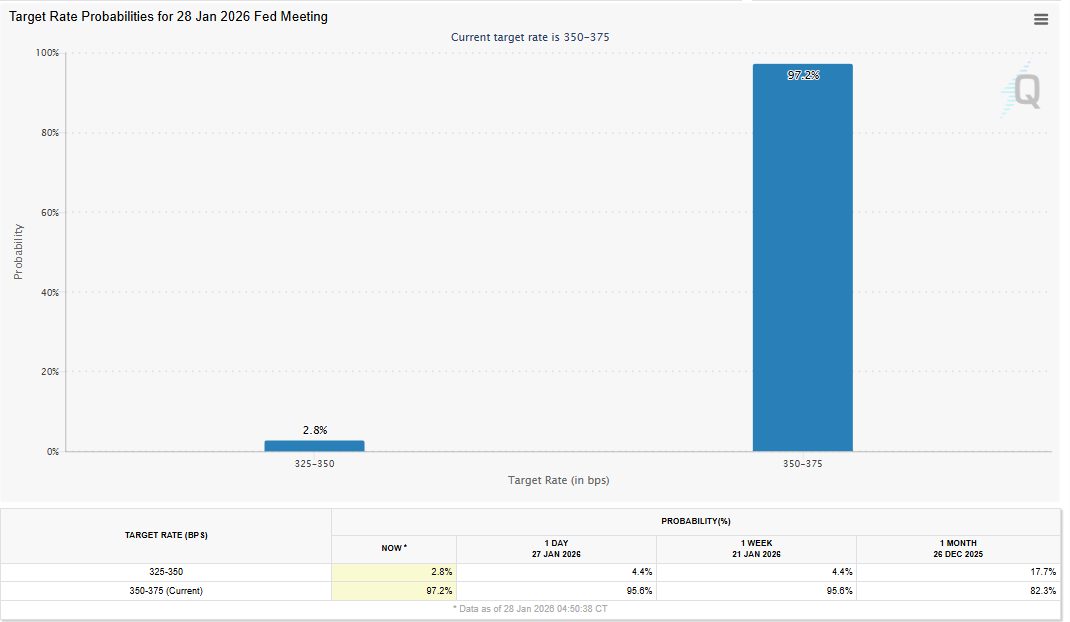
Bitcoin started the week on a positive note, recovering nearly 3% after correcting more than 7% in the previous week. The upcoming Federal Reserve (Fed) interest rate decision on Wednesday is a key event to watch for. The CME FedWatch tool shows a 97.2% chance that the rates will remain unchanged in the 3.50%-3.75% range. Therefore, the focus will be on Fed Chair Jerome Powell's comments at the press conference after the decision, where any comment will be scrutinized for new clues on the interest rate path ahead and any surprise could bring in fresh volatility for risky assets, such as Bitcoin.
Market attention is now focused on the outcome of the two-day FOMC meeting for more clues on the rate-cut path. A dovish tone from policymakers could boost risk-on sentiment and support an upside move for riskier assets such as BTC. On the contrary, hawkish comments may reignite risk-off positioning and weigh on Bitcoin price.
Cautious stance among institutional investors
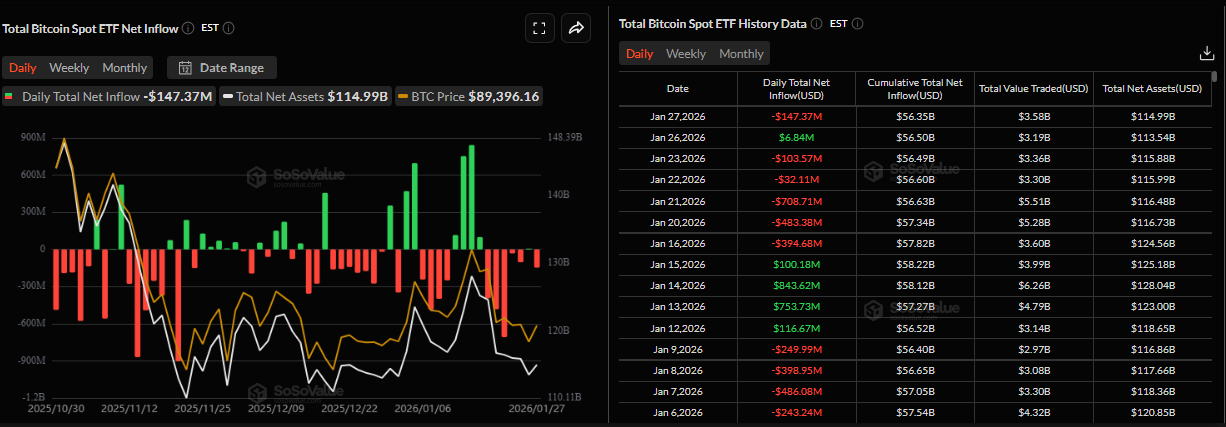
Institutional demand for Bitcoin signals a cautious stance among investors. The SoSoValue data shows that spot Bitcoin ETFs recorded an outflow of $147.37 million on Tuesday, after a $6.84 million inflow the previous day. If this trend of intermittent outflows persists, it could signal hesitation among institutional investors and limit Bitcoin’s upside momentum.
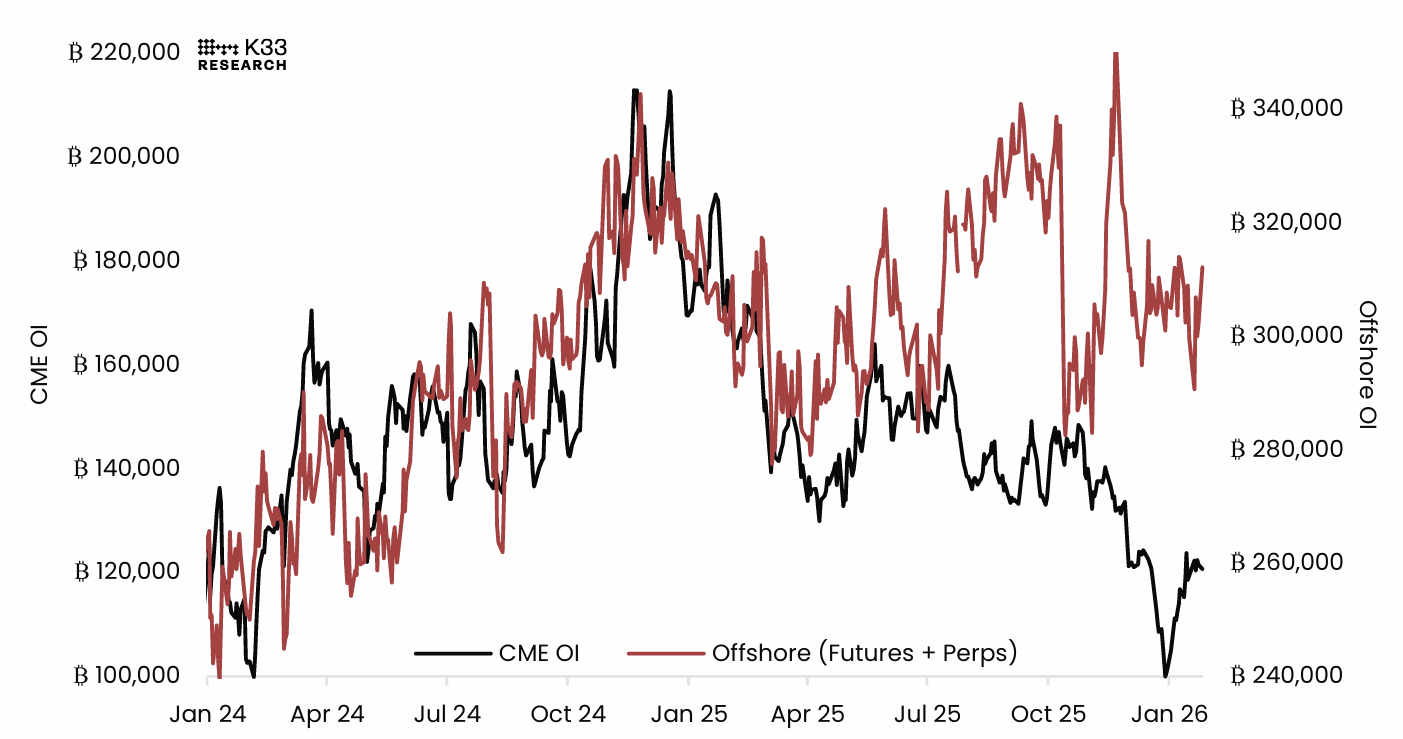
The reluctance among investors was also evident in the derivatives market. The chart below shows that Bitcoin derivatives are currently facing very docile conditions. Implied yields, both in Chicago Mercantile Exchange (CME) calendar futures and offshore perpetuals, have been compressed since October, and the first weeks of 2026 have been marked by low activity across both instruments.
While both markets show reduced participation, CME Open Interest (OI) has been in a steady downtrend over the past year and is down roughly 50% from its December 2024 peak, in contrast to offshore perpetuals, where leverage has stabilized above early-2025 lows.
“This may partly be attributed to the heightened institutional popularity of BTC ETF options for hedging and building strategies, eating into some of the near-monopolistic institutional market share in derivatives enjoyed by CME prior to the ETF options approval. Secondly, a sustained reduced demand for leveraged BTC exposure through 2x leveraged long BTC ETFs has further weakened CME’s OI dominance over the last year,” noted the K33 analyst.
Bitcoin Price Forecast: BTC extends recovery, testing key resistance
Bitcoin price recovered slightly, closing above the midpoint of a horizontal parallel channel at $87,787 on Monday, after a 7.48% correction last week. BTC continued its recovery on Tuesday and trades near $89,400 at the time of writing on Wednesday.
If the $87,787 continues to hold as support, BTC could extend the rally toward the upper boundary of the horizontal pattern at $90,000. A close above this level could extend gains toward the 50-day Exponential Moving Average (EMA) at $91,327.
The Relative Strength Index (RSI) on the daily chart is 46, pointing upward toward the neutral 50 level, indicating fading bearish momentum. For the recovery rally to be sustained, the RSI must move above the neutral level. In addition, the Moving Average Convergence Divergence (MACD) lines are converging, with fading red histogram bars below the zero line, further supporting the potential recovery thesis.
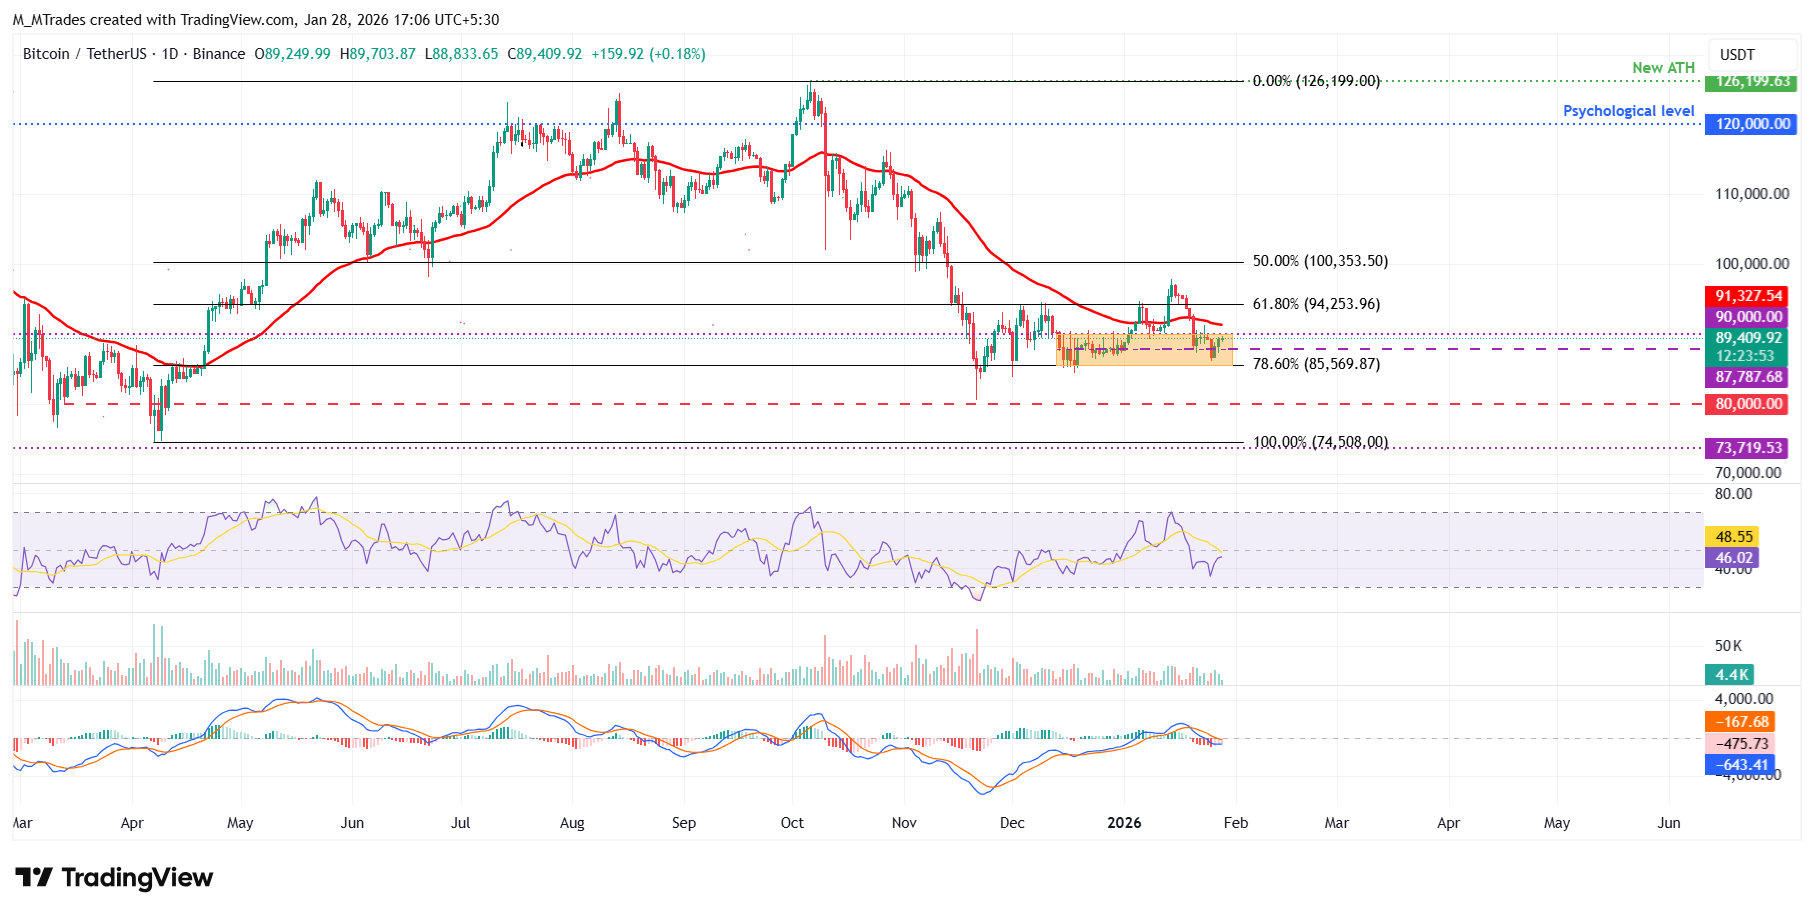
On the other hand, if BTC closes below the $87,787 support on a daily basis, it could extend the fall toward the lower consolidation boundary at $85,569, which coincides with the 78.6% Fibonacci retracement from the April 7 low of $74,508 to the October 6 all-time high of $126,199.
Bitcoin, altcoins, stablecoins FAQs
Bitcoin is the largest cryptocurrency by market capitalization, a virtual currency designed to serve as money. This form of payment cannot be controlled by any one person, group, or entity, which eliminates the need for third-party participation during financial transactions.
Altcoins are any cryptocurrency apart from Bitcoin, but some also regard Ethereum as a non-altcoin because it is from these two cryptocurrencies that forking happens. If this is true, then Litecoin is the first altcoin, forked from the Bitcoin protocol and, therefore, an “improved” version of it.
Stablecoins are cryptocurrencies designed to have a stable price, with their value backed by a reserve of the asset it represents. To achieve this, the value of any one stablecoin is pegged to a commodity or financial instrument, such as the US Dollar (USD), with its supply regulated by an algorithm or demand. The main goal of stablecoins is to provide an on/off-ramp for investors willing to trade and invest in cryptocurrencies. Stablecoins also allow investors to store value since cryptocurrencies, in general, are subject to volatility.
Bitcoin dominance is the ratio of Bitcoin's market capitalization to the total market capitalization of all cryptocurrencies combined. It provides a clear picture of Bitcoin’s interest among investors. A high BTC dominance typically happens before and during a bull run, in which investors resort to investing in relatively stable and high market capitalization cryptocurrency like Bitcoin. A drop in BTC dominance usually means that investors are moving their capital and/or profits to altcoins in a quest for higher returns, which usually triggers an explosion of altcoin rallies.
Artigos Recomendados


