
Top Crypto Gainers: Aster, World Liberty Financial, SPX6900 rebound as Bitcoin crosses $110,000
- Aster’s falling wedge breakout records double-digit gains, eyeing further recovery.
- World Liberty Financial token rebounds in a sideways range, with bulls eyeing a potential upside breakout.
- SPX6900 holds at a key support level of $0.9018 amid an impending Death Cross pattern.
Aster (ASTER), World Liberty Financial (WLFI), and SPX6900 (SPX) record double-digit gains in the last 24 hours as Bitcoin reclaims the $110,000 level. Technically, ASTER is positioned for potential further gains, while headwinds for WLFI and SPX remain significant.
Bitcoin prepares for a rebound amid short squeeze chances
Bitcoin trades above $110,000 at press time on Friday, after a 2% rise on the previous day. The bounce back in Bitcoin could face resistance at the 50-day Exponential Moving Average at $113,334, aligning with the centre Pivot Point.
If Bitcoin crosses above the 50-day EMA, it could target the R1 Pivot Point at $118,880.
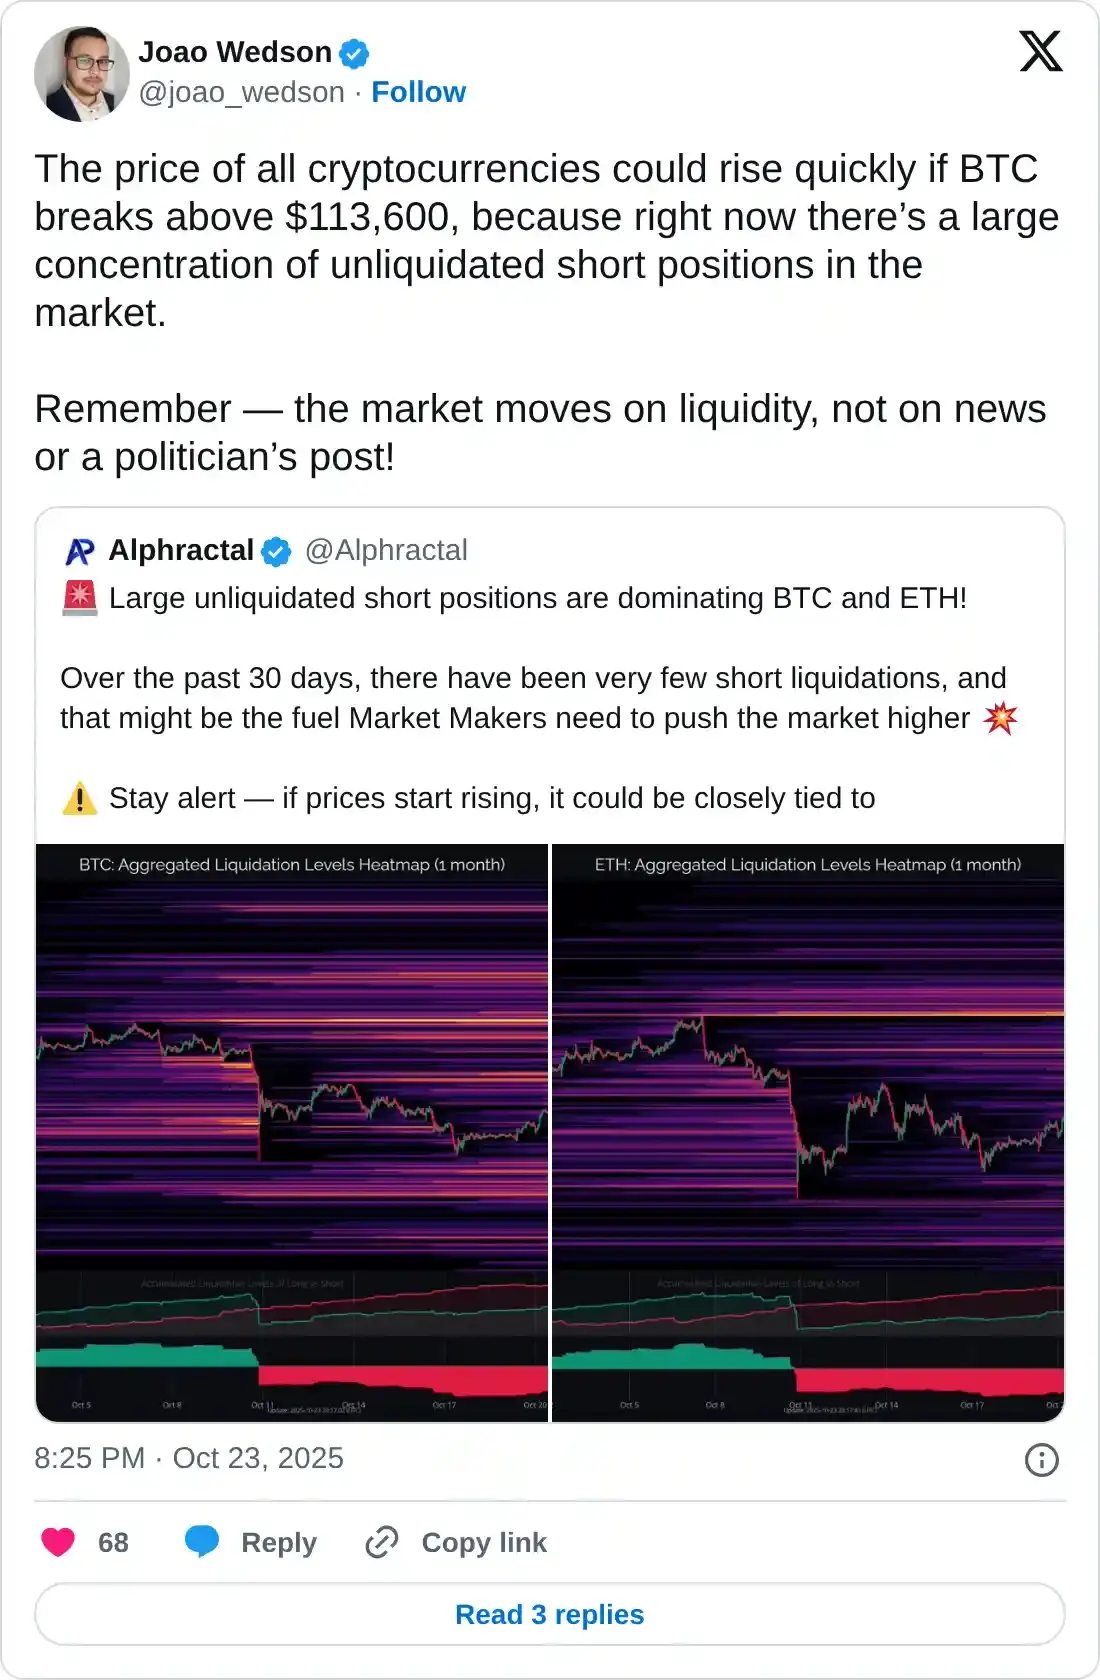
Joao Wedson, CEO of Alphractal, an on-chain analytics platform, anticipates a potential rebound in Bitcoin if bulls reclaim the $113,600 level, triggering a short squeeze run. This means that the built-up of unliquidated short positions above $113,600 is at risk of toppling like dominoes.
A positive shift in trend momentum increases Bitcoin's upside potential as the Moving Average Convergence Divergence (MACD) converges with the signal line, potentially signaling a bullish crossover. At the same time, the Relative Strength Index (RSI) rises to 46, approaching the halfway line, indicating a decline in selling pressure.
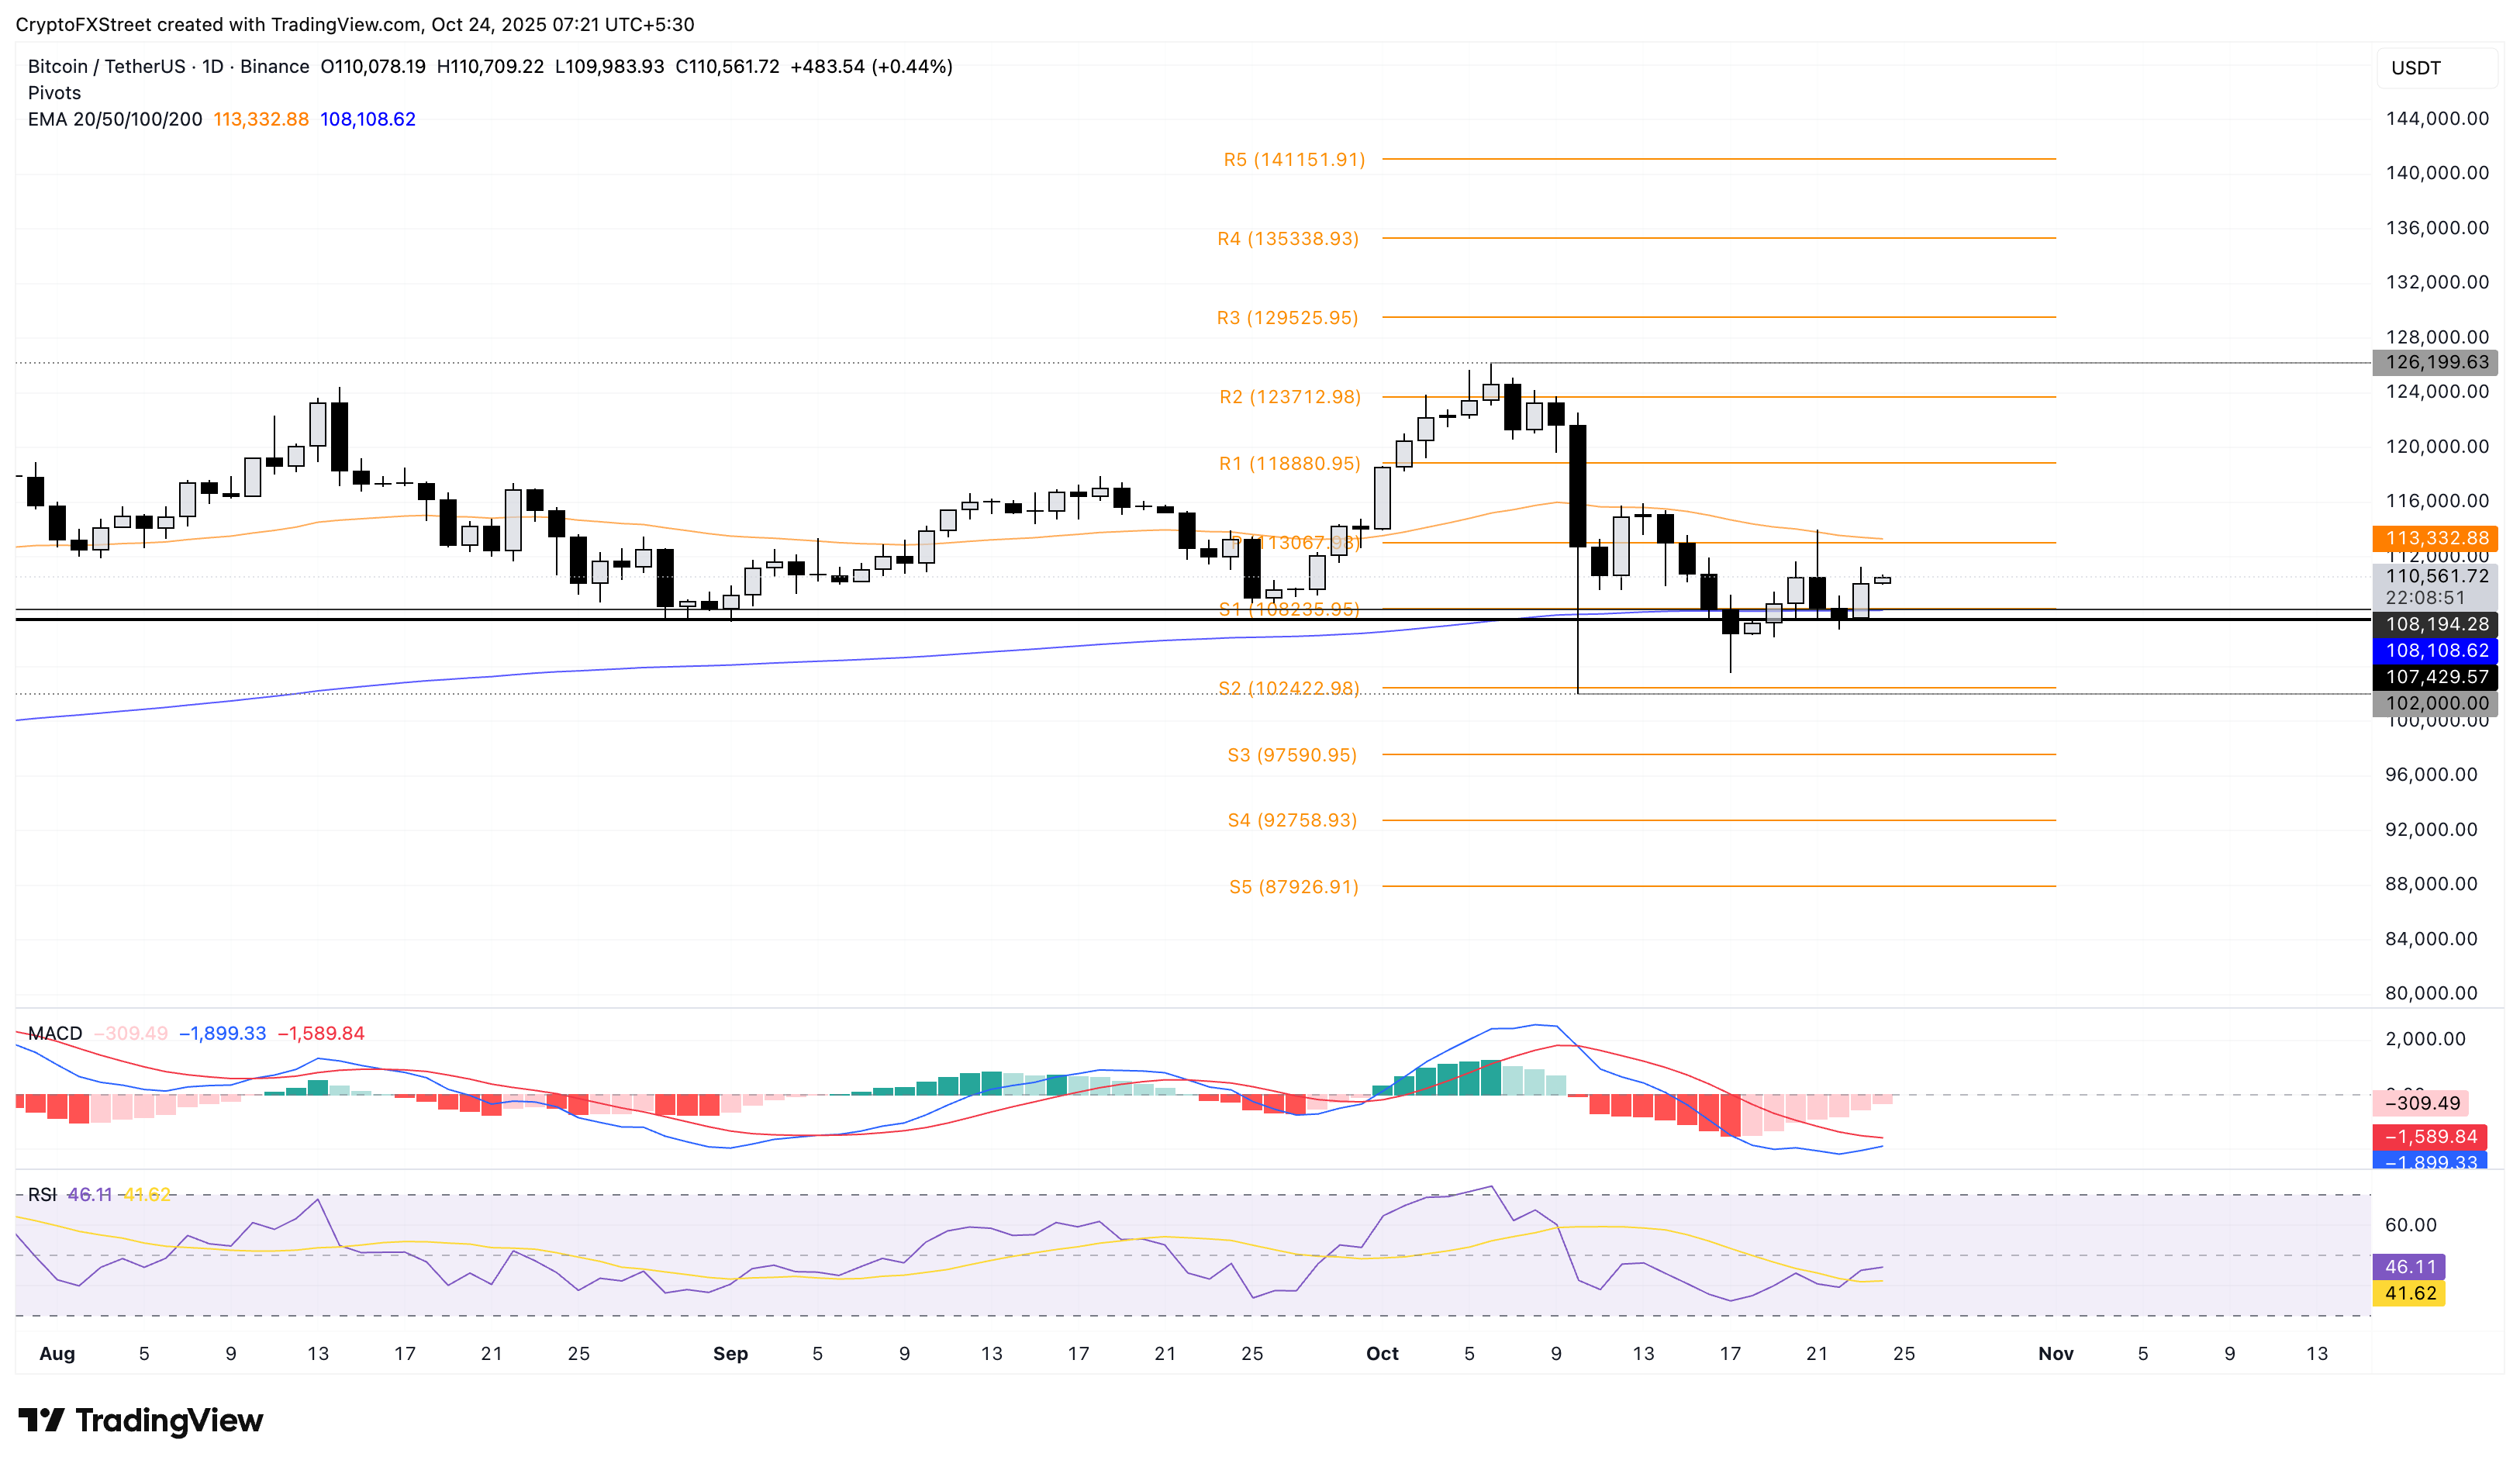
BTC/USDT daily price chart.
On the flip side, a slip below Wednesday’s close at $107,567 could extend the decline to the S2 Pivot Point at $102,422.
ASTER’s recovery turns into a wedge breakout rally
Aster edges higher by 1% at the time of writing, extending the 15% gains from Thursday. The Decentralized Exchange (DEX) token prepares to expand the breakout rally of a falling wedge pattern on the 4-hour chart.
The centre Pivot Point at $1.2733 could act as the immediate resistance for the ASTER breakout rally.
The MACD and signal line extend the uptrend towards the zero line after a crossover on Thursday, indicating a rise in bullish momentum. Additionally, the RSI at 55 surfaces above the halfway mark as buying pressure is restored.
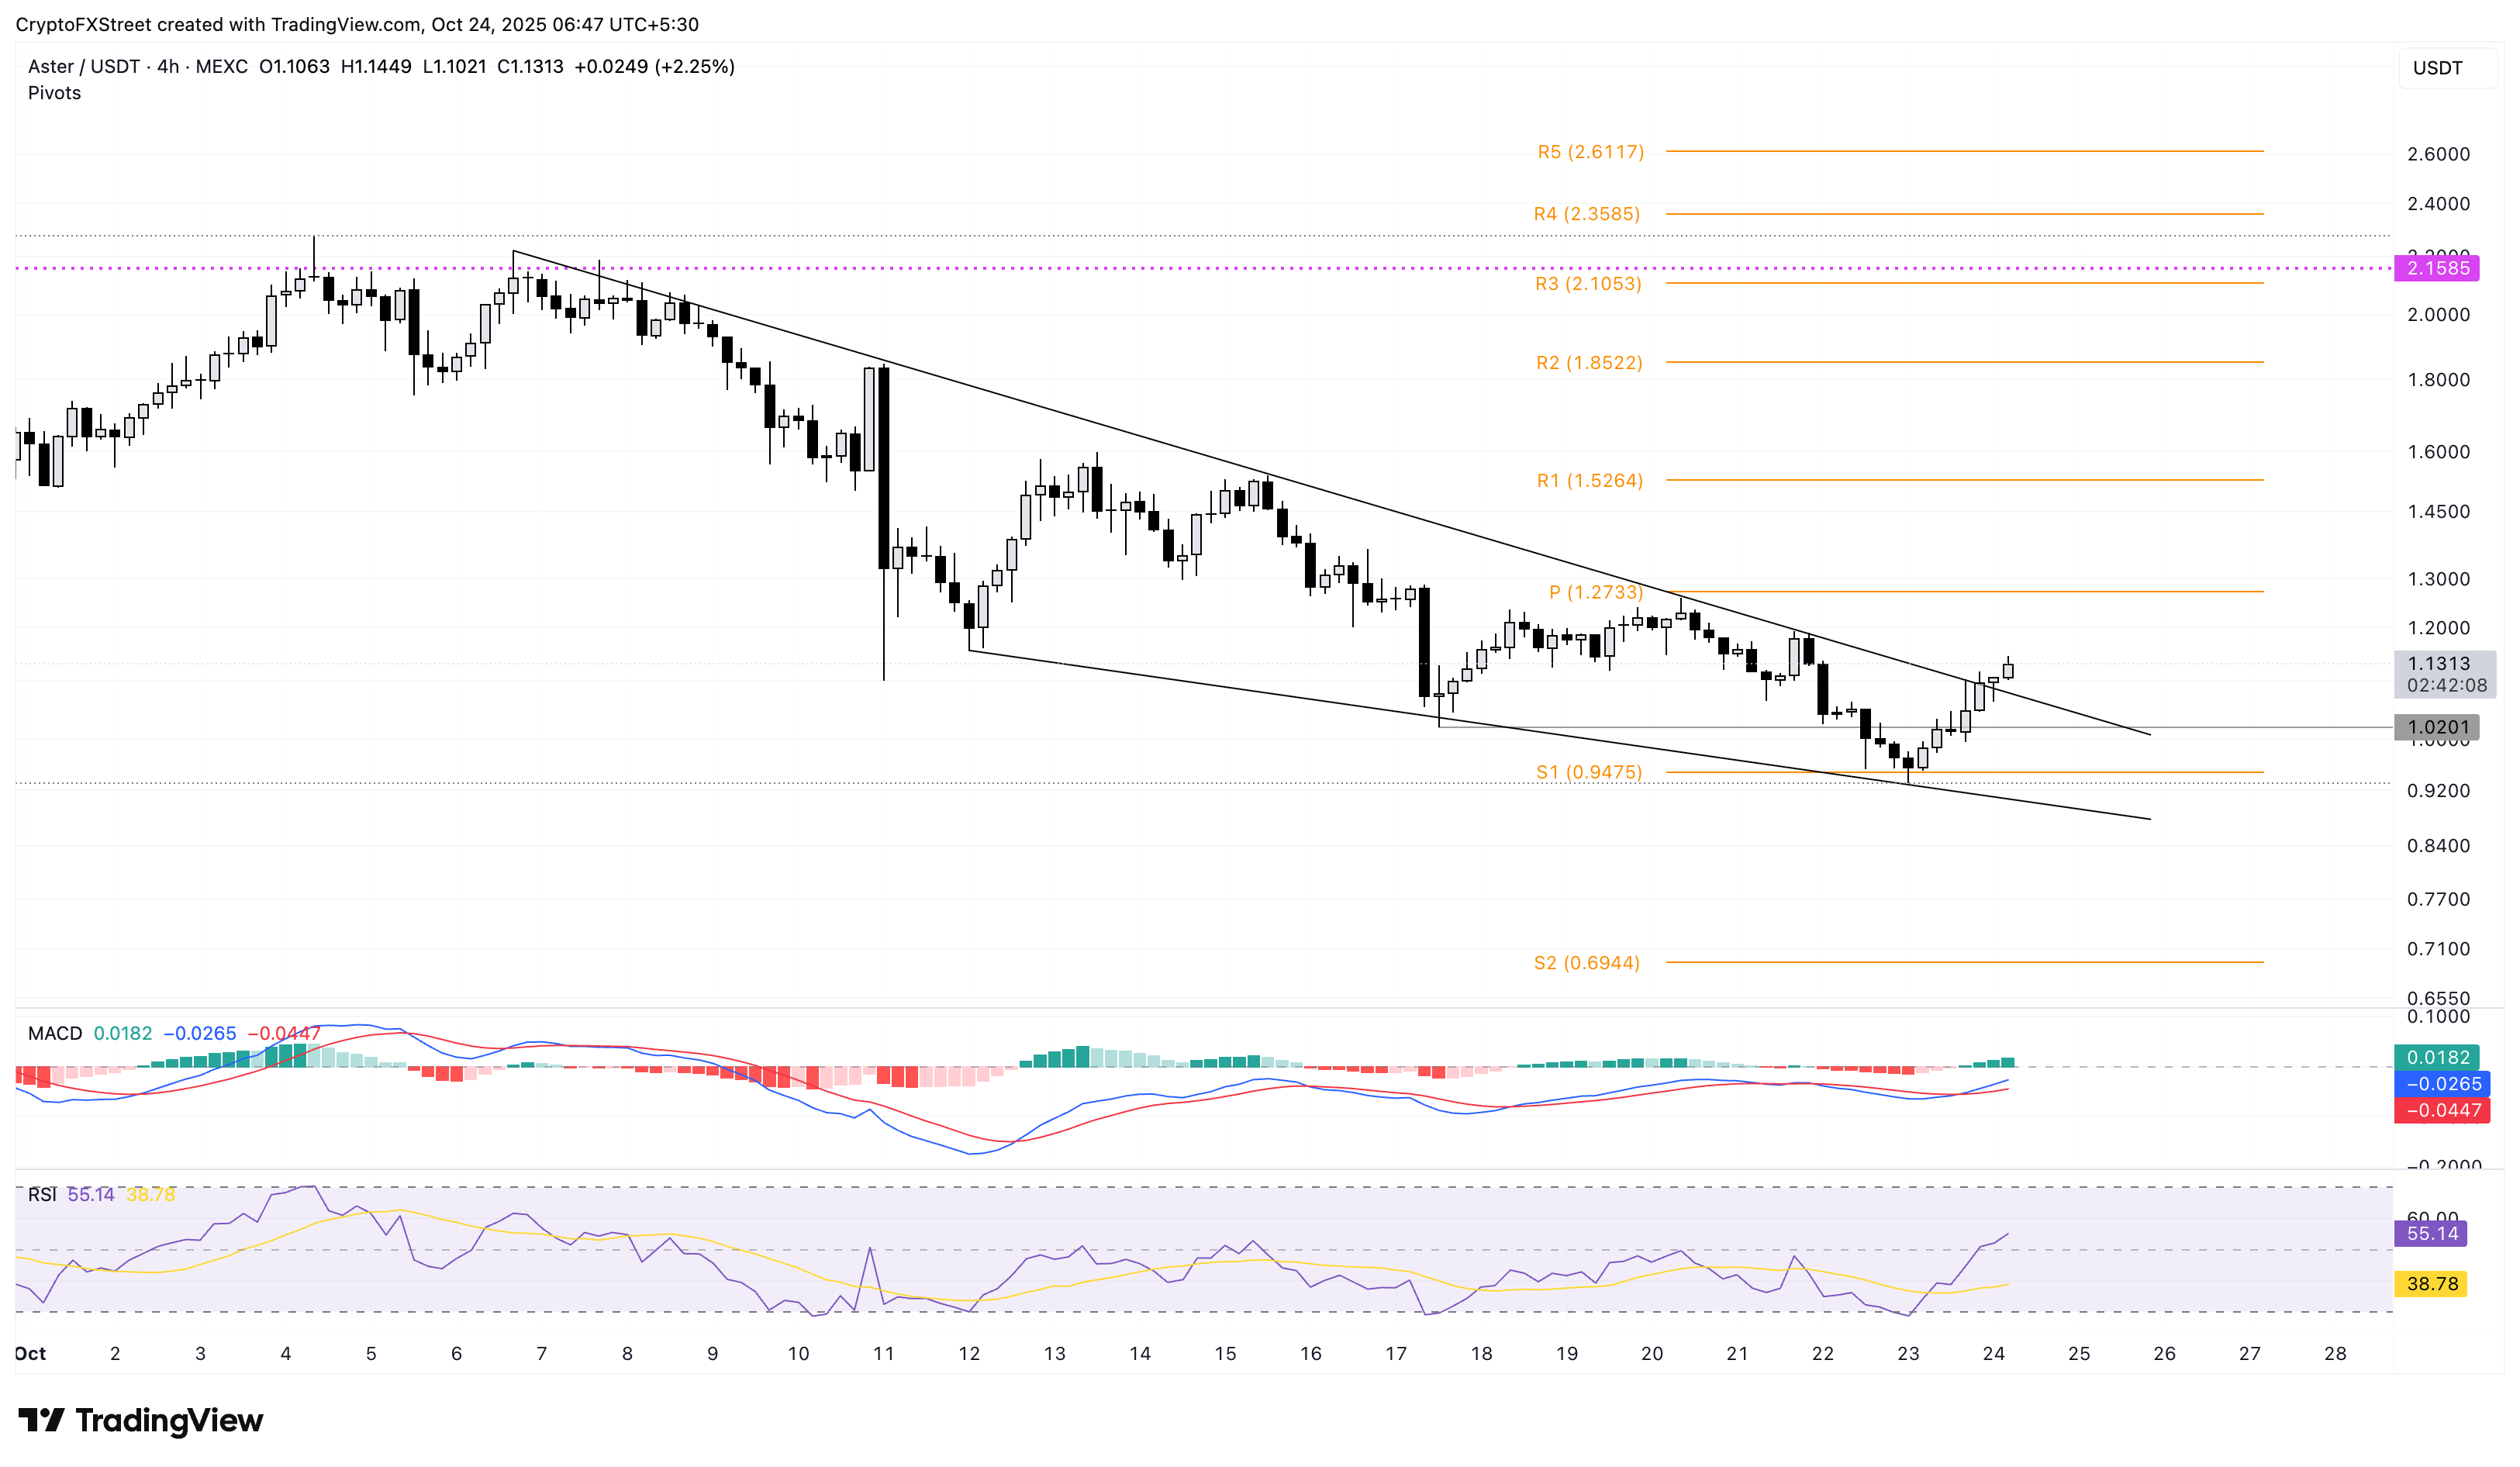
ASTER/USDT 4-hour price chart.
However, if ASTER takes a sudden bearish turn, it could test the $ 1.00 psychological support, nullifying the breakout rally.
WLFI bounces back in a consolidation range
World Liberty Financial holds steady above $0.1350 at press time on Friday, following a 16% rise on the previous day. The WLFI token is trading in a sideways range between the $0.1183 baseline and the $0.1526 ceiling on the 4-hour chart.
The pullback from the upper ceiling risks a potential decline to the $0.1183 baseline.
The MACD and signal line rise with successive positive green candles, suggesting a surge in bullish momentum. However, RSI dips to 59, reversing from the overbought zone, leaving momentum indicators overall mixed.
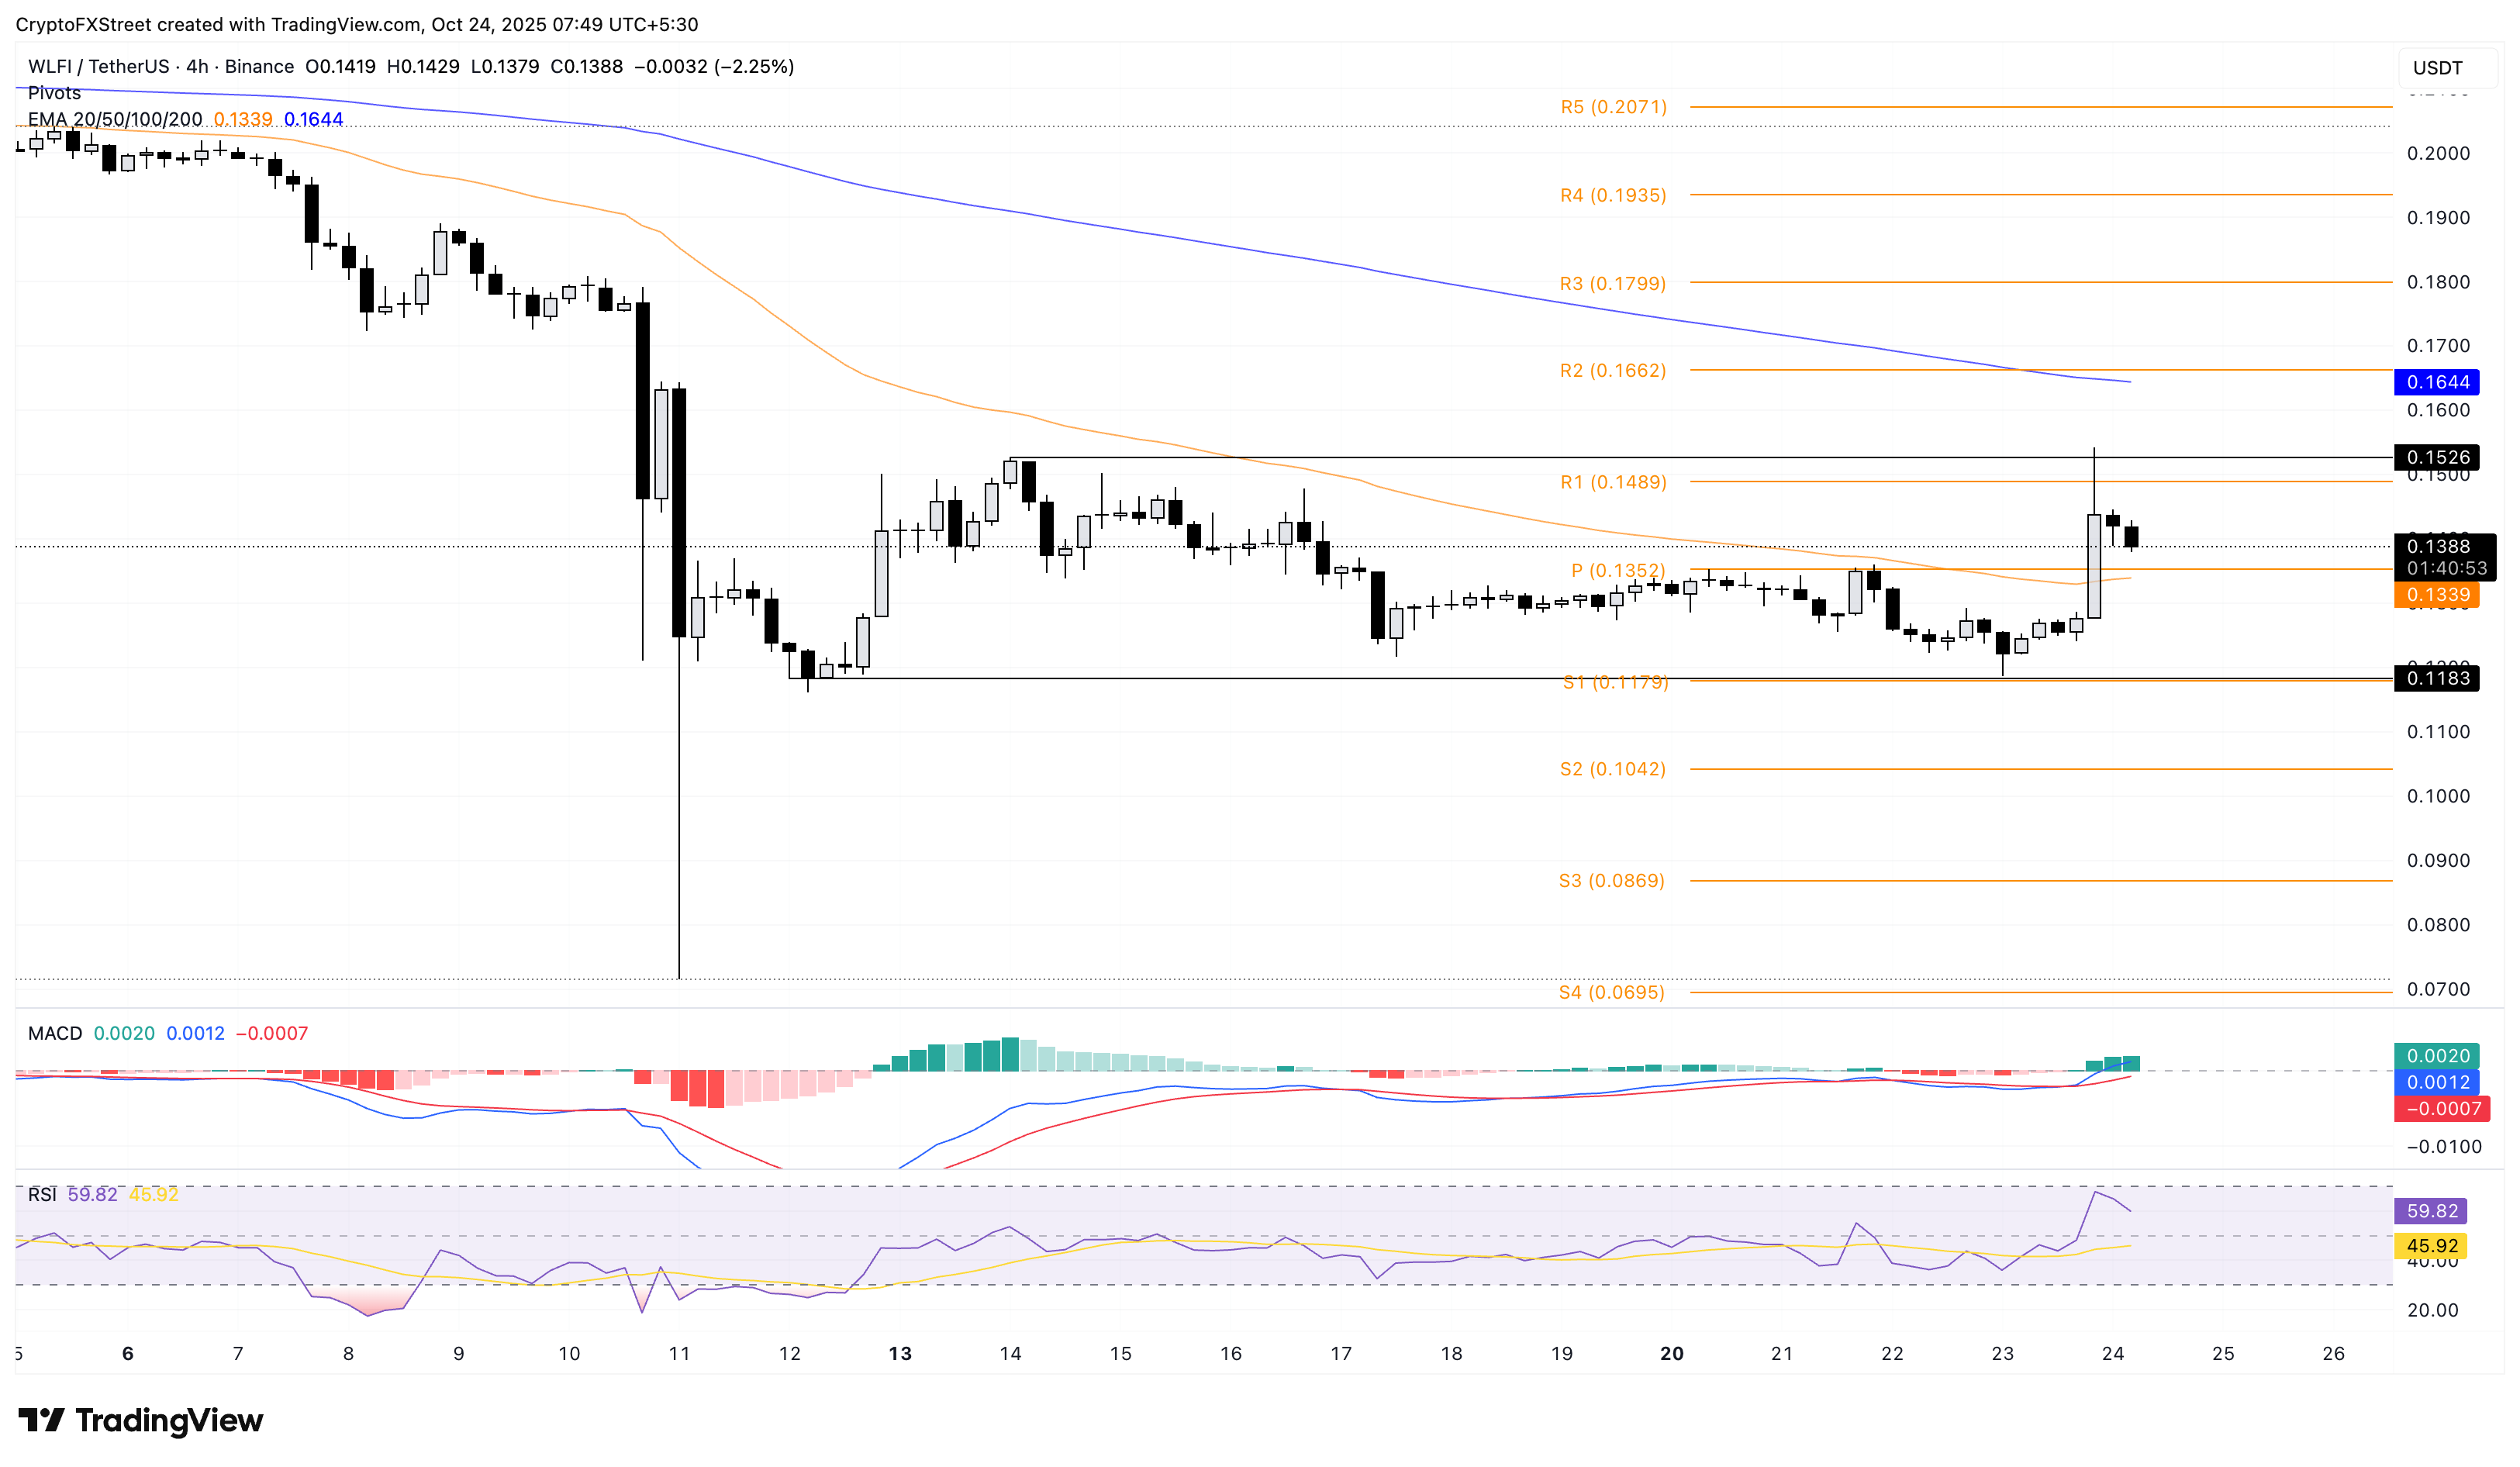
WLFI/USDT 4-hour price chart.
On the upside, a decisive breakout of the $0.1526 level could extend the WLFI rally to the 200-period EMA at $0.1644.
SPX rebounds from key support, overhead pressure persists
SPX6900 struggles to reclaim the $1 psychological level despite the 9% bounce back on Thursday from the $0.9018 demand zone. At the time of writing, SPX trades above $0.9700, holding to the Thursday gains.
If the meme coin extends recovery, it could test the centre Pivot Point at $1.1260.
The 50-day EMA is declining and converging with the 200-day EMA, risking a Death Cross. This crossover would confirm the short-term pullback outpacing the longer-term trend.
On the other hand, momentum indicators on the daily chart remain divided as the MACD approaches the signal line for a bullish crossover. Meanwhile, the RSI at 42 extends the sideways trend below the halfway line, suggesting overhead pressure.
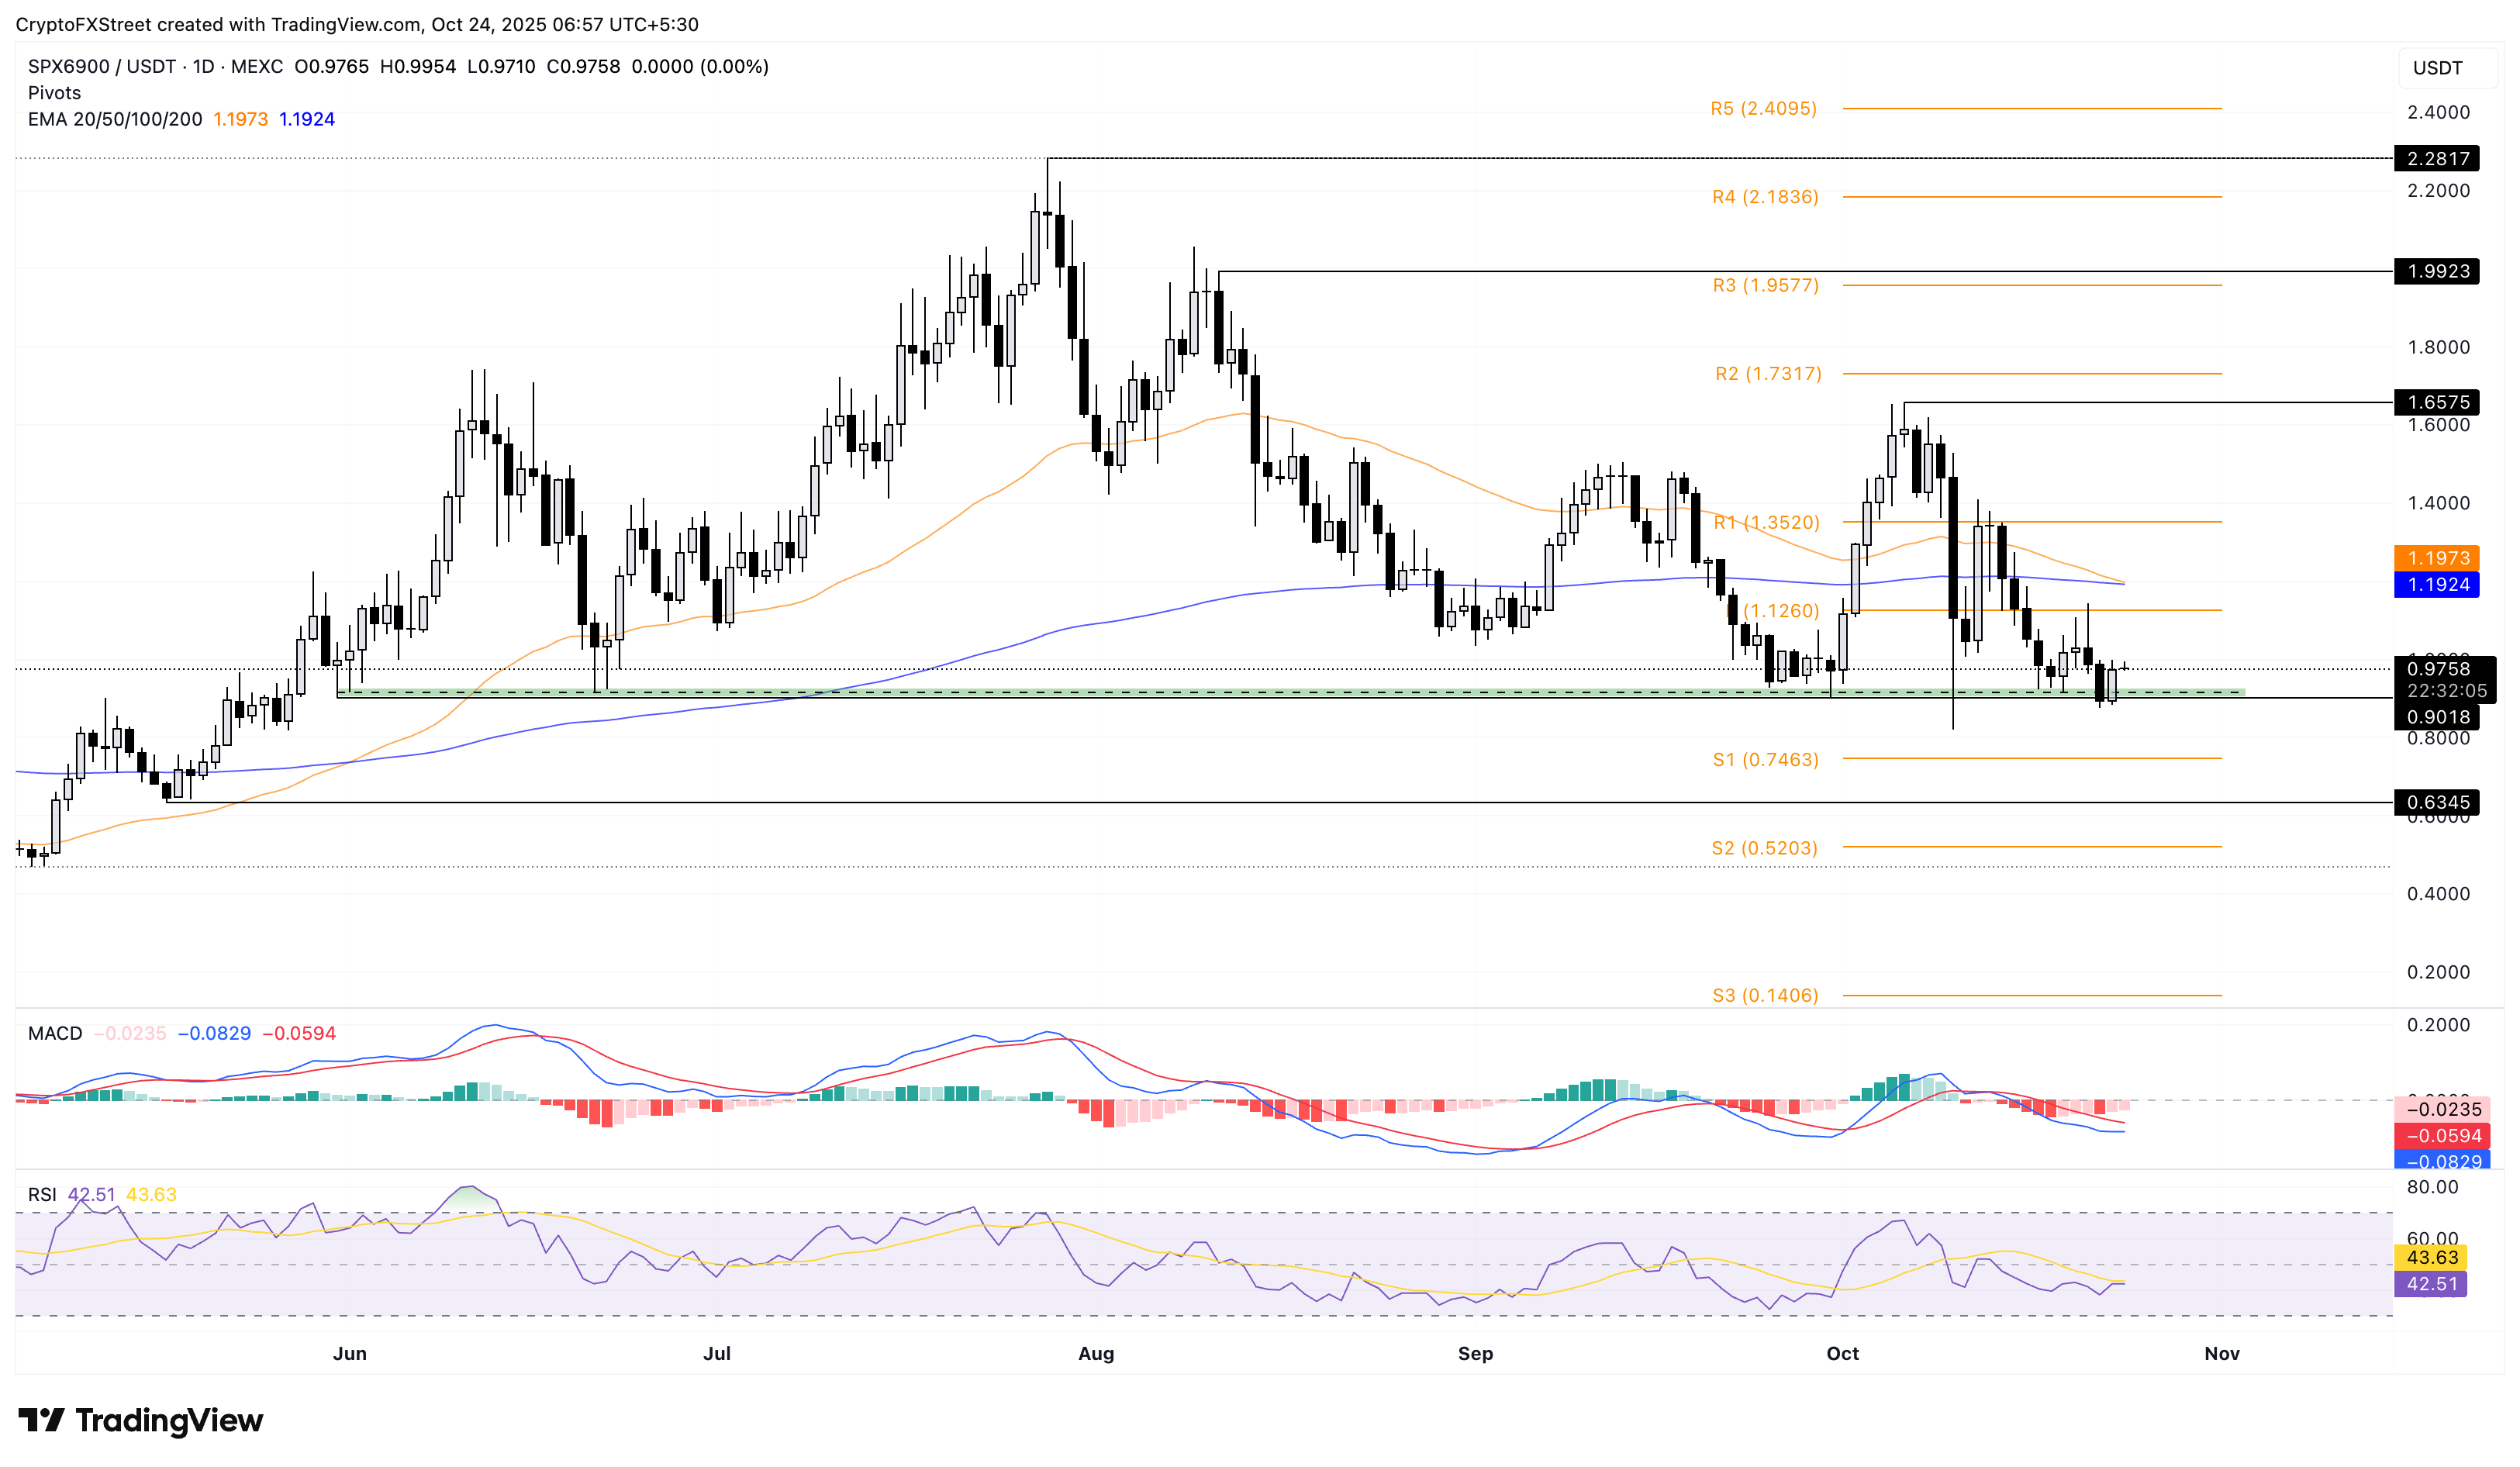
SPX/USDT daily price chart.
On the downside, if SPX slips below the $0.9018 zone, the S1 Pivot Point at $0.7463 would act as the immediate support level.
Artigos Recomendados


