

Top Crypto Gainers: 0G extends listing gains as Mantle, MemeCore sustain upside
- 0G Labs' 0G token sustains listing gains amid growing community distrust over changing tokenomics and KYC.
- Mantle rebounds within a consolidation range as momentum indicators flash reversal risks.
- MemeCore moves within a symmetrical triangle, holding at the 50-period EMA.
The cryptocurrency market remains divided on Tuesday as 0G (0G) launched by 0G Labs to decentralize its AI Mainnet, followed by Mantle (MNT) and MemeCore (M), which are leading the gains, while projects like Pi Network (PI) and Pump.fun (PUMP) record double-digit losses over the last 24 hours.
0G holds the listing gains amid disputes rising over changed tokenomics, KYC
0G Labs launched its native 0G token on Binance, resulting in nearly 400% listing gains on Monday. At the time of writing, the new AI token advances the uptrend by 20% on Tuesday, crossing above the $6 mark.
A decisive close above this level on the 1-hour chart could extend the uptrend to the $7.260 all-time high from Monday.
However, the distrust in the community is rising after the recent change in tokenomics and smaller rewards for the Know Your Customer (KYC) verification required to claim the airdrops.
In an X post on Monday, Vaibhav Gupta, a crypto influencer, has highlighted the shift in tokenomics from 130 million 0G tokens to just 2 million 0G tokens for Galxe users and 3 million 0G for node and testnet runners. Gupta also raises the issue of many Galxe users failing to pass KYC or receiving no allocation after the verification.
As the community questions the missing supply from the initial 130 million token allocation, Michael Heinrich, Founder of 0G, focuses on launching liquidity and application layers while doubling down on decentralized AI research.
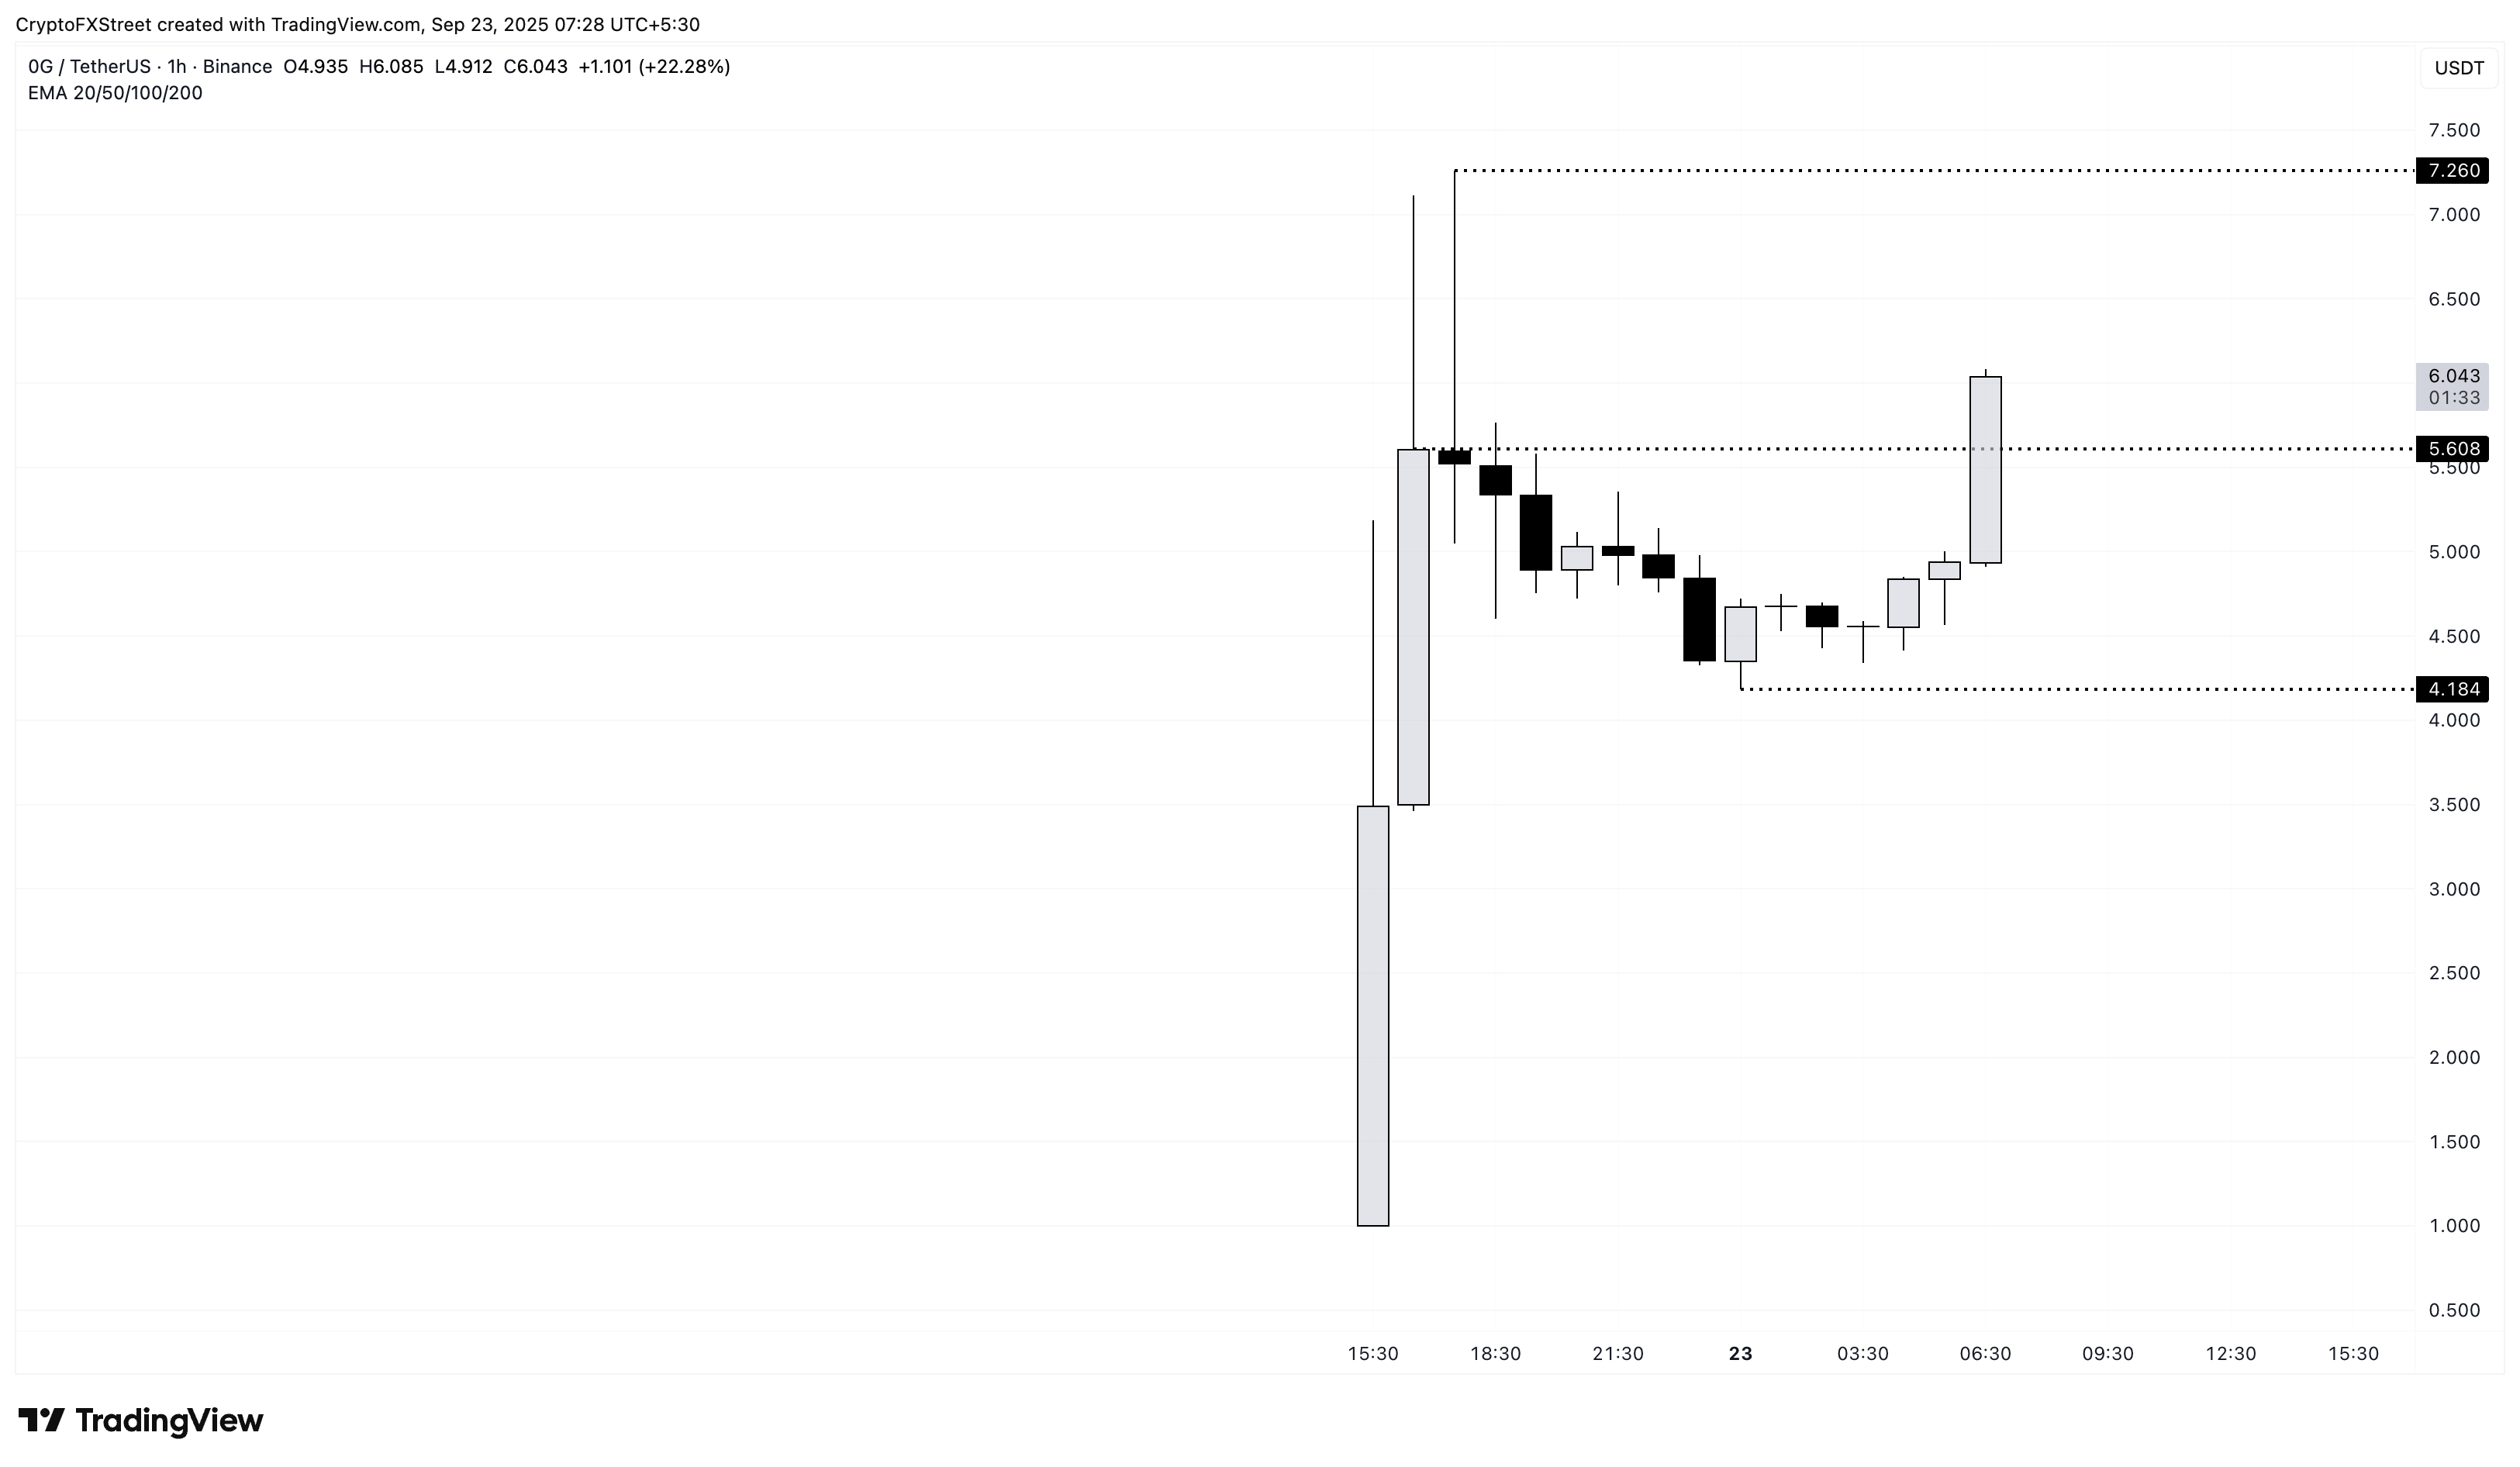
0G/USDT 1-hour price chart.
Still, a rise in the community distrust could result in a sell-off for 0G, potentially targeting the $4.184 reversal floor.
Mantle trapped in consolidation risks bearish exit
Mantle edges lower by 1% at press time on Tuesday, following the 11% rise from the previous day. The intraday pullback extends the consolidation phase between R1 and R2 pivot levels at $1.48 and $1.80, respectively.
A decisive close above $1.80 could extend the Mantle rally to the R3 pivot level at $2.21.
However, the technical indicators on the daily chart suggest a decline in bullish momentum as the consolidation expands. The Relative Strength Index (RSI) reverses from the overbought zone to 62, indicating that the buying pressure has softened.
Additionally, the Moving Average Convergence Divergence (MACD) converges with its signal line, suggesting that the short-term trend remains indecisive. If MACD crosses below its signal line, it would signal a bearish shift in trend momentum.
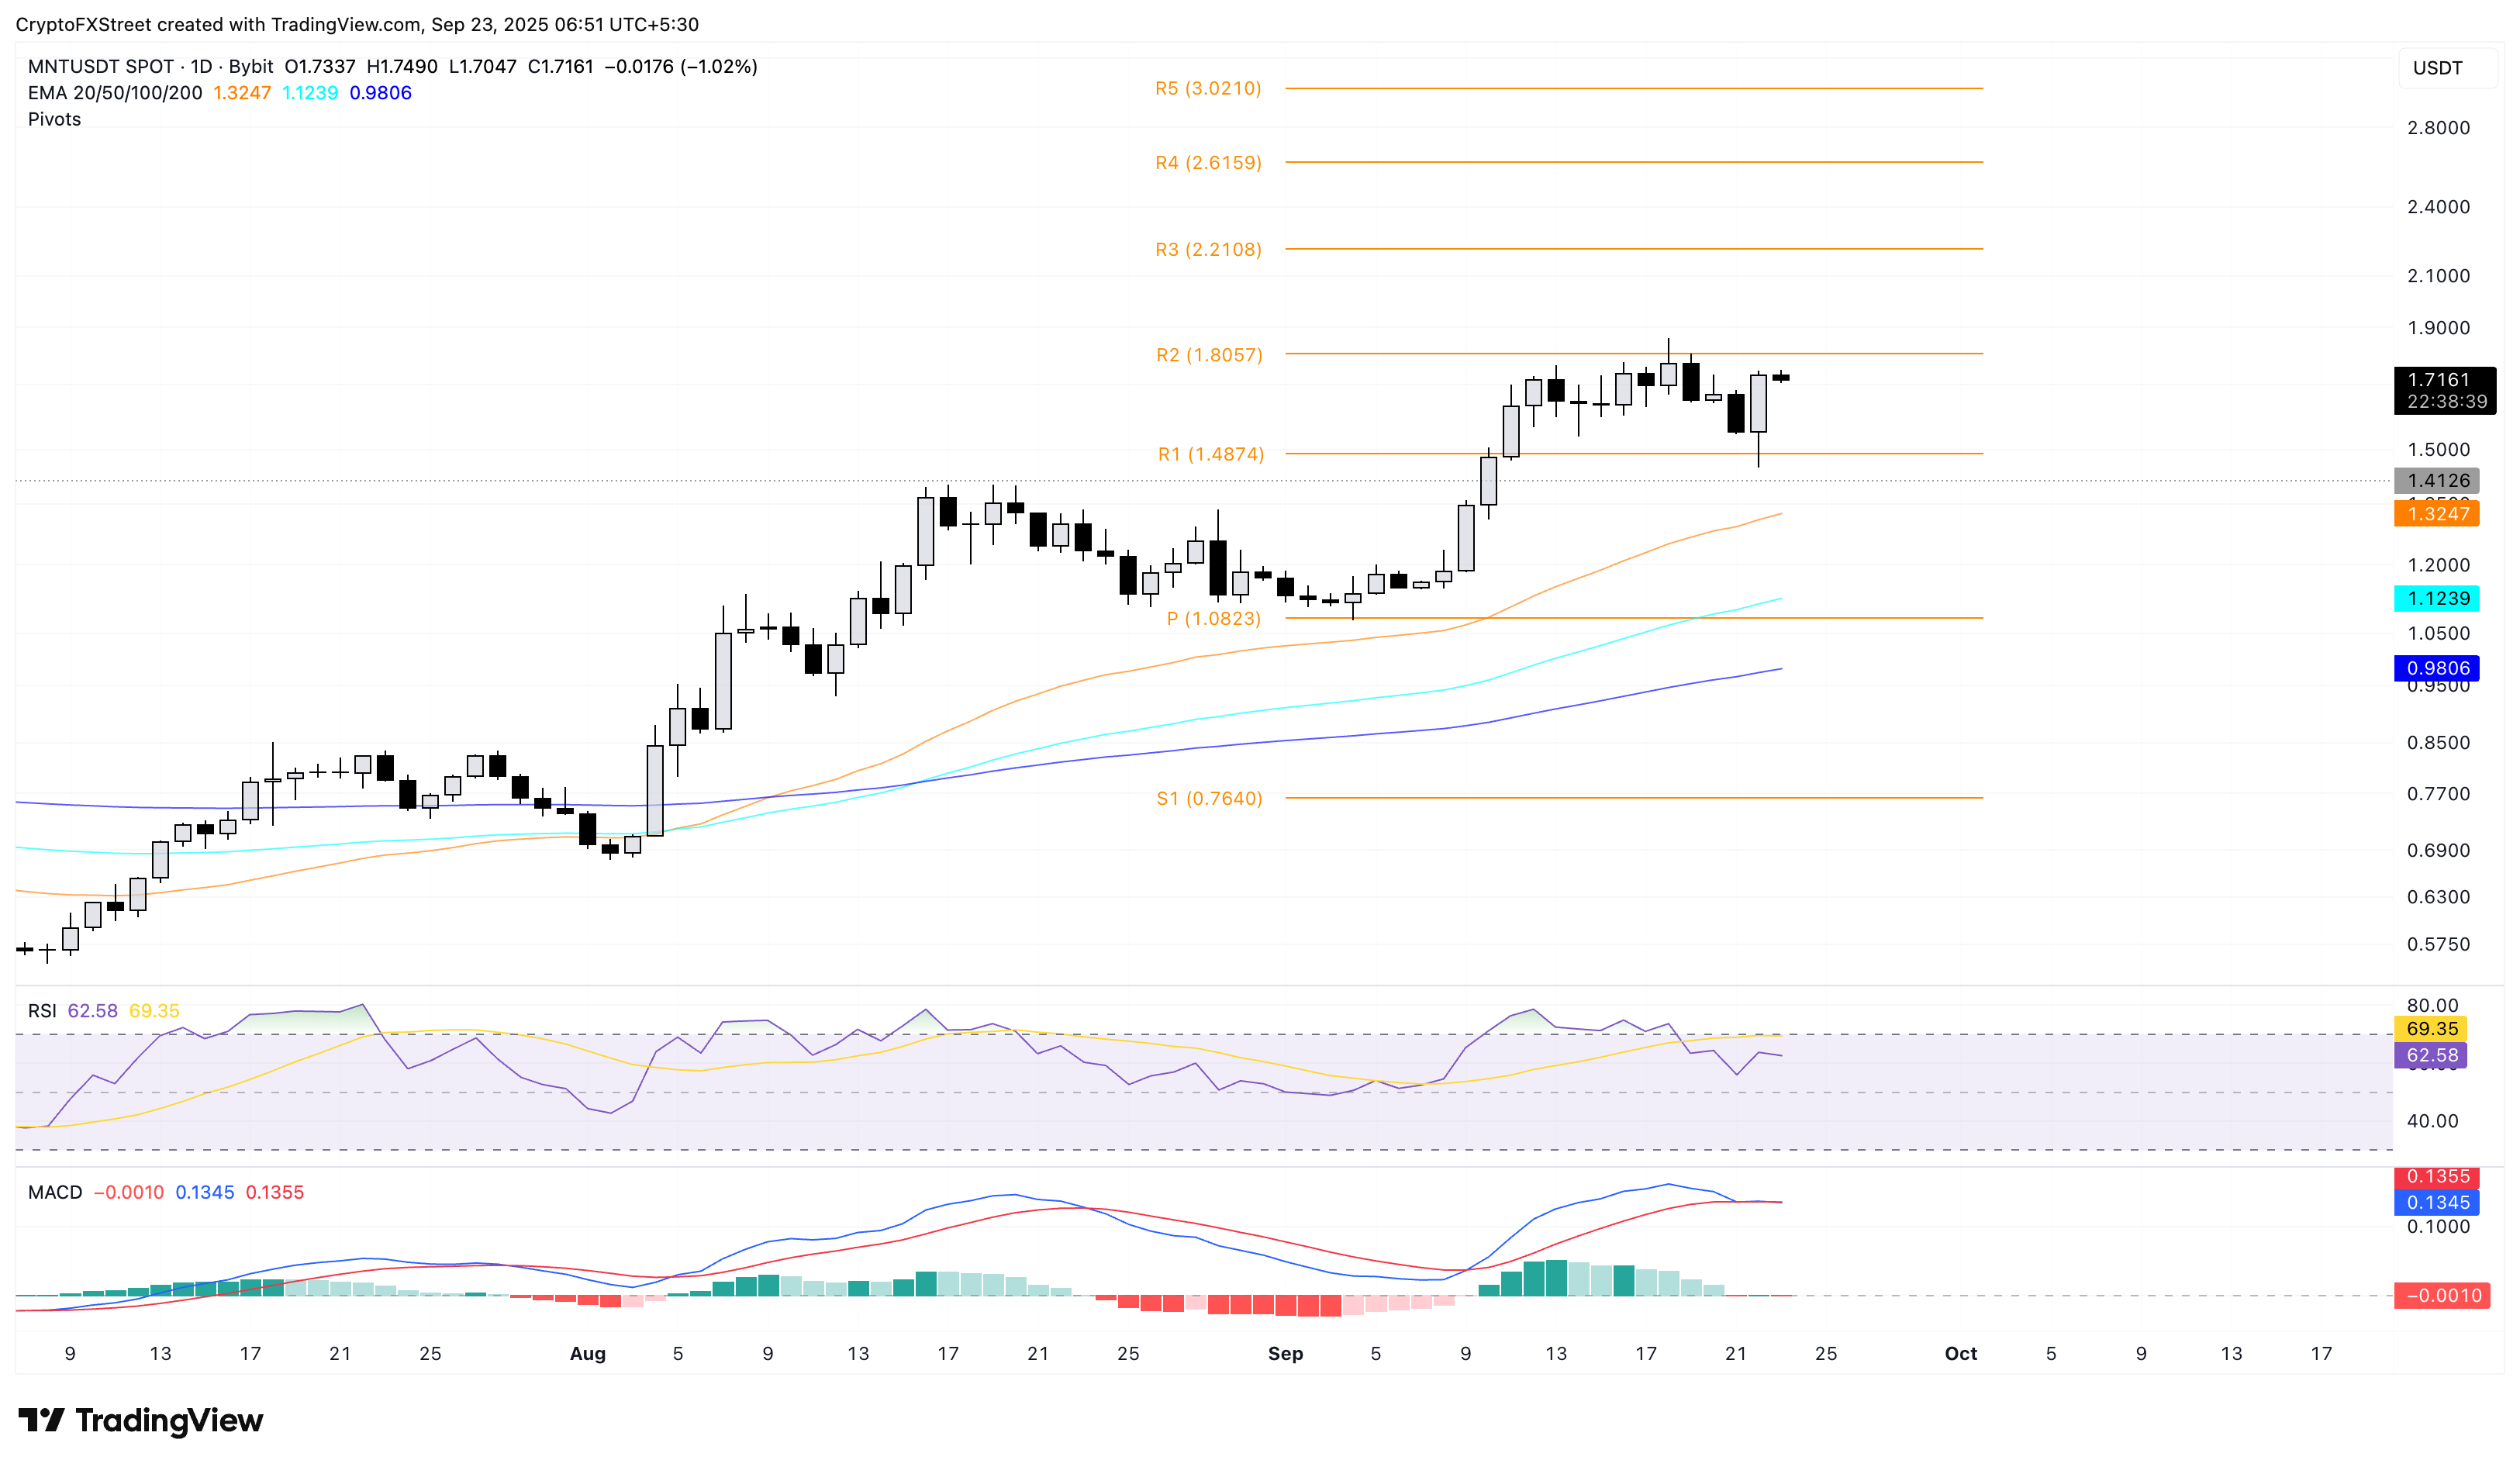
MNT/USDT daily price chart.
If the Mantle drops below $1.48 amid declining bullish momentum, it could test the 50-day Exponential Moving Average (EMA) at $1.32, followed by the centre pivot level at $1.08.
MemeCore continues to struggle within a triangle pattern
MemeCore trades above $2.60 at press time on Tuesday, sustaining the 8.42% gains from Monday. The meme coin reverses within a symmetrical triangle pattern on the 4-hour chart, targeting the 50-period EMA at $2.45.
If MemeCore crosses below this dynamic support, it could test the 100-period EMA at $2.19, which is closely tracing the triangle pattern’s lower trendline.
The RSI at 54 holds above the halfway line with further space for growth. However, a drop below the midpoint line could extend the intraday decline. Similarly, the uptrending MACD and its signal line above the zero line indicate a bullish tilt, while a reversal below the zero line would indicate a rise in bearish momentum.
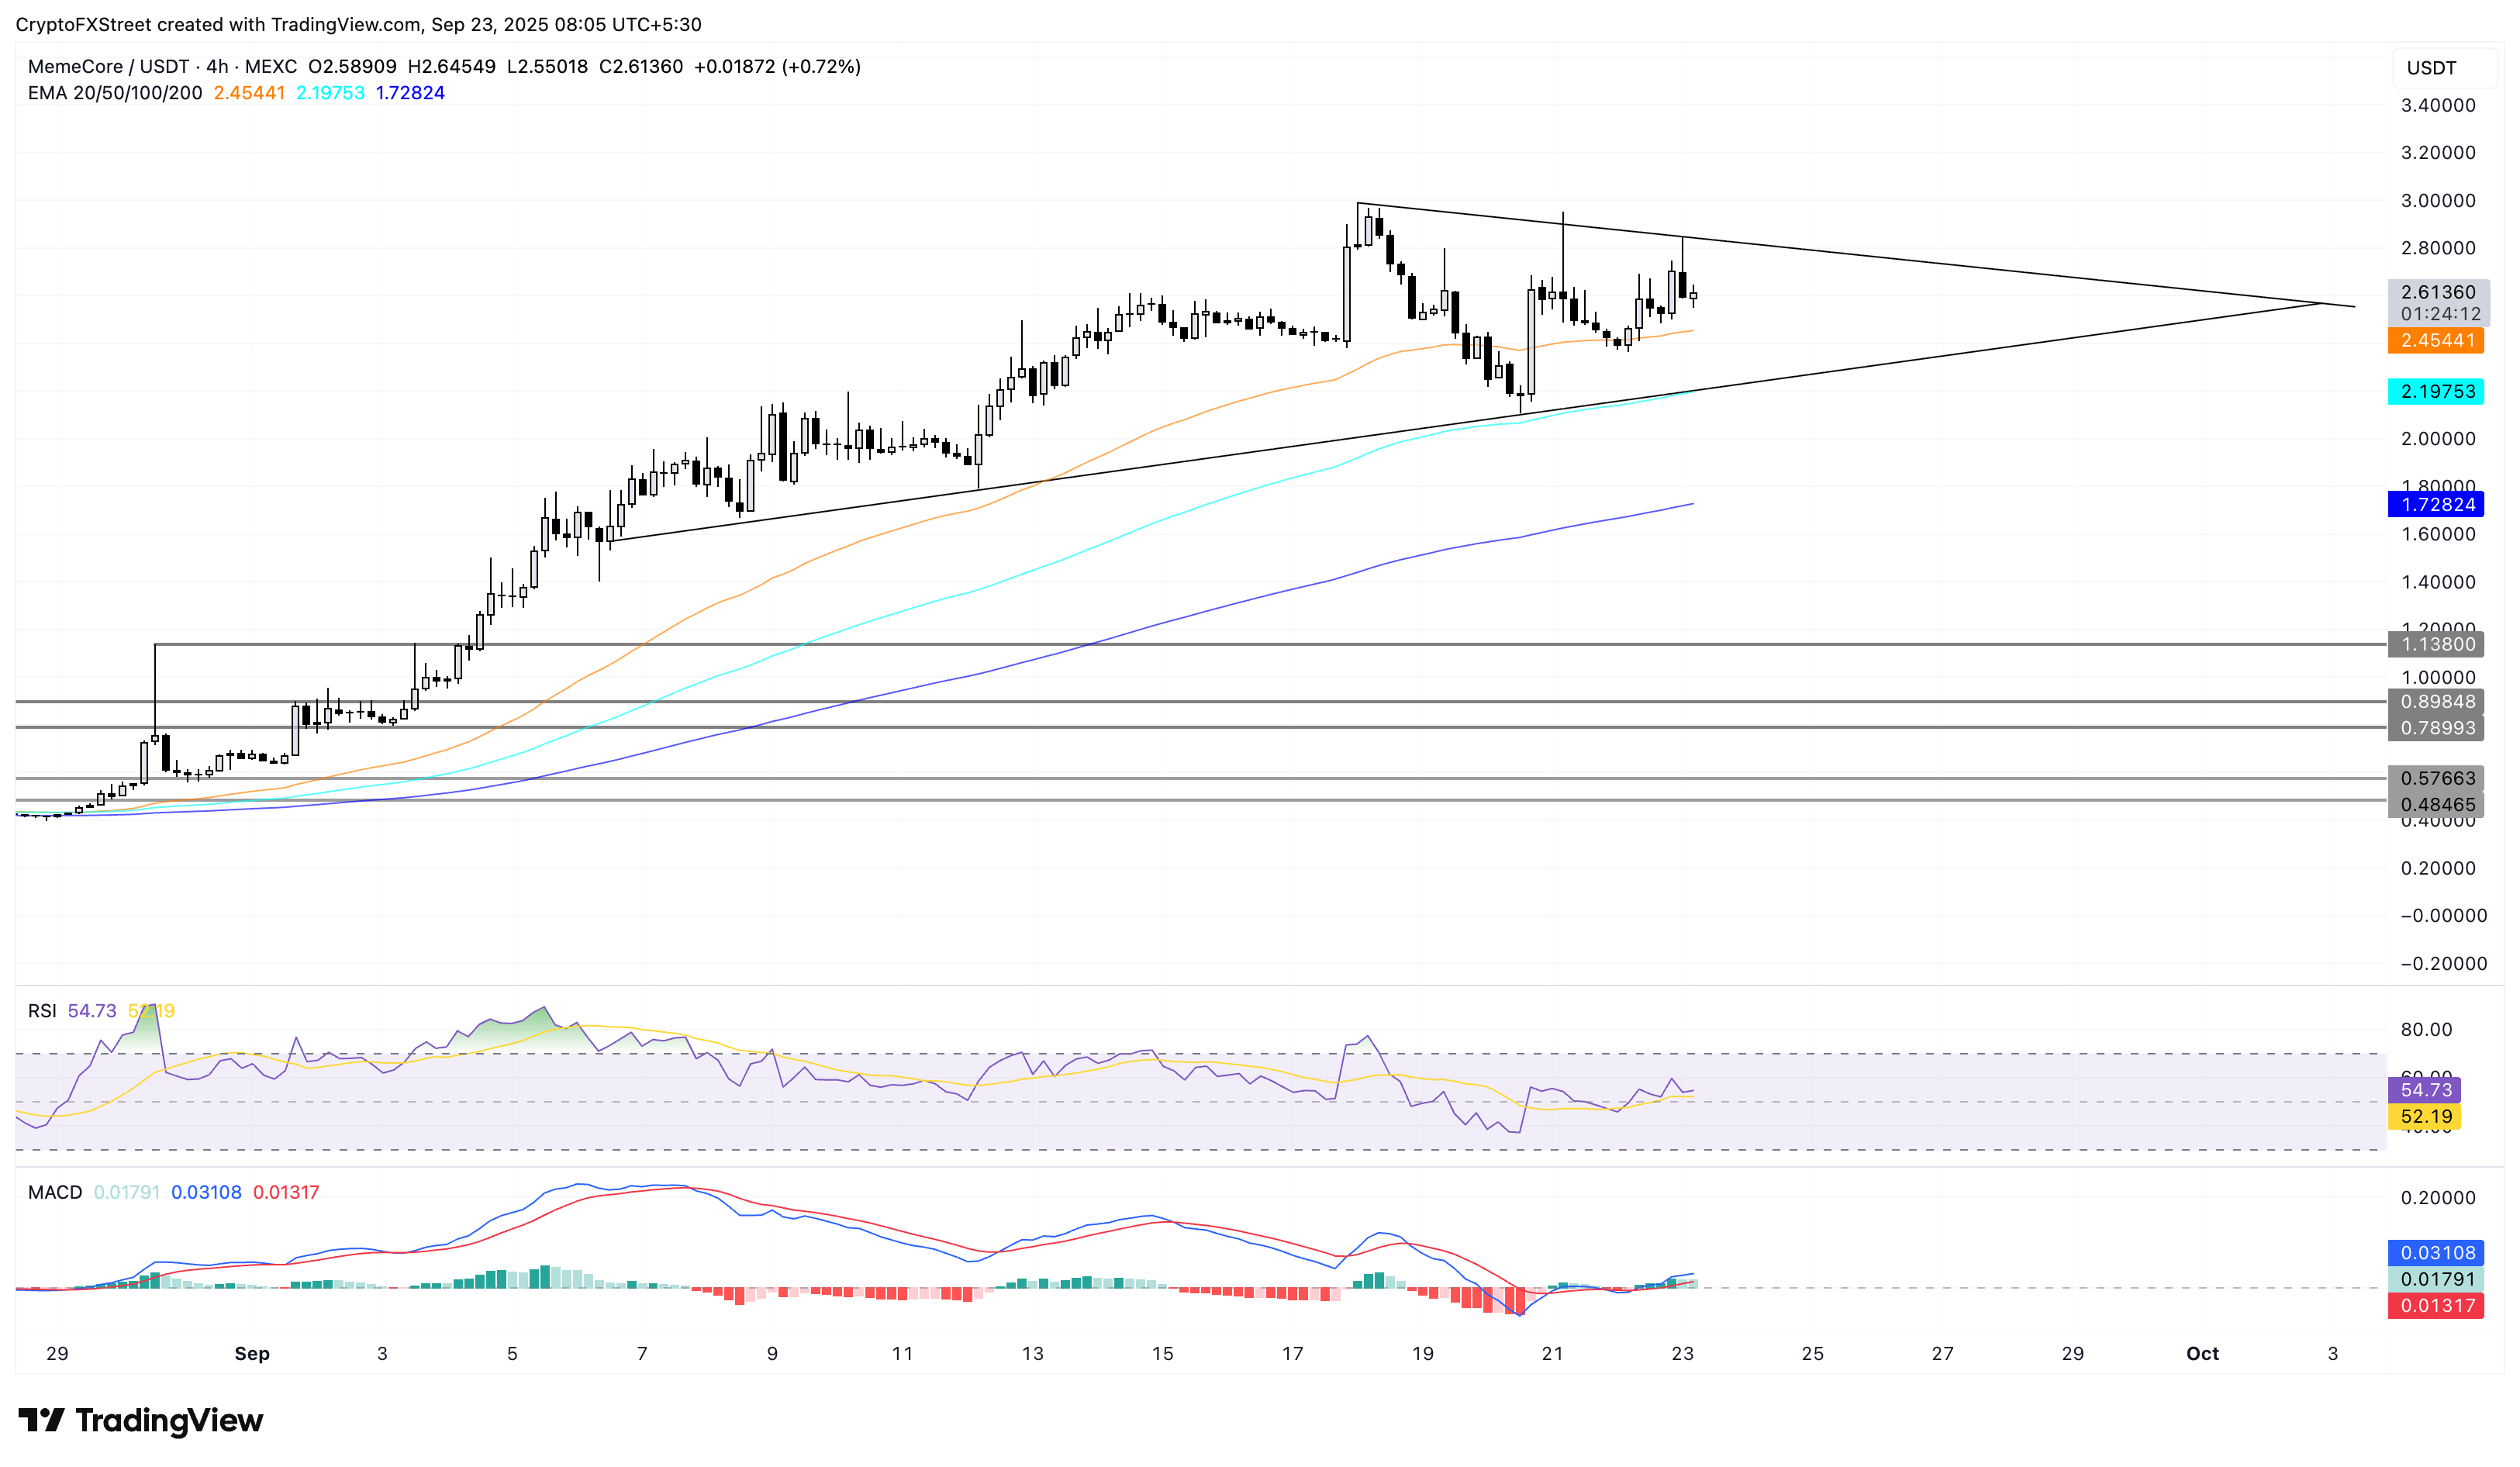
M/USDT 4-hour price chart.
If the momentum holds, a bounce back from the 50-period EMA could propel MemeCore to the triangle pattern’s overhead trendline near $2.80.
Artigos Recomendados


