

Silver Price Analysis: XAG/USD sticks to strong gains above $23.00, eyes 100-day SMA

Fonte Fxstreet
  • Silver gains strong positive traction on Thursday and climbs back closer to the 100-day SMA barrier.
  • The technical setup favours bullish traders and supports prospects for a further appreciating move.
  • A sustained move and acceptance below $22.00 is needed to negate the near-term positive bias.

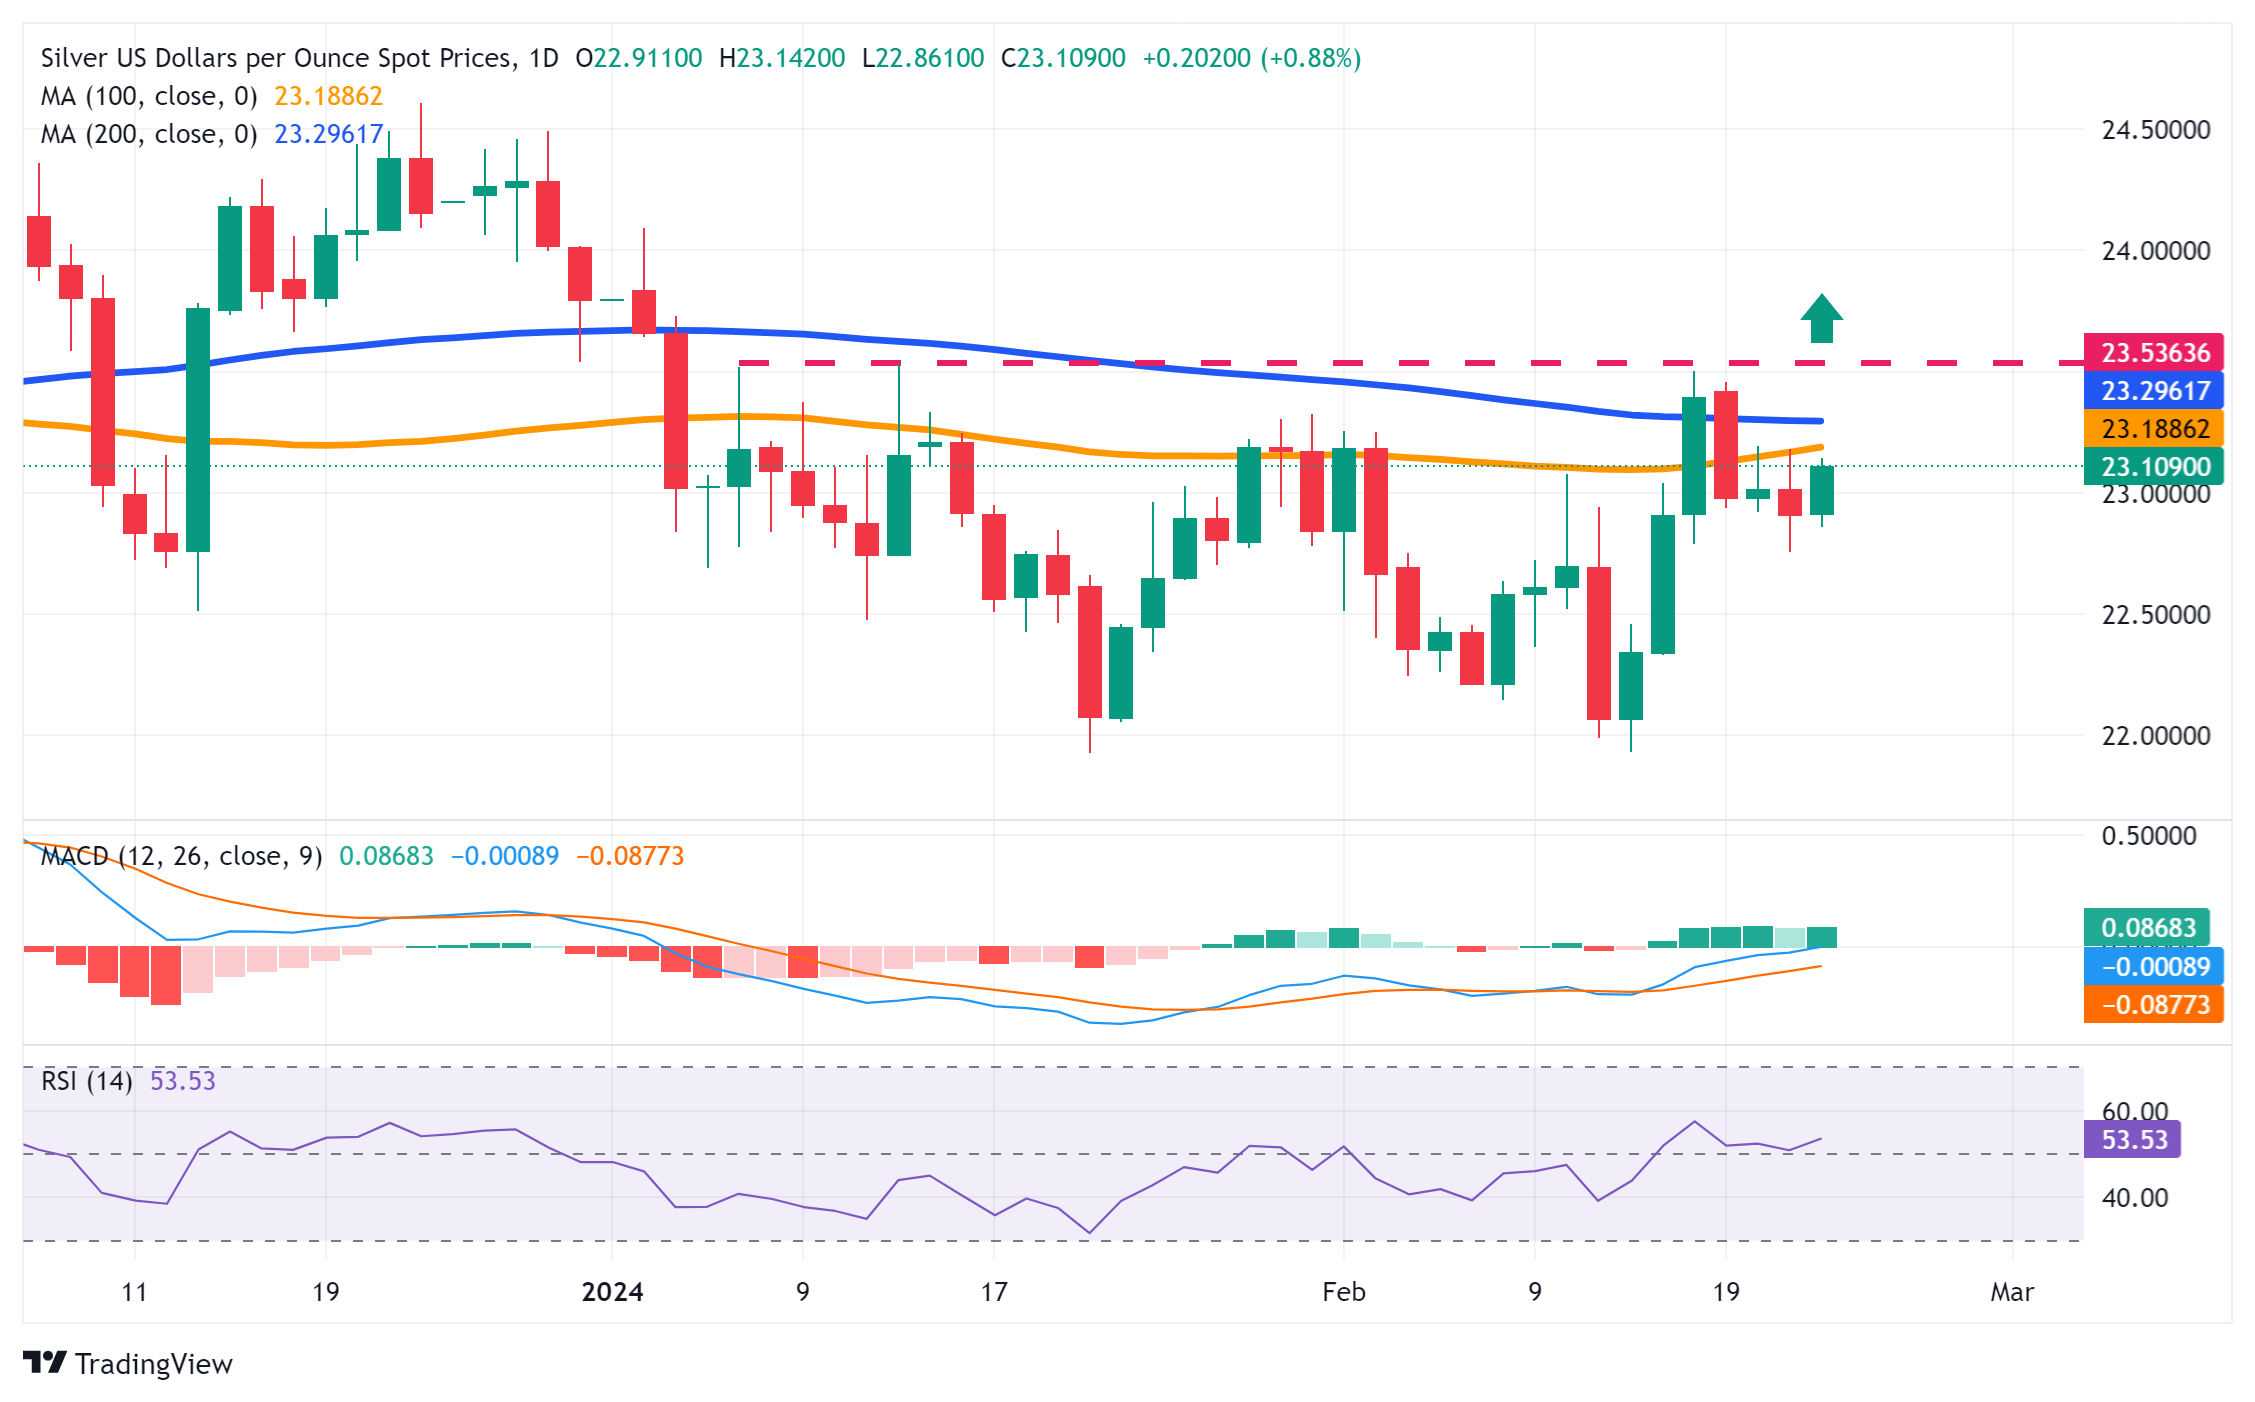
Silver (XAG/USD) builds on the overnight bounce from the 200-hour Simple Moving Average (SMA) support near the $22.75 area, or the weekly low and gains strong positive traction on Thursday. The momentum remains unabated through the first half of the European session and lifts the white metal to the $23.10-$23.15 region.

From a technical perspective, the XAG/USD is currently placed just below the 100-day SMA, which is closely followed by the very important 200-day SMA hurdle near the $23.30-$23.35 zone and the monthly peak, around mid-$23.00 touched last week. A sustained strength beyond the latter will be seen as a fresh trigger for bullish traders and pave the way for the resumption of last week's strong move up from sub-$22.00 levels.

Given that oscillators on the daily chart have just started gaining positive traction, the XAG/USD might then aim to reclaim the $24.00 round figure. The momentum could extend further and allow the white metal to climb towards the next relevant hurdle near the $24.50-$24.60 region en route to the $25.00 psychological mark.

On the flip side, the overnight swing low, around the $22.75 region, now seems to protect the immediate downside ahead of the mid-$22.00s and the $22.30 horizontal support. Some follow-through selling might expose the $22.00 mark. Acceptance below a two-month low, around the $21.90-$21.85 zone touched in January, will be seen as a fresh trigger for bearish traders and make the XAG/USD vulnerable to test the $21.40-$21.35 support.

The subsequent decline has the potential to drag the XAG/USD further below the $21.00 round-figure mark, towards retesting the October monthly swing low near the $20.70-$20.65 region.

Silver daily chart
fxsoriginal

Technical levels to watch


Isenção de responsabilidade: Apenas para fins informativos. O desempenho passado não é indicativo de resultados futuros.
placeholder
Previsão do Preço das Ações da Tesla: As Ações da TSLA Podem Ter um Novo Rally com a Aproximação do Lançamento do Roadster de Nova Geração?A Tesla (TSLA) está prestes a realizar o altamente antecipado lançamento de um novo veículo.A Tesla declarou que a nova geração do Roadster, originalmente prevista para estrear oficialmen
Autor  TradingKey
6 horas atrás
A Tesla (TSLA) está prestes a realizar o altamente antecipado lançamento de um novo veículo.A Tesla declarou que a nova geração do Roadster, originalmente prevista para estrear oficialmen
placeholder
Prévia do Payroll de Setembro nos EUA: Crescimento do Emprego Pode Desacelerar, Como as Ações dos EUA, o Dólar e o Ouro Irão Reagir? Na sexta-feira, 2 de outubro (EDT), os EUA divulgarão seu relatório de empregos não agrícolas (payroll) de setembro, com os mercados focados em saber se o crescimento do emprego conseguir
Autor  TradingKey
6 horas atrás
Na sexta-feira, 2 de outubro (EDT), os EUA divulgarão seu relatório de empregos não agrícolas (payroll) de setembro, com os mercados focados em saber se o crescimento do emprego conseguir
placeholder
Ações do Japão e da Coreia do Sul divergem: Nikkei 225 sobe quase 2%, Kospi cai 0,48% após queda de 18,8% no terceiro trimestreTradingKey - Em 30 de setembro, os mercados de ações do Japão e da Coreia do Sul divergiram, com as ações japonesas se fortalecendo significativamente, enquanto os papéis sul-coreanos registraram leve
Autor  TradingKey
9 Mês 30 Dia Qua
TradingKey - Em 30 de setembro, os mercados de ações do Japão e da Coreia do Sul divergiram, com as ações japonesas se fortalecendo significativamente, enquanto os papéis sul-coreanos registraram leve
placeholder
Previsão do Preço do Ouro: PCE de Agosto dos EUA Iminente, o Preço do Ouro Vai Subir ou Cair no Curto Prazo?TradingKey - Na sessão europeia de 30 de setembro, os preços do ouro (XAUUSD) continuaram a se recuperar após uma forte queda no início desta semana, retomando o patamar de US$ 4.200 no intradiário, c
Autor  TradingKey
9 Mês 30 Dia Qua
TradingKey - Na sessão europeia de 30 de setembro, os preços do ouro (XAUUSD) continuaram a se recuperar após uma forte queda no início desta semana, retomando o patamar de US$ 4.200 no intradiário, c
placeholder
Previsão do Preço do Ouro: Ouro despenca para a mínima de sete semanas, o suporte de US$ 4.100 vai resistir?TradingKey - O ouro à vista (XAUUSD) despencou 4% na segunda-feira, fechando a US$ 4.114,93 por onça-troy, após atingir a mínima intradia de US$ 4.110,80, seu menor nível desde 5 de agosto. No início
Autor  TradingKey
9 Mês 29 Dia Ter
TradingKey - O ouro à vista (XAUUSD) despencou 4% na segunda-feira, fechando a US$ 4.114,93 por onça-troy, após atingir a mínima intradia de US$ 4.110,80, seu menor nível desde 5 de agosto. No início
Produtos relacionados
goTop
quote