


Gold struggles for direction ahead of Fed’s preferred PCE inflation data
- Less hawkish remarks from New York Fed President John Williams lower expectations of an October rate hike.
- The technical outlook remains bearish as XAU/USD stays below its key daily moving averages.
Gold (XAU/USD) trades little changed on Wednesday, consolidating the previous day’s gains after recovering from a seven-week low touched on Monday. A pullback in the US Dollar (USD) and US Treasury yields lends some support to the non-yielding metal as traders brace for the US Personal Consumption Expenditures (PCE) Price Index data, due at 12:30 GMT. At the time of writing, XAU/USD trades around $4,185.
The Greenback and Treasury yields retreat as traders trim bets on another Federal Reserve (Fed) interest-rate hike in October following less hawkish remarks from New York Fed President John Williams on Tuesday.
“With the policy action we took at our September meeting, there is no need for urgency,” Williams said. He added that “if the economy evolves in a manner broadly consistent with my forecast, one further upward adjustment of the federal funds target range may be appropriate late this year to support a timelier return of inflation to target.”
Markets now see a 43% chance of an October rate hike, down from around 70% earlier this week, according to the CME FedWatch Tool.
Economists expect the core PCE Price Index to rise 0.3% MoM in August, up from 0.2% in July. Headline PCE inflation is forecast to rise 0.4% MoM, up from 0.2%. On an annual basis, core and headline inflation are expected to remain unchanged at 3.3% and 3.7%, respectively.
The report will be closely watched for fresh clues about the Fed’s next policy move. A stronger-than-expected reading could revive expectations of an October rate hike, lifting the US Dollar and Treasury yields while putting renewed pressure on Gold. Softer figures could support the precious metal by reinforcing expectations that the Fed can wait before tightening policy again.
The US Dollar Index (DXY), which tracks the Greenback’s value against a basket of six major currencies, trades around 101.20 after reaching 101.61 on Tuesday, its highest level in two months. US Treasury yields also hold multi-year highs despite easing from their recent peaks. The benchmark 10-year yield stands near 5.22%, below the previous day's high of 5.29%, its highest level since 2007.
Gold remains on track to end September in negative territory, pressured by broad US Dollar strength and soaring Treasury yields. Heightened energy-driven inflation risks from the Middle East conflict have pushed traders toward a more hawkish view of the Fed after the central bank raised interest rates by 25 basis points (bps) earlier this month.
However, Middle East crude supplies are showing signs of recovery. Reuters reported that Saudi Arabia resumed tanker loadings at Yanbu after restarting its East-West pipeline, while Goldman Sachs estimated that Gulf Oil exports returned to their 2025 average over the past week. The US also announced that it would offer up to 40 million barrels from its Strategic Petroleum Reserve
These measures pushed Oil prices lower on Tuesday, easing some concerns over energy-driven inflation. Prices recovered modestly on Wednesday as the stalemate between Washington and Tehran kept supply risks in focus. Iranian Foreign Minister Abbas Araqchi is expected to review Washington’s response to Tehran’s seven-day proposal aimed at reopening the Strait of Hormuz.
Technical Analysis: XAU/USD remains vulnerable while below major SMAs
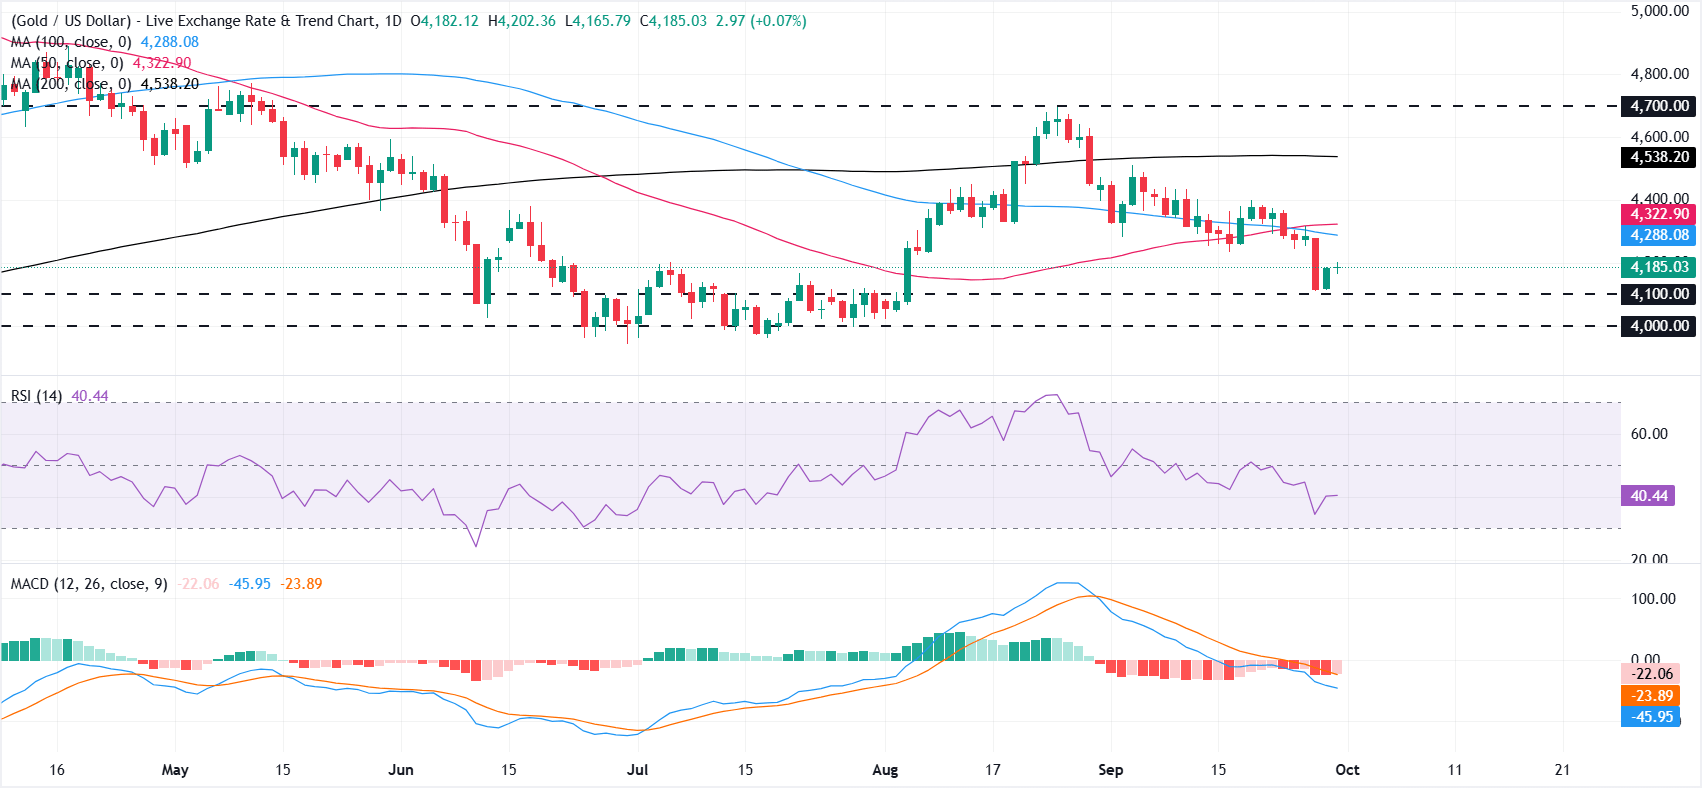
On the daily chart, XAU/USD keeps a bearish near-term bias as spot holds beneath the 50-day, 100-day and 200-day Simple Moving Averages (SMAs) clustered between roughly $4,288 and $4,538. The relative strength index (RSI) at 40 sits below its midline, while the Moving Average Convergence Divergence (MACD) indicator remains in negative territory, both hinting that downside momentum still outweighs recovery attempts despite the recent stabilization off the $4,100 region.
On the topside, initial resistance emerges at the 100-day SMA at $4,288, followed by the 50-day SMA at $4,322, with the broader bearish structure reinforced by the 200-day SMA near $4,538 and a horizontal barrier at $4,700. On the downside, immediate support is seen at the horizontal level of $4,100, ahead of a deeper floor around $4,000, where a break would open the way for an extension of the prevailing corrective phase.
(The technical analysis of this story was written with the help of an AI tool. Know more.)
Artigos Recomendados


