


Bitcoin and Gold Outlook: BTC recovers $84K, XAU slips amid softer US PCE
- Bitcoin reclaims its position above $84,000 as crypto prices broadly recover on Wednesday.
- Gold trims gains below $4,200 as focus remains on the $4,100 demand area.
- US PCE inflation data in August was below market expectations.
Bitcoin (BTC) gains traction, rising above $84,000 on Wednesday as buyers return after softer-than-expected United States (US) inflation data. The Crypto King marks a second straight day of gradual recovery, building on the demand area between $82,000 and $83,000.
Gold (XAU/USD), meanwhile, slides toward $4,100 after being rejected at the daily high of $4,219. The metal has steadily declined since August highs at $4,697, undermining investor interest.
Looking down, the region between $4,000 and $4,100 is worth watching as dip buyers are likely to take on more risk in the range, anticipating another rebound attempt. That said, traders should temper expectations if Gold loses that area as support, opening the door to extended losses toward the next psychological levels at $3,900 and $3,800, respectively.
US PCE inflation cools in August
The US Bureau of Economic Analysis (BEA) data released on Wednesday on the Personal Consumption Expenditures (PCE) Price Index shows that inflation held steady at 3.4% annually in August. This latest figure came below consensus forecasts of 3.7%, with July’s reading also revised down to 3.4% from the previously reported 3.7%.
The core PCE Price Index, which excludes volatile food and energy prices, remained unchanged at 3% per annum, below the market consensus of 3.3%. At the same time, July’s figure was revised to 3% from 3.3%.
On a monthly basis, the PCE Price Index and the core PCE Price Index increased by 0.3% and 0.2%, respectively. Additional data showed a modest 0.2% monthly increase in Personal Income for August, while Personal Spending rose a robust 0.9% over the same period.
Gold came under renewed selling pressure after the PCE Price Index release, with prices falling toward $4,100 from daily highs above $4,200. However, Bitcoin appeared to be edging higher after reclaiming the $84,000 level. A daily close above this level could reinforce the bullish trend and encourage investors to take on more risk.
Technical analysis: Bitcoin advances as bulls swing back
Bitcoin trades above $84,000, maintaining a bullish near-term bias as price extends well above the 50-day, 100-day, and 200-day Exponential Moving Averages (EMAs) at $77,827, $74,315, and $75,021, respectively. The SuperTrend indicator at $78,352 sits comfortably below the market, reinforcing a supportive backdrop, while the Relative Strength Index (RSI) around 63 shows firm but not extreme bullish momentum.
The Moving Average Convergence Divergence (MACD) indicator, however, remains slightly negative, hinting at waning upside pressure and the risk of consolidation after the latest advance.
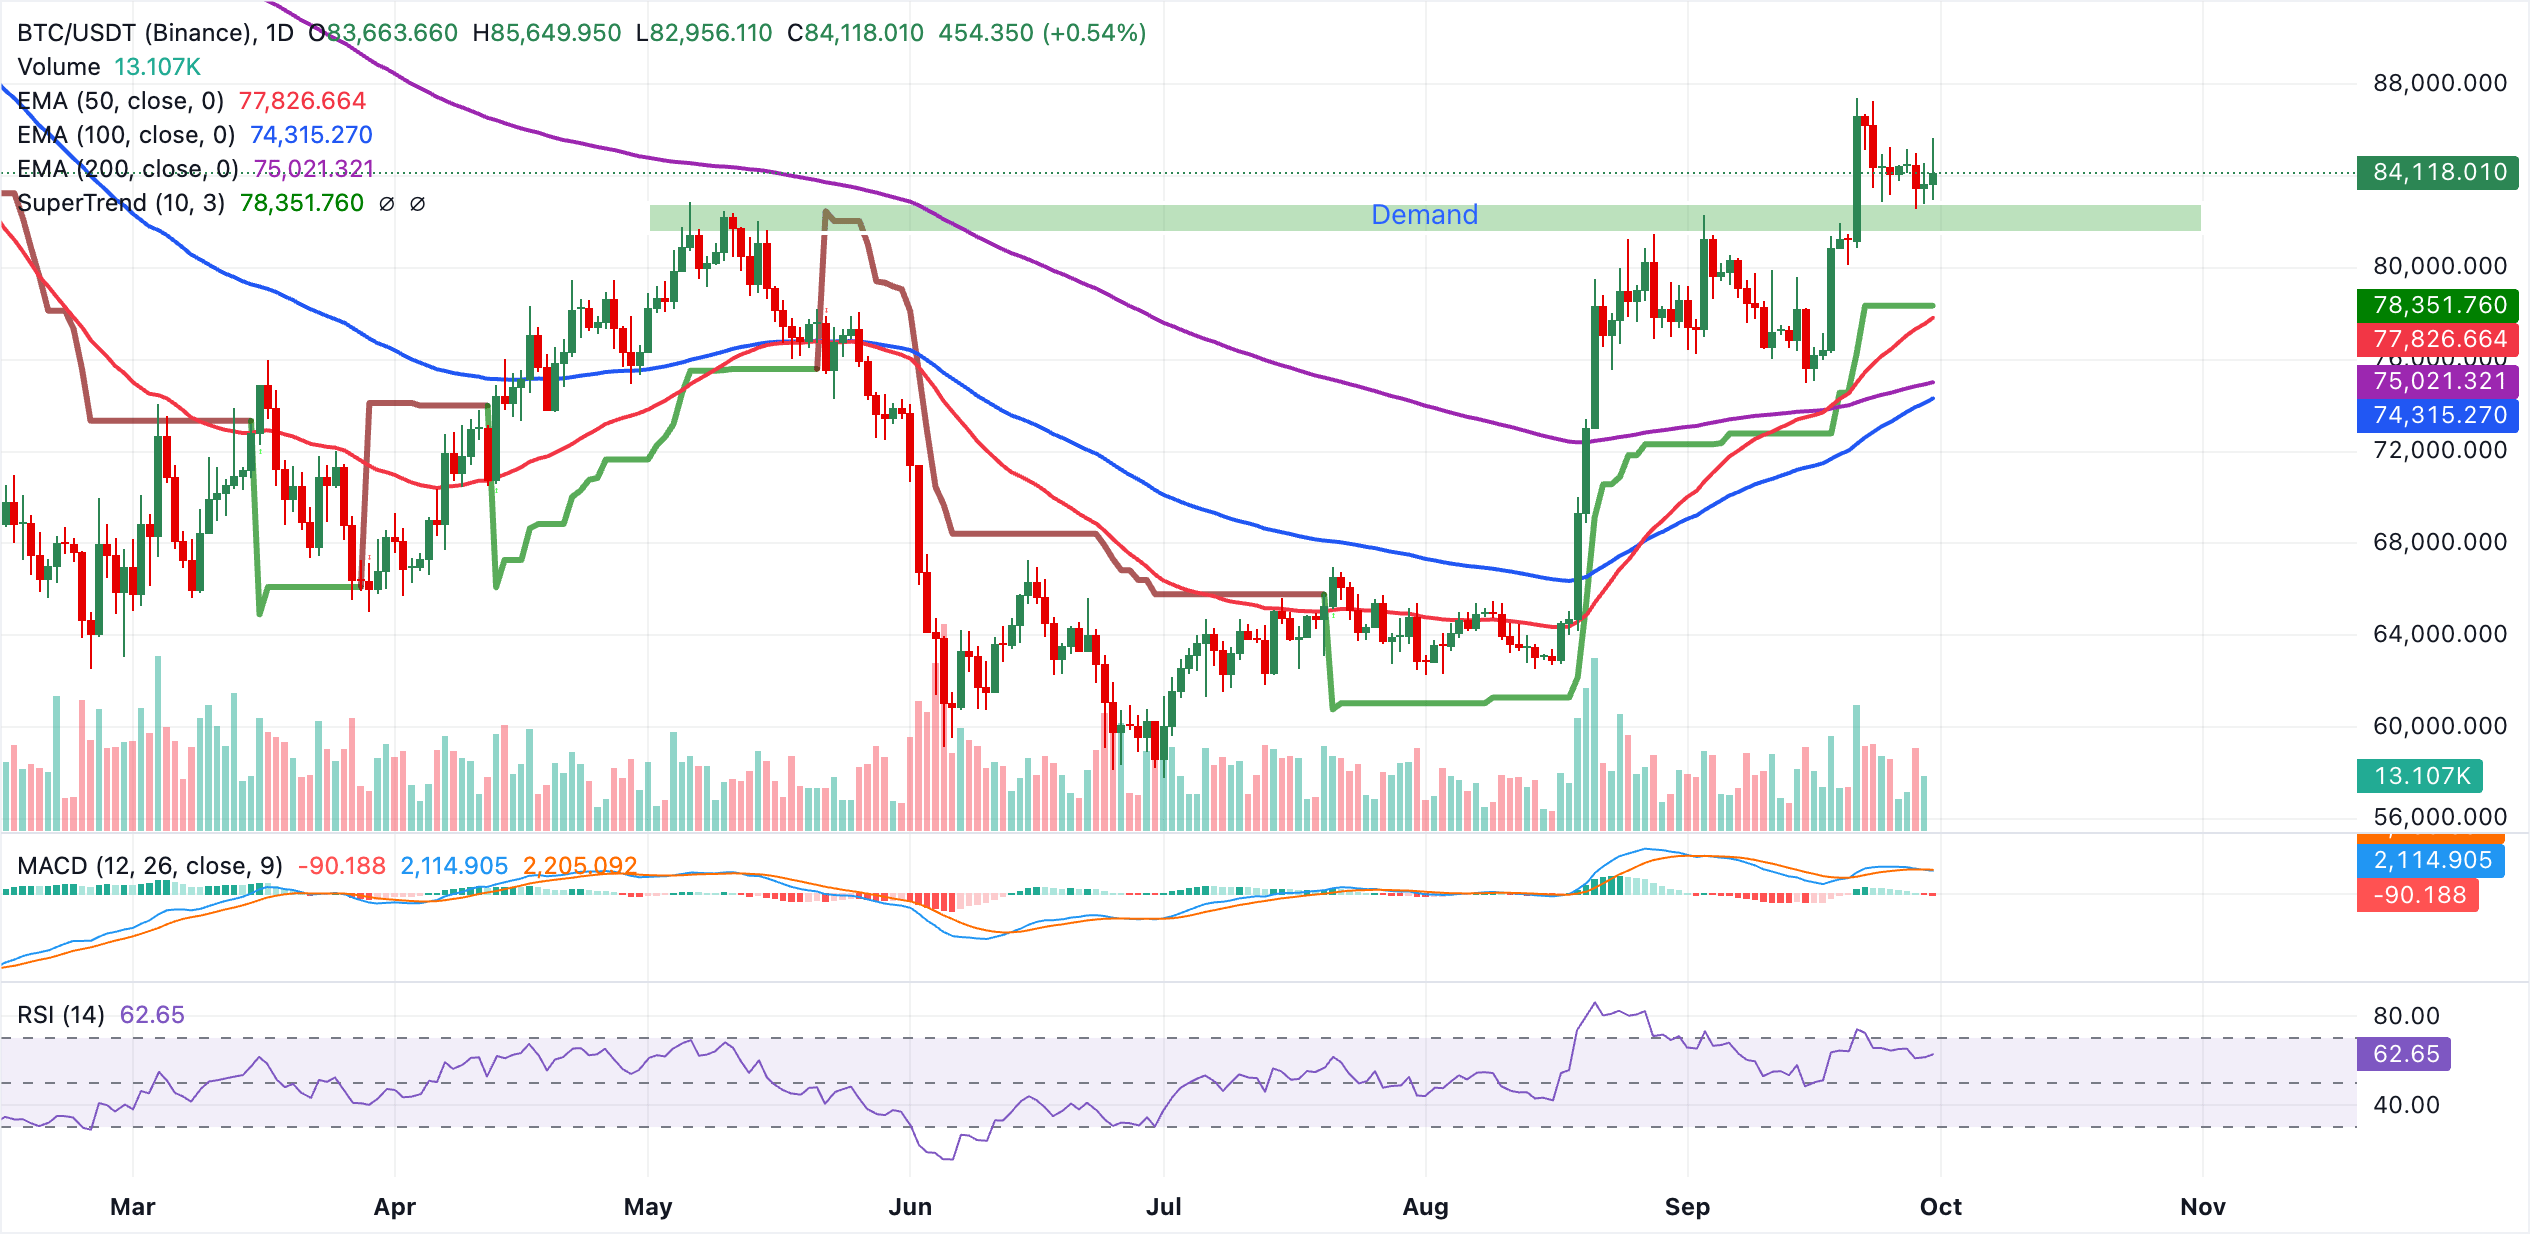
Initial support appears at the SuperTrend line near $78,352, closely followed by the 50-day EMA at $77,827, which should act as the first demand zone on any pullback. Below that, the 200-day EMA at $75,021 and the 100-day EMA at $74,315 form a deeper structural floor, where a stronger correction would likely pause.
As long as BTC holds above these clustered moving averages, the broader bias stays constructive, with any dips toward the $78,000-$76,000 area likely attracting buyers rather than signaling a trend reversal.
Gold technical analysis: XAU/USD trades under pressure
Gold edges lower and trades at $4,155, maintaining a bearish near-term bias as it holds below a dense band of moving-average resistance. The 200-day EMA at $4,313, the 50-day EMA at $4,316 and the 100-day EMA at $4,345 all sit overhead, suggesting that recent rebounds remain corrective within a broader downside phase.
The SuperTrend indicator at $4,435 and the downward resistance trendline’s break level near $4,472 further reinforce the impression that the pair is capped, while the MACD stays negative and the RSI trades below the midline around 39, hinting at persistent selling pressure rather than a full-fledged recovery.
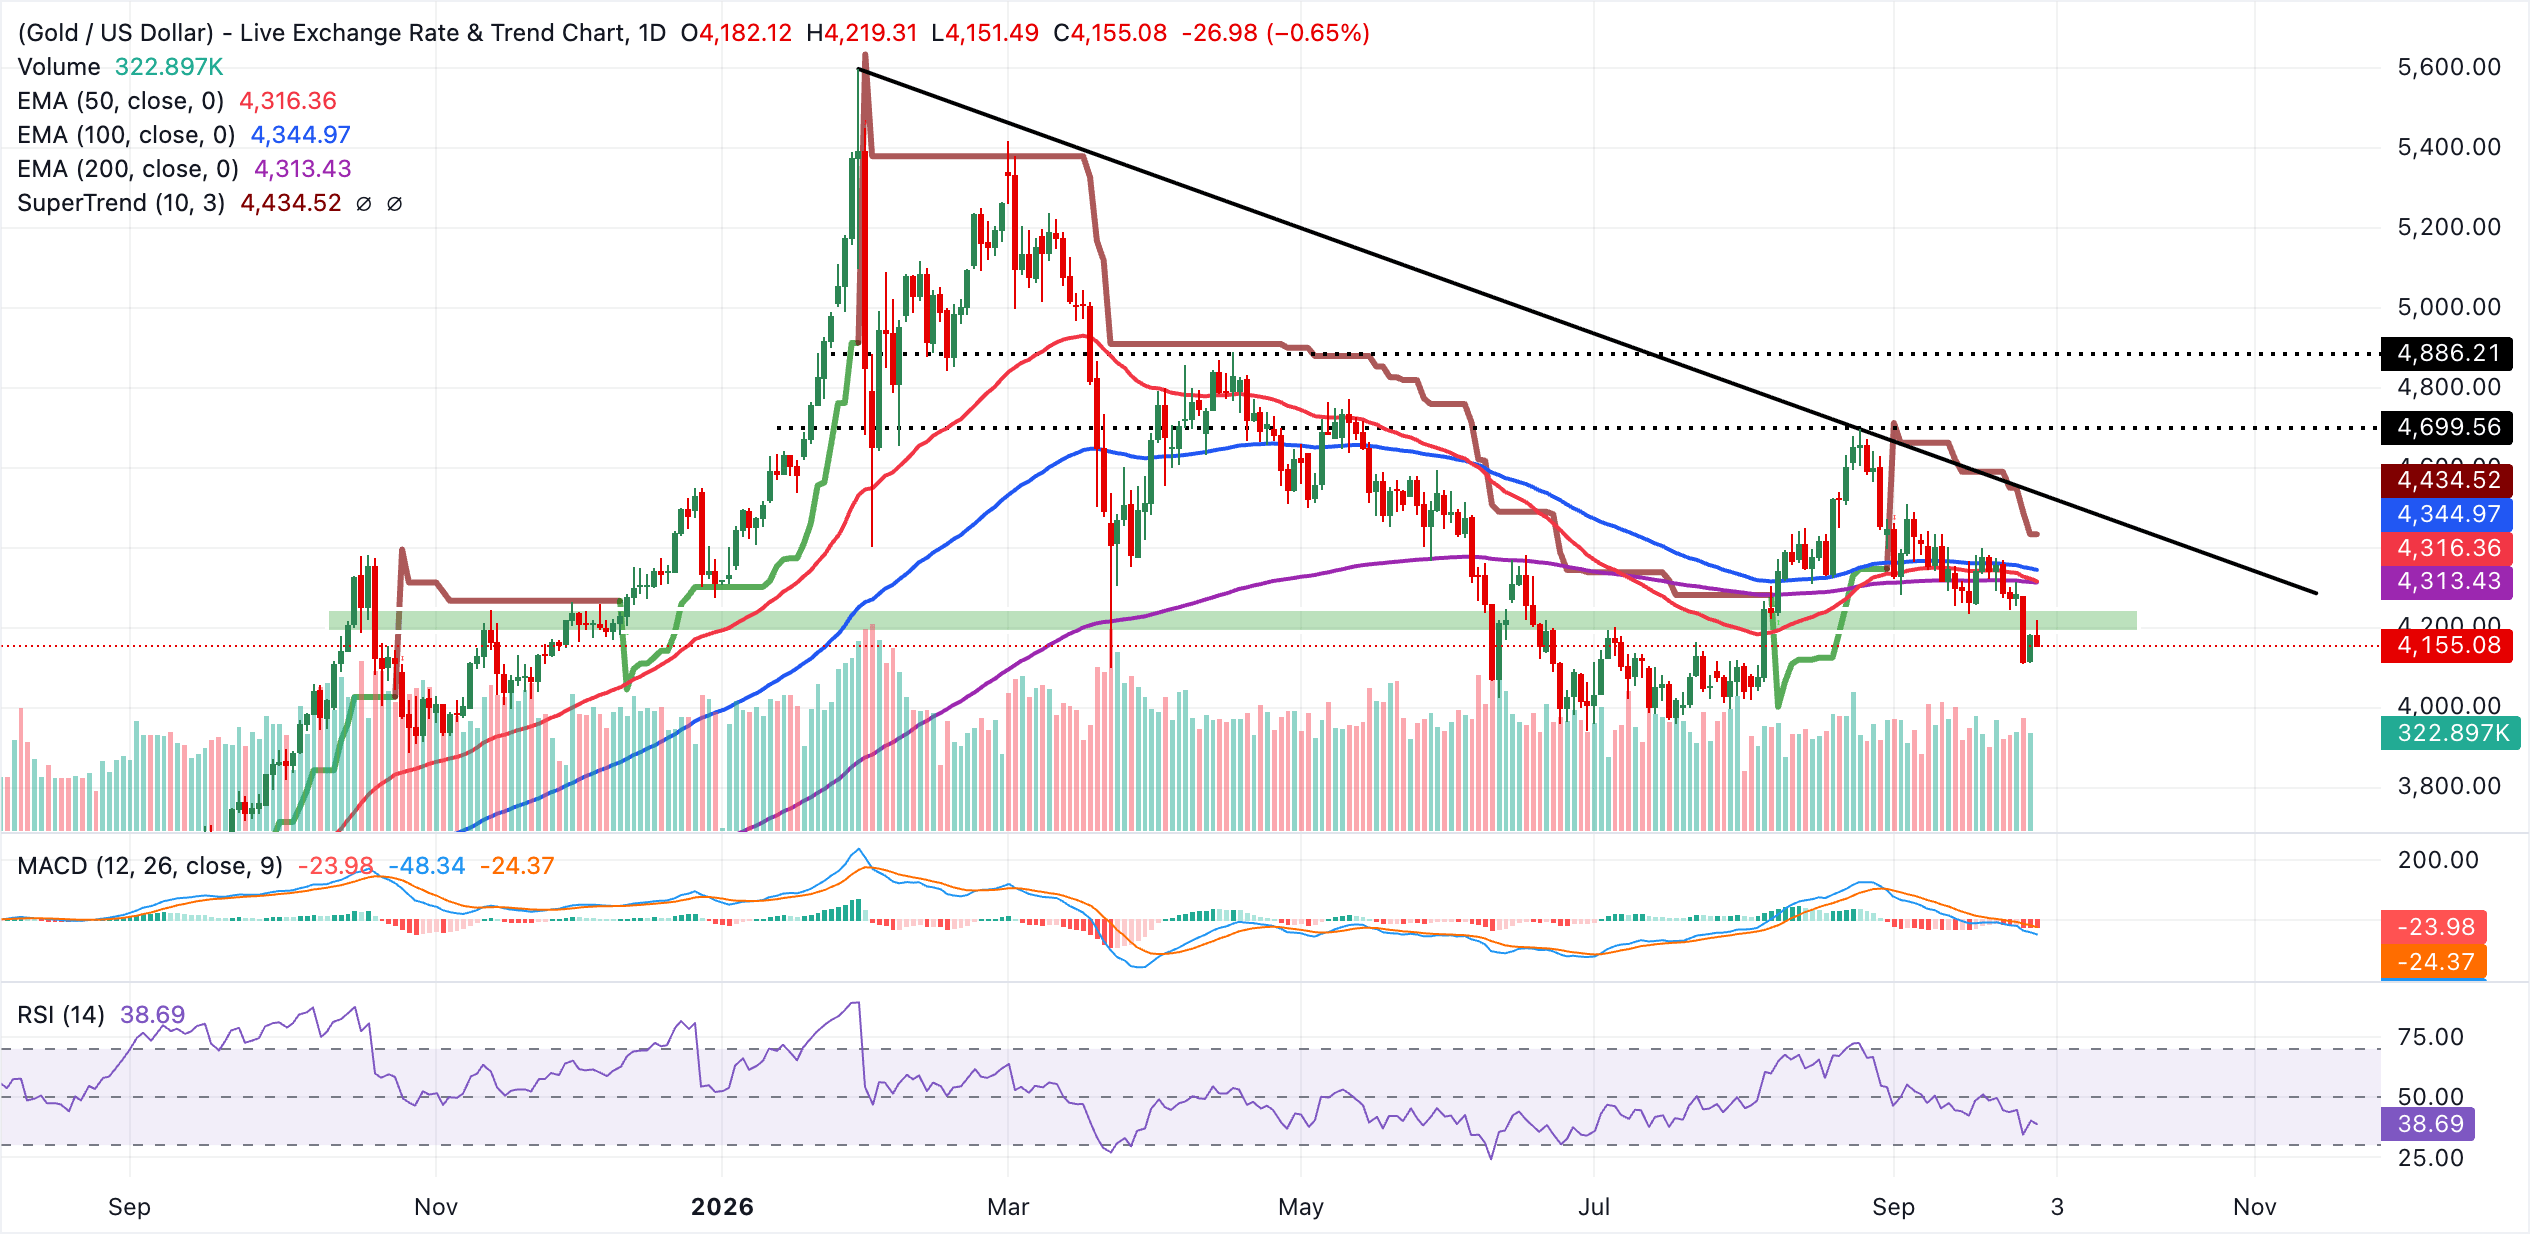
Initial resistance clusters in the $4,313–4,345 region, where the 200-day, 50-day, and 100-day EMAs converge and define the first hurdle for any bullish attempt. A daily close above this band would open the way toward the SuperTrend barrier at $4,435, ahead of the more strategic resistance aligned with the downward trendline break price near $4,472.
With no clear structural support defined by the current indicators set below spot, downside moves would likely be driven by momentum rather than well-tested floors, leaving the metal vulnerable to further weakness while it trades under these key reference levels.
(The technical analysis of this story was written with the help of an AI tool. Know more.)
Bitcoin, altcoins, stablecoins FAQs
Bitcoin is the largest cryptocurrency by market capitalization, a virtual currency designed to serve as money. This form of payment cannot be controlled by any one person, group, or entity, which eliminates the need for third-party participation during financial transactions.
Altcoins are any cryptocurrency apart from Bitcoin, but some also regard Ethereum as a non-altcoin because it is from these two cryptocurrencies that forking happens. If this is true, then Litecoin is the first altcoin, forked from the Bitcoin protocol and, therefore, an “improved” version of it.
Stablecoins are cryptocurrencies designed to have a stable price, with their value backed by a reserve of the asset it represents. To achieve this, the value of any one stablecoin is pegged to a commodity or financial instrument, such as the US Dollar (USD), with its supply regulated by an algorithm or demand. The main goal of stablecoins is to provide an on/off-ramp for investors willing to trade and invest in cryptocurrencies. Stablecoins also allow investors to store value since cryptocurrencies, in general, are subject to volatility.
Bitcoin dominance is the ratio of Bitcoin's market capitalization to the total market capitalization of all cryptocurrencies combined. It provides a clear picture of Bitcoin’s interest among investors. A high BTC dominance typically happens before and during a bull run, in which investors resort to investing in relatively stable and high market capitalization cryptocurrency like Bitcoin. A drop in BTC dominance usually means that investors are moving their capital and/or profits to altcoins in a quest for higher returns, which usually triggers an explosion of altcoin rallies.
Artigos Recomendados


