AUD/JPY Price Forecast: Slips below 94.00 as Middle East de-escalation lifts safe havens

Fonte Fxstreet
  • AUD/JPY down 0.06% after failing to clear May 14 peak at 95.56.
  • RSI turns slightly lower; mixed signals keep traders focused on price structure.
  • Key support at 93.40/56; break below could expose 93.00 and 92.63 Senkou Span B.

The AUD/JPY retreats amid a risk-on mood, spurred by the de-escalation of the Middle East conflict. This pushed safe-haven currencies, except for the US Dollar, higher during Tuesday’s session, to the detriment of the Australian Dollar. At the time of writing, the cross-pair trades below the 94.00 figure, and is down 0.06%.

AUD/JPY Price Forecast: Technical Analysis

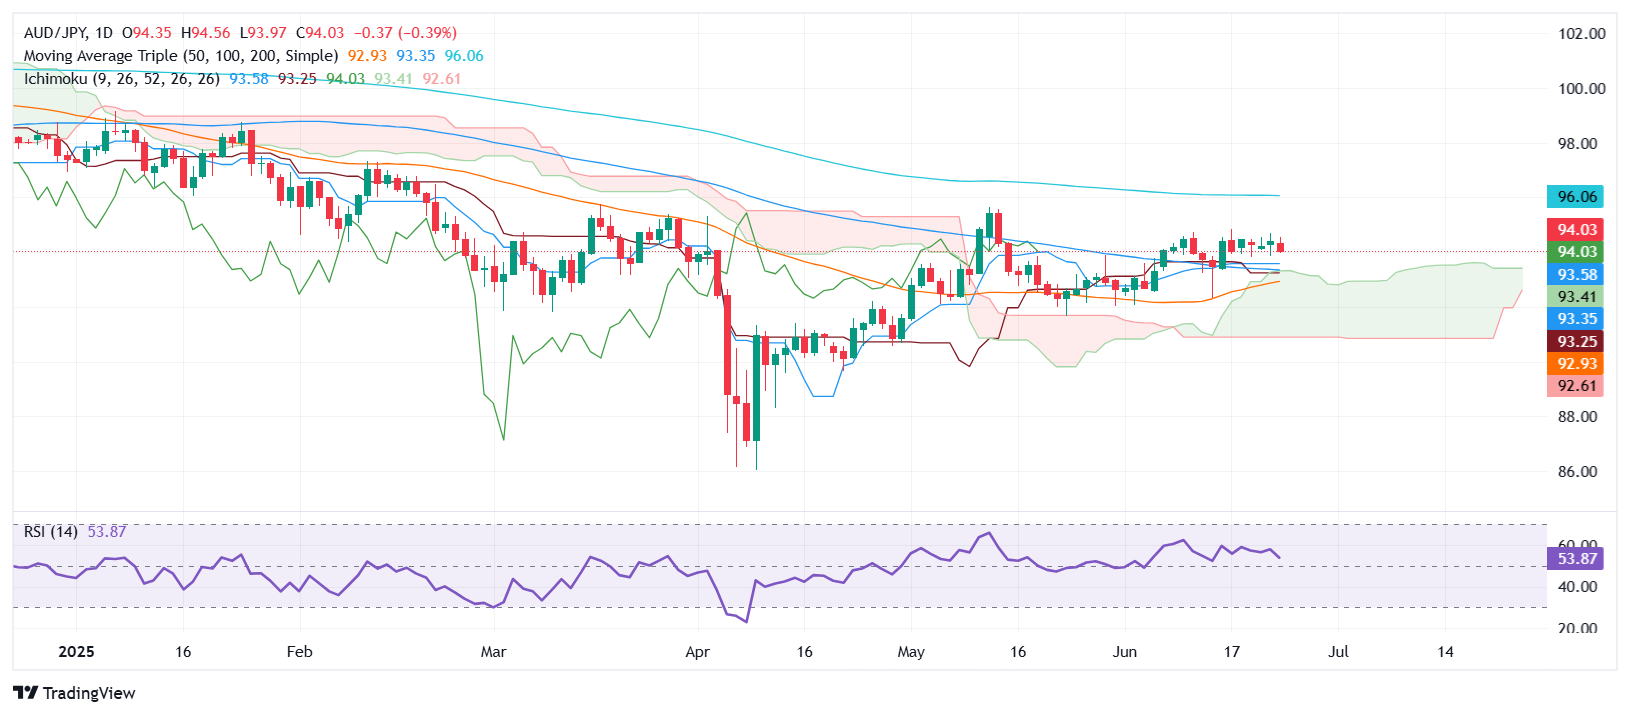
The trend remains down in the AUD/JPY cross-pair. Even though the Australian Dollar showed signs of strength, its failure to clear the May 14 peak of 95.56 pushed the pair below the 94.00 figure, although it meanders around the latter.

In the short term, the Relative Strength Index (RSI) aims slightly lower, though it remains bullish. The mixed readings leave us as traders focused on price action.

Hence, if AUD/JPY clears the confluence of the Tenkan-sen and the Senkou Span A at around 93.40/56, look for a test of the Kijun-sen at 93.23. On further weakness, 93.00 will be exposed, followed by the Senkou Span B at 92.63.

Conversely, if AUD/JPY rises past 94.00, the first resistance would be 95.00, followed by 95.56, the May 14 high. Above this level, the next zone of interest will be the 96.00 figure.

AUD/JPY Price Chart – Daily
Australian Dollar PRICE Today

The table below shows the percentage change of Australian Dollar (AUD) against listed major currencies today. Australian Dollar was the strongest against the Swiss Franc.

USD EUR GBP JPY CAD AUD NZD CHF
USD 0.00% -0.00% 0.00% 0.05% 0.00% -0.02% -0.04%
EUR -0.01% -0.00% -0.05% 0.03% -0.02% -0.07% -0.04%
GBP 0.00% 0.00% -0.02% 0.02% 0.00% -0.07% -0.01%
JPY 0.00% 0.05% 0.02% 0.05% 0.04% 0.00% 0.04%
CAD -0.05% -0.03% -0.02% -0.05% 0.00% 0.02% -0.05%
AUD 0.00% 0.02% -0.01% -0.04% -0.01% -0.11% 0.02%
NZD 0.02% 0.07% 0.07% -0.01% -0.02% 0.11% 0.05%
CHF 0.04% 0.04% 0.00% -0.04% 0.05% -0.02% -0.05%

The heat map shows percentage changes of major currencies against each other. The base currency is picked from the left column, while the quote currency is picked from the top row. For example, if you pick the Australian Dollar from the left column and move along the horizontal line to the US Dollar, the percentage change displayed in the box will represent AUD (base)/USD (quote).

Isenção de responsabilidade: Apenas para fins informativos. O desempenho passado não é indicativo de resultados futuros.
placeholder
O ouro retoma impulso positivo diante das apostas em cortes de juros pelo Fed e da demanda por ativos de refúgio seguro.O ouro (XAU/USD) atrai alguns compradores em quedas próximo da área de US$ 3.620 durante a sessão asiática desta quarta-feira e, por enquanto, parece ter interrompido seu recuo desde o recorde histórico alcançado no dia anterior.
Autor  FXStreet
12 horas atrás
O ouro (XAU/USD) atrai alguns compradores em quedas próximo da área de US$ 3.620 durante a sessão asiática desta quarta-feira e, por enquanto, parece ter interrompido seu recuo desde o recorde histórico alcançado no dia anterior.
placeholder
Previsão de Preço do Stellar: WisdomTree Prime aproveita a rede Stellar, CEO Denelle Dixon classifica como um marcoO preço do Stellar (XLM) está sendo negociado em torno de US$ 0,37 dentro de um padrão de cunha descendente no momento da escrita desta quarta-feira, indicando um potencial rompimento altista nos próximos dias.
Autor  FXStreet
13 horas atrás
O preço do Stellar (XLM) está sendo negociado em torno de US$ 0,37 dentro de um padrão de cunha descendente no momento da escrita desta quarta-feira, indicando um potencial rompimento altista nos próximos dias.
placeholder
VISC11 lucra R$ 20,3 milhões e projeta estabilidade; XPML11 vende 9 shoppings por R$ 1,6 bi para quitar dívidaO fundo de investimento imobiliário Vinci Shopping Centers (VISC11) divulgou seu relatório gerencial referente ao mês de agosto de 2025, informando um resultado total de R$ 20,37 milhões.
Autor  Pedro Augusto Prazeres
17 horas atrás
O fundo de investimento imobiliário Vinci Shopping Centers (VISC11) divulgou seu relatório gerencial referente ao mês de agosto de 2025, informando um resultado total de R$ 20,37 milhões.
placeholder
Ações de Marfrig (MRFG3) e BRF (BRFS3) disparam com data para conclusão de fusãoAs ações da Marfrig (MRFG3) e da BRF (BRFS3) registraram fortes altas no pregão desta terça-feira (9/9), após as companhias anunciarem a data para a conclusão de sua fusão e os detalhes finais da incorporação.
Autor  Pedro Augusto Prazeres
17 horas atrás
As ações da Marfrig (MRFG3) e da BRF (BRFS3) registraram fortes altas no pregão desta terça-feira (9/9), após as companhias anunciarem a data para a conclusão de sua fusão e os detalhes finais da incorporação.
placeholder
ETFs de Ethereum têm saída de US$ 1 bilhão; primeiro ETF de memecoin dos EUA pode estreiar nesta semanaOs fundos de índice (ETFs) de Ether (ETH) à vista registraram mais de US$ 1,04 bilhão em saídas líquidas ao longo de seis dias consecutivos de negociação, em um movimento que reflete o recuo dos investidores diante da crescente incerteza macroeconômica.
Autor  Pedro Augusto Prazeres
17 horas atrás
Os fundos de índice (ETFs) de Ether (ETH) à vista registraram mais de US$ 1,04 bilhão em saídas líquidas ao longo de seis dias consecutivos de negociação, em um movimento que reflete o recuo dos investidores diante da crescente incerteza macroeconômica.
Produtos relacionados
goTop
quote