NZD/USD Price Forecast: Holds position above nine-day EMA near 0.6200

Fonte Fxstreet
  • NZD/USD may appreciate as daily chart analysis indicates a bullish bias.
  • The upper boundary of the ascending channel at 0.6280 appears as the immediate resistance.
  • The pair may find the support around the nine-day EMA at 0.6189 level.

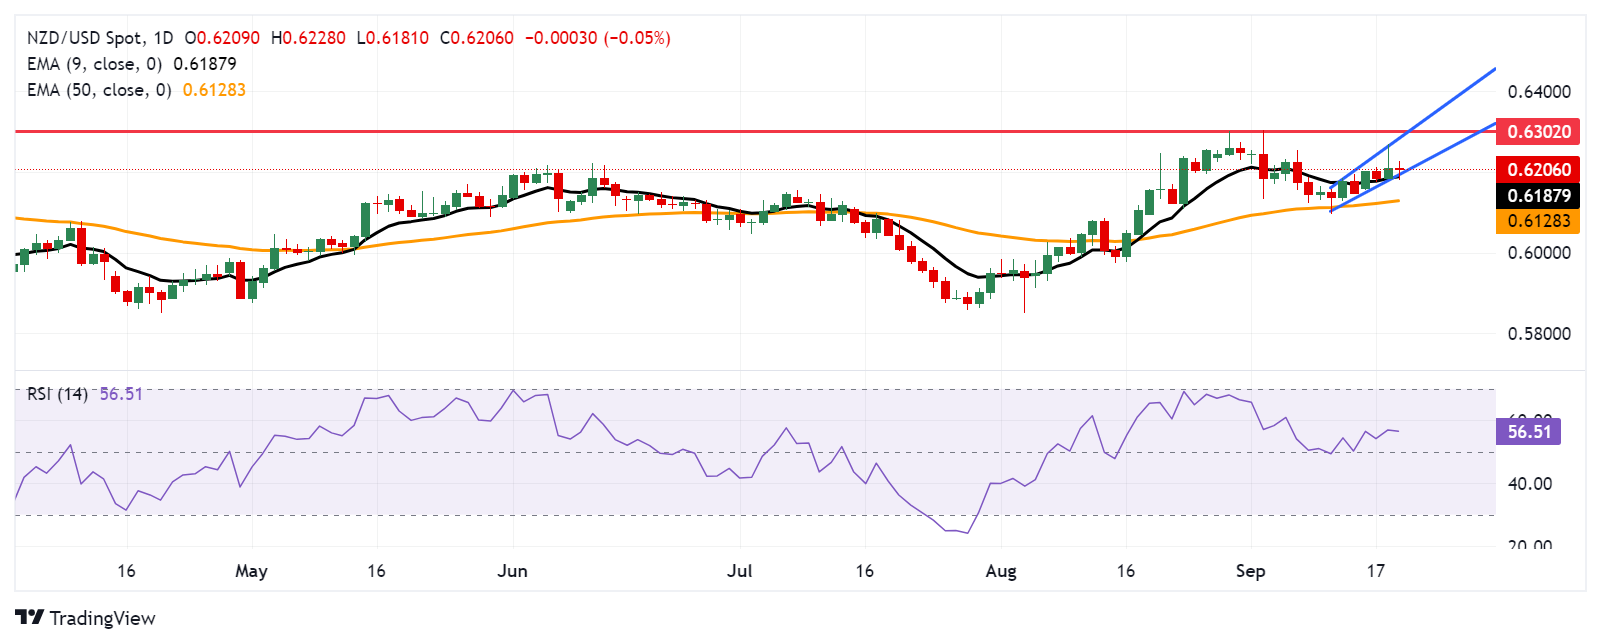
NZD/USD trades around 0.6210 during the Asian session on Thursday. On the daily chart, the pair is consolidating within an ascending channel pattern, indicating a bullish bias. However, a break below the lower boundary of the channel could diminish this bullish sentiment.

The 14-day Relative Strength Index (RSI) remains above the 50 level, confirming the ongoing bullish trend. Additionally, the nine-day Exponential Moving Average (EMA) is above the 50-day EMA, suggesting that the NZD/USD pair is experiencing short-term upward momentum and is likely to continue its rise.

On the upside, the NZD/USD pair may test the upper boundary of the ascending channel at the 0.6280 level, followed by the eight-month high of 0.6302 recorded on September 3. A break above this high could drive the pair toward the psychological level of 0.6300.

On the downside, the NZD/USD pair might test immediate support around the nine-day EMA at the 0.6189 level, which is near the lower boundary of the ascending channel. A break below this channel could weaken the bullish sentiment and put pressure on the pair to approach the 50-day EMA at 0.6128.

NZD/USD: Daily Chart
New Zealand Dollar PRICE Today

The table below shows the percentage change of New Zealand Dollar (NZD) against listed major currencies today. New Zealand Dollar was the strongest against the Japanese Yen.

  USD EUR GBP JPY CAD AUD NZD CHF
USD   0.01% 0.07% 0.63% -0.02% -0.34% 0.07% 0.32%
EUR -0.01%   0.05% 0.62% -0.03% -0.34% 0.05% 0.31%
GBP -0.07% -0.05%   0.57% -0.09% -0.42% -0.00% 0.24%
JPY -0.63% -0.62% -0.57%   -0.62% -0.96% -0.59% -0.32%
CAD 0.02% 0.03% 0.09% 0.62%   -0.33% 0.09% 0.33%
AUD 0.34% 0.34% 0.42% 0.96% 0.33%   0.41% 0.65%
NZD -0.07% -0.05% 0.00% 0.59% -0.09% -0.41%   0.26%
CHF -0.32% -0.31% -0.24% 0.32% -0.33% -0.65% -0.26%  

The heat map shows percentage changes of major currencies against each other. The base currency is picked from the left column, while the quote currency is picked from the top row. For example, if you pick the New Zealand Dollar from the left column and move along the horizontal line to the US Dollar, the percentage change displayed in the box will represent NZD (base)/USD (quote).

Isenção de responsabilidade: Apenas para fins informativos. O desempenho passado não é indicativo de resultados futuros.
placeholder
Ouro atinge máxima de mais de uma semana em meio a apostas crescentes de corte de juros pelo Fed e riscos geopolíticosO ouro (XAU/USD) atinge o nível mais alto em uma semana e meia durante a sessão asiática desta terça-feira e busca dar continuidade ao forte rali de quase 2% do dia anterior, impulsionado pelas expectativas dovish em relação ao Federal Reserve (Fed) dos EUA.
Autor  FXStreet
15 horas atrás
O ouro (XAU/USD) atinge o nível mais alto em uma semana e meia durante a sessão asiática desta terça-feira e busca dar continuidade ao forte rali de quase 2% do dia anterior, impulsionado pelas expectativas dovish em relação ao Federal Reserve (Fed) dos EUA.
placeholder
TRBL11 tem prejuízo contábil mas mantém dividendo; TEPP11 lucra 46% a mais e mira compra do Top CenterO fundo imobiliário Tellus Rio Bravo (TRBL11) divulgou seu relatório gerencial referente ao mês de outubro, reportando um resultado contábil negativo de R$ 324,26 mil. Esse número representa uma reversão significativa em comparação ao desempenho de setembro, quando o fundo havia registrado um lucro de R$ 2,024 milhões.
Autor  Pedro Augusto Prazeres
18 horas atrás
O fundo imobiliário Tellus Rio Bravo (TRBL11) divulgou seu relatório gerencial referente ao mês de outubro, reportando um resultado contábil negativo de R$ 324,26 mil. Esse número representa uma reversão significativa em comparação ao desempenho de setembro, quando o fundo havia registrado um lucro de R$ 2,024 milhões.
placeholder
Ibovespa sobe com alívio na curva de juros e falas de Galípolo; cíclicos lideram, enquanto Petrobras e Vale recuamO Ibovespa concentrou as atenções na política monetária nesta segunda-feira (24), repercutindo a revisão das estimativas para a Selic no Boletim Focus e novas declarações do presidente do Banco Central, Gabriel Galípolo.
Autor  Pedro Augusto Prazeres
18 horas atrás
O Ibovespa concentrou as atenções na política monetária nesta segunda-feira (24), repercutindo a revisão das estimativas para a Selic no Boletim Focus e novas declarações do presidente do Banco Central, Gabriel Galípolo.
placeholder
Franklin Templeton lança ETF de XRP na NYSE Arca; ativo sobe 8% com fim de barreira regulatóriaA Franklin Templeton, uma das maiores empresas de gestão de ativos do mundo, lançou oficialmente seu fundo negociado em bolsa (ETF) que rastreia o preço do token XRP. O produto estreou nesta segunda-feira na NYSE Arca sob o ticker XRPZ.
Autor  Pedro Augusto Prazeres
18 horas atrás
A Franklin Templeton, uma das maiores empresas de gestão de ativos do mundo, lançou oficialmente seu fundo negociado em bolsa (ETF) que rastreia o preço do token XRP. O produto estreou nesta segunda-feira na NYSE Arca sob o ticker XRPZ.
placeholder
A blockchain ZCash registrou pico de mineração e atividade de transações em novembro, superando Ethereum e SolanaZCash se tornou a segunda rede mais ativa, gerando US$ 47,5 milhões em taxas no último mês, ultrapassando Ethereum e Solana para se tornar a segunda maior geradora de taxas.
Autor  Cryptopolitan
19 horas atrás
ZCash se tornou a segunda rede mais ativa, gerando US$ 47,5 milhões em taxas no último mês, ultrapassando Ethereum e Solana para se tornar a segunda maior geradora de taxas.
Produtos relacionados
goTop
quote