


NZD/USD Price Forecast: Bullish momentum improves but 0.5630 keeps holding bulls
- The New Zealand Dollar bounces up above 0.5600 but remains capped below the top of the weekly range.
- The strong demand in a US 30-year Treasury bond auction on Thursday has eased pressure on yields and allowed for a moderate risk appetite.
- The widening RBNZ-Fed monetary policy divergence is acting as a headwind for NZD recovery.
The New Zealand Dollar (NZD) picks up against the US Dollar (USD) on Friday, as some easing in the global bonds’ rout has allowed for a modest recovery of risk appetite during the Asian session. The NZD/USD pair has returned above 0.5600, but remains unable to break the top of the weekly trading range, in the 0.5630-0.5640 area, which keeps price action relatively close to the 18-month lows, at 0.5580.
Investors’ mood brightened somewhat during Friday’s Asian session after a US 30-year bond auction was received with solid demand on Thursday, which pushed long-term Treasury yields down from multi-decade highs. The US Dollar Index (DXY), which measures the Greenback against a basket of six majors, is pulling back from 18-month lows, and risk-sensitive currencies like the Kiwi have found buyers.
From a wider perspective, however, the Kiwi remains one of the weakest major currencies in September, weighed by the increasing monetary policy divergence between the Reserve Bank of New Zealand (RBNZ) and the Federal Reserve (Fed). The RBNZ’s OCR rate, at 2.75%, is one of the lowest among the world’s main central banks. The Fed has raised its fed funds rate to the 3.75%-4% range over September and is expected to hike it at least by 50 further basis points in the next two quarters.
Technical Analysis: Potential double bottom at 0.5580
NZD/USD trades at 0.5615, with the broader bearish trend intact, although a potential double bottom at the 0.5580 area and the improving momentum on intraday charts are providing some hope of a deeper bullish correction. The 4-hour Relative Strength Index (14) is hovering around a neutral 54, and the Moving Average Convergence Divergence (MACD) is showing a slightly positive reading, yet this merely hints at stabilizing conditions rather than a clear bullish reversal.
Bulls need to break above the top of the consolidation range, in the 0.5630-0.5640 area, to confirm the double bottom pattern, and bring the September 24 and 28 highs, at 0.5687, into focus, ahead of the September 22 high, at 0.5740.
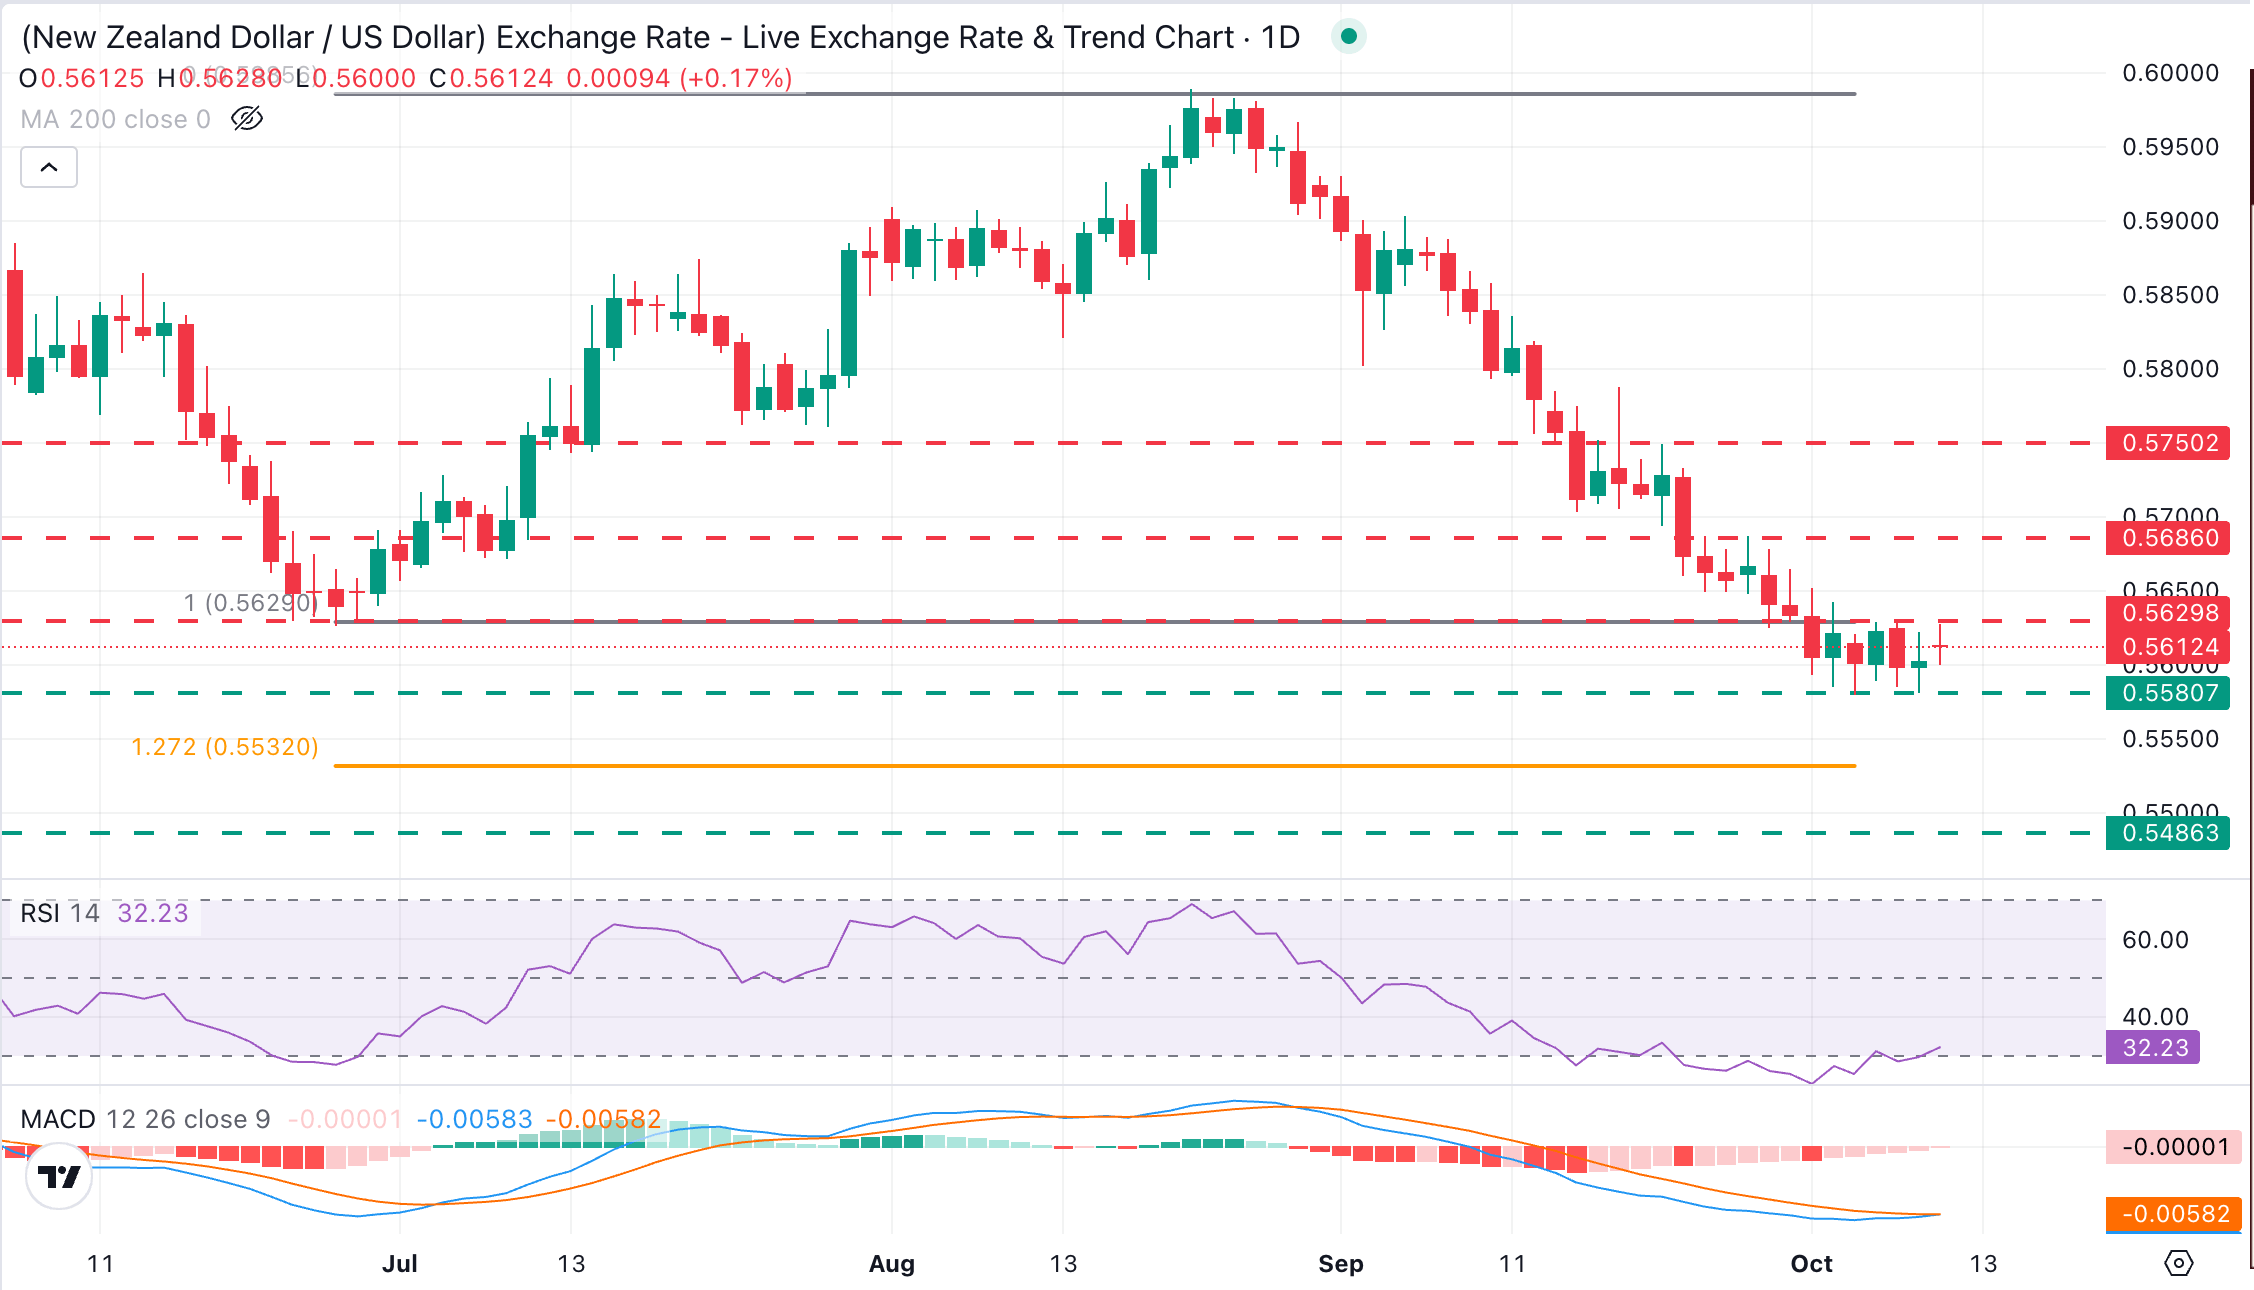
A bearish reaction below the 0.5580 support area (October 5 and 8 lows), on the contrary, would increase pressure towards the 127.2% Fibonacci retracement of the June-August rally, at 0.5530. Further down, the 2025 low, at 0.5485 is likely to be targeted.
(The technical analysis of this story was written with the help of an AI tool. Know more.)
New Zealand Dollar Price Today
The table below shows the percentage change of New Zealand Dollar (NZD) against listed major currencies today. New Zealand Dollar was the strongest against the Japanese Yen.
| USD | EUR | GBP | JPY | CAD | AUD | NZD | CHF | |
|---|---|---|---|---|---|---|---|---|
| USD | -0.12% | -0.08% | 0.30% | -0.00% | -0.30% | -0.16% | -0.21% | |
| EUR | 0.12% | 0.03% | 0.43% | 0.11% | -0.18% | -0.01% | -0.11% | |
| GBP | 0.08% | -0.03% | 0.40% | 0.10% | -0.21% | -0.04% | -0.09% | |
| JPY | -0.30% | -0.43% | -0.40% | -0.30% | -0.60% | -0.45% | -0.49% | |
| CAD | 0.00% | -0.11% | -0.10% | 0.30% | -0.32% | -0.16% | -0.19% | |
| AUD | 0.30% | 0.18% | 0.21% | 0.60% | 0.32% | 0.16% | 0.13% | |
| NZD | 0.16% | 0.01% | 0.04% | 0.45% | 0.16% | -0.16% | -0.03% | |
| CHF | 0.21% | 0.11% | 0.09% | 0.49% | 0.19% | -0.13% | 0.03% |
The heat map shows percentage changes of major currencies against each other. The base currency is picked from the left column, while the quote currency is picked from the top row. For example, if you pick the New Zealand Dollar from the left column and move along the horizontal line to the US Dollar, the percentage change displayed in the box will represent NZD (base)/USD (quote).
Artigos Recomendados


